Free energy of cluster formation and a new scaling relation for the nucleation rate
Abstract
Recent very large molecular dynamics simulations of homogeneous nucleation with Lennard-Jones atoms [Diemand et al. J. Chem. Phys. 139, 074309 (2013)] allow us to accurately determine the formation free energy of clusters over a wide range of cluster sizes. This is now possible because such large simulations allow for very precise measurements of the cluster size distribution in the steady state nucleation regime. The peaks of the free energy curves give critical cluster sizes, which agree well with independent estimates based on the nucleation theorem. Using these results, we derive an analytical formula and a new scaling relation for nucleation rates: is scaled by , where the supersaturation ratio is , is the dimensionless surface energy, and is a dimensionless nucleation rate. This relation can be derived using the free energy of cluster formation at equilibrium which corresponds to the surface energy required to form the vapor-liquid interface. At low temperatures (below the triple point), we find that the surface energy divided by that of the classical nucleation theory does not depend on temperature, which leads to the scaling relation and implies a constant, positive Tolman length equal to half of the mean inter-particle separation in the liquid phase.
pacs:
05.10.-a, 05.70.Np, 05.70.Fh, 64.60.QbI Introduction
The nucleation process of supersaturated vapors into liquids (or solids) has been studied for a long time, however, there is still a serious gap in our understanding. The classical nucleation theory (CNT)Volmer1926 ; Becker1935 ; Feder1966 is a very widely used model for describing nucleation and provides the nucleation rates as a function of temperature, supersaturation ratio, and macroscopic surface tension of a condensed phase. However, several studies have found that the CNT fails to explain the nucleation rates observed in experiments4-15. For example, the error is the order of for argon Iland2007 ; Sinha2010 . In addition to laboratory experiments, numerical simulations of molecular dynamics (MD) or Monte Carlo (MC) simulations showed that the nucleation rates obtained by numerical simulations are significantly different from predictions by the CNT16-38. Until now several modifications to the CNT were proposed. It was also noted that several nucleation rate data sets exhibited empirical temperature scalings Hale1986 ; Hale1992 ; Hale2005 ; Hale2010 . Although there have been significant advances in the theoretical models, a quantitatively reliable theoretical model does not yet exist.
Recently, Diemand et al. Diemand2013 presented large-scale molecular dynamics (MD) simulations of homogeneous vapor-to-liquid nucleation of Lennard-Jones atoms, covering up to 1.2 s ( steps). The simulations cover a wide range of temperatures and supersaturation ratios. This study measured various quantities such as nucleation rates, critical cluster sizes, and sticking probabilities of vapor molecules, and it was successful in quantitatively reproducing argon nucleation rates at the same pressures, supersaturations and temperatures as in the SSN (Supersonic Nozzle Nucleation) argon experiment Sinha2010 . Here we use these MD results to determine the free energies of cluster formation (Sec. III) and their scaling (Sec. IV), which is expected to be of use in the construction of a high-precision nucleation model.
II Empirical scaling relations
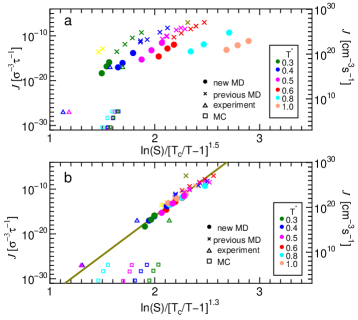
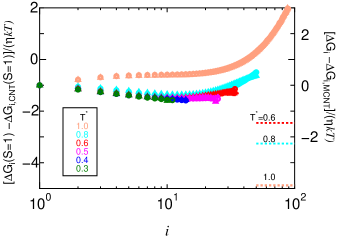
Hale and Thomason Hale2010 suggested that the nucleation rate obtained by MC simulations using LJ molecules was scaled by over a range of cm-3 s-1 which corresponds to , where , , , and are the temperature, critical temperature, a parameter of length ( Å), and a time unit ( ps). Figure 1 shows that nucleation rates obtained by the MD and MC simulations for LJ molecules and experimental results for argon as a function of and . The scaling by works for MC simulations over a limited range, however, the nucleation rates obtained by all MD simulations and some experiments are rather scaled by . The fitting function is . This linear, empirical scaling relation seems to work well over a surprisingly wide range of nucleation rates, for the MD data and the NPC (Nucleation Pulse Chamber) experiment Iland2007 , but not for the MC simulations. Interestingly, a different scaling relation, has been found from experimental nucleation rates for several different substances such as waterHale2005 , tolueneSchmitt1983 , and nonaneAdams1984 . Our results suggests the scaling relation depends on the substance type.
However, linear empirical scaling relations contradict one of the most basic, general expectations from nucleation theory: according to the nucleation theorem, the size of the critical cluster is determined by the derivative Kalikmanov ; Diemand2013 . These empirical scalings therefore imply a constant critical cluster size at each temperature over a wide range in . The corresponding free energy functions would need to peak at exactly the same size over a wide range in and , which seems impossible to achieve with any reasonably smooth surface energy function. Instead of a linear relation, one would instead expect some downward curvature in Fig. 1, which is consistent with the MD data points alone, but not in combination with the NPC experiment.
III Reconstructing the formation free energy from MD simulations
We now derive the free energies of cluster formation directly from MD results and compare them with predictions from three widely used models: In the (modified) classical nucleation theory CNT (or MCNT) and in the semi-phenomenological (SP) model Dillman1991 ; Laaksonen1994 , the free energies are respectively
| (1) | |||||
| (2) | |||||
| (3) |
where is the supersaturation ratio of monomers using the saturated vapor pressure and the partial pressure of monomers , and are temperature-dependent quantities which can be fixed from the condensed phase surface tension, bulk density and the second virial coefficient Dillman1991 ; Diemand2013 . Note that the CNT assumes large cluster sizes, it is not expected to work for small clusters and its does not vanish at , i.e., for monomers.
The formation free energy of a cluster is directly related to the equilibrium size distribution :
| (4) |
where is the number density of the monomers Wedekind2007 ; Tanaka2011 ; Diemand2013 . For small subcritical clusters (), the steady state size distribution , which can be measured in MD simulations, agrees very well with the equilibrium size distribution Yasuoka1998 , which lets us obtain for small clusters Yasuoka1998 ; Matsubara2007 ; Tanaka2011 ; Diemand2013 ; Tanaka2014 . Obtaining the full free energy landscape, including the crucial region around the critical sizes, requires a more sophisticated method, which takes the difference between steady state and equilibrium size distributions into account. A first procedure of this kind was proposed by Wedekind and RegueraWedekind2008 based on mean first passage time (MFPT) method. In principle it allows a full reconstruction based on a large number of small simulations, each one is run until it produces one nucleation event. However, the observation of one event does not demonstrate that the simulations are really sampling the assumed steady state nucleation regime, the passage times might include some initial lag time and a significant transient nucleation phase, which precedes the steady state regime Shneidman1999 . Both time-scales become quite large for LJ vapor-to-liquid nucleation at low temperatures Diemand2013 .
Our recent, very large scale nucleation simulations allow very precise measurements of the cluster size distribution during a clearly resolved steady state nucleation regime and under realistic constant external conditions Diemand2013 . Here we present a new method to obtain the full free energy landscape from these steady state size distributions: The nucleation rate is the net number of the transition from -mers to -mers and given by
| (5) |
where is the transition rate from a cluster of molecules, -mer, to (+1)-mer per unit time, i.e., the accretion rate, and is the transition rate from -mer to (-1)-mer per unit time, i.e., the evaporation rate of -mer. is given by , where is the sticking probability, is the thermal velocity, , and is the radius of a monomer, where is the mass of a molecule and is the bulk density. The evaporation rate is obtained from the principle of detailed balance in thermal equilibrium:
| (6) |
From Eqs.(5) and (6), the nucleation rate is given by
| (7) |
with the Zeldovich factor, .
From Eqs.(5) and (6), we obtain
| (8) |
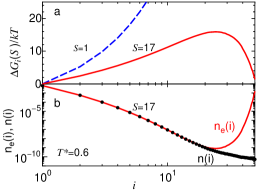
Equation (8) is a recurrence relation and enables us to obtain if and are known Tanaka2014 . Fig. 2 shows , , and derived by Eq. (8) for a typical example ( and which corresponds to the case T6n80 in Table III in Diemand et al. Diemand2013 ). is a surface term corresponding to the work required to form the vapor-liquid interface. From Eq. (8), we obtain :
| (9) |
using the dependence of the supersaturation in the theories except the CNT. Fig. 2 also shows .
The surface terms of free energy at various temperatures and supersaturation ratios obtained by MD simulations are shown in Figure 3, where we evaluated using obtained by the MD simulations (Table III in Diemand et al.). From Figure 3, we confirm depends only on temperature, which implies that the volume term in Eqs.(2) and (3) works very well.
The peaks of the free energy curves give critical cluster sizes which agree very well with those from the nucleation theorem (see Fig. 7). Since the nucleation rates, which enter into the nucleation theorem, do not depend on the detailed cluster definition, this good agreement provides a robust confirmation, that the simple Stillinger criterion used hereTanaka2011 ; Diemand2013 gives realistic cluster size estimates. An earlier studyWedekind2007 found that critical sizes based on the Stillinger definition are up to a factor 2 larger than independent estimates from the nucleation theorem. This contradiction can be resolved by a detailed comparison with other MD simulations at very similar conditionsTanaka2011 : Using the initial supersaturations in the nucleation theorem (as in Wedekind2007 ) instead of the actual supersaturation during the simulationTanaka2011 , leads one to underestimate the critical sizes by up to a factor of 1.8, which eliminates the discrepancy reported in Wedekind2007 .
IV A new scaling for nucleation rates
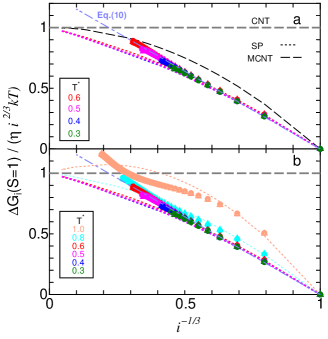
Fig. 4 shows the surface energy divided by that of the CNT, , as a function of . The theoretical evaluations are also shown in Fig. 4. The simulation results agree with the SP model at , but deviate from the model for larger clusters of . Surprisingly, is almost the same for all results obtained by 11 MD simulations for temperatures below the triple point. This indicates that is a function of and independent of the temperature. From the fitting of the results, we obtain
| (10) |
where . The fitting function is also shown by the dotted-dashed line in Fig. 4. Equation (10) implies a constant, positive Tolman length of and the constant sets an effective normalisation factor for the planar surface energy (or the surface area), if we interpret , where and are the surface tension and surface area of the cluster and is the planar surface tension. Equation (10) could be a promising candidate for an accurate nucleation theory, in which is temperature independent below the triple point. Our result indicates that at low temperatures the Tolman relation is valid even for very small clusters including 2-30 atoms.
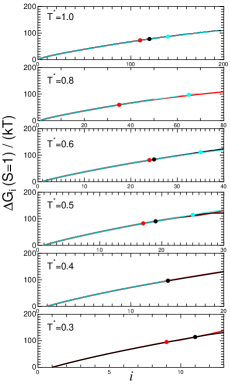
McGraw and LaaksonenMcGraw1996 ; McGraw1997 obtained of large clusters with density functional calculations. They found that the deviation of from the CNT is temperature dependent, but independent of the cluster size. Figure 5 shows the difference of between MD results and the CNT, i.e., as a function of . We find these differences are nearly constant around for each temperature. But they increase with the size for . According to McGraw and Laaksonen (1997)McGraw1997 , on the other hand, are calculated to be -2.46, -3.26, and -4.88 for , and 1.0, respectively.
Using Eq. (10), the critical cluster is obtained by
| (11) |
from the following relation
| (12) |
where we have assumed that the molecular volume is far smaller in the liquid phase than in the gas phase. The detailed derivation is given in the Appendix.
We also derive the analytical formula for the nucleation rate:
| (13) |
where is a dimensionless nucleation rate defined by with the saturated number density of monomers and the Zeldvich factor is given by
| (14) |
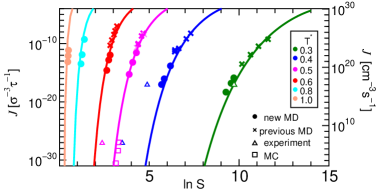
Fig. 6 shows the nucleation rate as a function of obtained by the MD simulations and the analytical formula. We find good agreements between the analyses and the simulations for the various temperatures and supersaturation ratios.
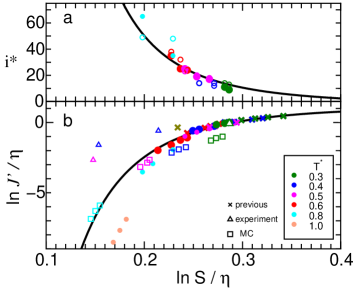
Our finding that is independent of the temperature leads to a scaling relation. Equation (12) indicates that is a function of only . Thus from Eq. (13) is determined only by , neglecting a term including Zeldovich factor which is smaller than the other terms. Fig. 7 shows the size of critical clusters and obtained by MD and MC simulations and experiments as a function of . We confirm that is scaled by almost perfectly for MD simulations, at . At high temperatures (), deviates from the scaling relation. This would come from the deviation of , i.e., depends on at (see Fig. 4(b)). Fig. 7 shows this scaling also works for one SNN experiment () and the MC simulations at and 0.7, although some MC data and experiments deviate from the scaling relation.
V Summary and conclusions
We derived for the first time the formation free energy of a cluster over a wide range of cluster sizes and temperatures from recent very large-scale MD simulations. The peaks of the free energy curves give critical cluster sizes, which agree well with independent estimates based on the nucleation theorem. This implies that the simple Stillinger criterion used here gives realistic cluster size estimates.
At low temperatures the free energies show a universal deviation from the CNT, which allows us to derive a new scaling relation for nucleation: is scaled by . This scaling relation predicts the critical cluster size very well. The relation can be explained from a surface energy required to form the vapor-liquid interface and implies a constant, positive Tolman length of . Generally, is written as the surface energy multiplied by the surface area, . In the theory, the cluster is always assumed to be spherical and has the same density as the bulk liquid. However, our analyses of cluster properties show larger surface areas (Angélil et al. Angelil2014 ). The higher normalisation ( in Eq. (10)) of relative to the models might be caused by these larger surface areas. The scaling relation and the relation between the cluster properties and should be investigated in more detail for various materials.
VI Acknowledgments
We thank the anonymous reviewers for their valuable suggestions which have improved the quality of the paper. This work was supported by the Japan Society for the Promotion of Science (JSPS). J.D. and R.A. acknowledge support from the Swiss National Science Foundation (SNSF).
VII Appendix
The general expression for the minimum work required to form a cluster of radius , is given bylandau
| (15) |
where and are the chemical potentials of liquid and gas, and are the pressures of metastable liquid and gas, and and are the molecular volumes of liquid and the volumes of a cluster respectively. Using and , we obtain
where is the molecular volume in the gas phase. For the case , the second term on the right hand side of Eq. (LABEL:app1) is negligible. Assuming , we obtain the formula for the critical radius called the Kelvin relationLaaksonen1996 from :
| (17) |
where .
References
- (1) M. Volmer and A. Weber, Z. Phys. Chem. 119, 277 (1926).
- (2) V. R. Becker and W. Döring, Ann. Phys. 416, 719 (1935).
- (3) J. Feder, K. C. Russell, J. Lothe, and G. M. Pound, Adv. Phys. 15, 111 (1966).
- (4) R. J. Anderson, R. C. Miller, J. L. Kassner, and D. E. Hagen, J. Atmos. Sci. 37, 2508 (1980).
- (5) J. L. Schmitt, G. W. Adams, and R. A. Zalabsky, J. Chem. Phys. 77, 2089 (1982).
- (6) J. L. Schmitt, R. A. Zalabsky, and G. W. Adams, J. Chem. Phys. 79, 4496 (1983).
- (7) G. W. Adams, J. L. Schmitt, and R. A. Zalabsky, J. Chem. Phys. 81, 5074 (1984).
- (8) A. Dillman and G. E. A. Meier, J. Chem. Phys. 94, 3872 (1991).
- (9) D. W. Oxtoby, J. Phys.: Condens. Matter 4, 7627 (1992).
- (10) Y. Viisanen, R. Strey, and H. Reiss, J. Chem. Phys. 99, 4680 (1993).
- (11) A. Laaksonen, I. J. Ford, and M. Kulmala, Phys. Rev. E 49, 5517 (1994).
- (12) Y. Viisanen and R. Strey, J. Chem. Phys. 101, 7835 (1994).
- (13) K. Hämeri and M. Kulmala, J. Chem. Phys. 105, 7696 (1996).
- (14) K. Iland, J. Wölk, R. Strey, and D. Kashchiev, J. Chem. Phys. 127, 154506 (2007).
- (15) S. Sinha, A. Bhabhe, H. Laksmono, J. Wölk, R. Strey, and B. Wyslouzil, J. Chem. Phys. 132, 064304 (2010).
- (16) K. Yasuoka and M. Matsumoto, J. Chem. Phys. 109, 8451 (1998).
- (17) K. Yasuoka and M. Matsumoto, J. Chem. Phys. 109, 8463 (1998).
- (18) P. R. ten Wolde and D. Frenkel, J. Chem. Phys. 109, 9901 (1998).
- (19) K. J. Oh and X. C. Zeng, J. Chem. Phys. 110, 4471 (1999).
- (20) B. Senger, P. Schaaf, D. S. Corti, R. Bowles, D. Pointu, J.-C. Voegel, and H. Reiss, J. Chem. Phys. 110, 6438 (1999).
- (21) P. R. ten Wolde, M. J. Ruiz-Montero, and D. Frenkel, J. Chem. Phys. 110, 1591 (1999).
- (22) K. Laasonen, S.Wonczak, R. Strey, and A. Laaksonen, J. Chem. Phys. 113, 9741 (2000).
- (23) K. J. Oh and X. C. Zeng, J. Chem. Phys. 112, 294 (2000).
- (24) H. Vehkamäki and I. J. Ford, J. Chem. Phys. 112, 4193 (2000).
- (25) B. Chen, J. I. Siepmann, K. J. Oh, and M. L. Klein, J. Chem. Phys. 115, 10903 (2001).
- (26) P. Schaaf, B. Senger, J.-C. Voegel, R. K. Bowles, and H. Reiss, J. Chem. Phys. 114, 8091 (2001).
- (27) J. Wöld and R. Strey, J. Phys. Chem. B 105, 11683, (2001).
- (28) J. Merikanto, H. Vehkämaki, and E. Zapadinsky, J. Chem. Phys. 121, 914 (2004).
- (29) K. K. Tanaka, K. Kawamura, H. Tanaka, and K. Nakazawa, J. Chem. Phys. 122, 184514 (2005).
- (30) H. Matsubara, T. Koishi, T. Ebisuzaki, and K. Yasuoka, J. Chem. Phys. 127, 214507 (2007).
- (31) J. Wedekind, J. Wölk, D. Reguera, and R. Strey, J. Chem. Phys. 127, 154515 (2007).
- (32) M. Horsch, J. Vrabec, and H. Hasse, Phys. Rev. E 78, 011603 (2008).
- (33) M. Horsch, and J. Vrabec, J. Chem. Phys. 131, 184104 (2009).
- (34) J. Wedekind, G. Chkonia, J. Wölk, R. Strey, and D. Reguera, J. Chem. Phys. 131, 114506 (2009).
- (35) I. Napari, J. Julin, and H. Vehkamäki, J. Chem. Phys. 133, 154503 (2010).
- (36) K. K. Tanaka, H. Tanaka, T. Yamamoto, and K. Kawamura, J. Chem. Phys. 134, 204313, (2011).
- (37) J. Diemand, R. Angélil, K. K. Tanaka, and H. Tanaka, J. Chem. Phys. 139, 074309. (2013).
- (38) K. K. Tanaka, A. Kawano, and H. Tanaka, J. Chem. Phys. 140, 114302 (2014).
- (39) B. N. Hale, Phys. Rev. A 33, 4156 (1986).
- (40) B. N. Hale, Metall. Trans. A 23A, 1863 (1992).
- (41) B. N. Hale, J. Chem. Phys. 122, 204509 (2005).
- (42) B. N. Hale and M. Thomason, Phys. Rev. Let. 105, 046101 (2010).
- (43) V. I. Kalikmanov, Nucleation theory, Lecture notes in Physics (Springer, Dordrecht, 2013) , Vol. 860.
- (44) J. Wedekind and D. Reguera, J. Phys. Chem. B 112, 11060 (2008).
- (45) V. Shneidman, K. Jackson, and K. Beatty, Phys. Rev. B 59, 3579 (1999)
- (46) R. McGraw and A. Laaksonen, Phys. Rev. Lett. 76, 2754 (1996).
- (47) R. McGraw and A. Laaksonen, J. Chem. Phys. 106, 5284 (1997).
- (48) R. Angélil, J. Diemand, K. K. Tanaka, and H. Tanaka, J. Chem. Phys. 140, 074303 (2014).
- (49) L. D. Landau and E. M. Lifshitz, Stastistical Physics (Pergamon press, Oxford, 1980), section 162.
- (50) A. Laaksonen and R. McGraw, Europhys. Lett. 35, 367 (1996).