Warm Molecular Gas in Luminous Infrared Galaxies111Based on Herschel observations. Herschel is an ESA space observatory with science instruments provided by European-led Principal Investigator consortia and with important participation from NASA.
Abstract
We present our initial results on the CO rotational spectral line energy distribution (SLED) of the to 1 transitions from up to from Herschel SPIRE spectroscopic observations of 65 luminous infrared galaxies (LIRGs) in the Great Observatories All-Sky LIRG Survey (GOALS). The observed SLEDs change on average from one peaking at to a broad distribution peaking around 67 as the IRAS 60-to-100 µm color, , increases. However, the ratios of a CO line luminosity to the total infrared luminosity, , show the smallest variation for around 6 or 7. This suggests that, for most LIRGs, ongoing star formation (SF) is also responsible for a warm gas component that emits CO lines primarily in the mid- regime (). As a result, the logarithmic ratios of the CO line luminosity summed over CO (54), (65), (76), (87) and (109) transitions to , , remain largely independent of , and show a mean value of () and a sample standard deviation of only 0.10 for the SF-dominated galaxies. Including additional galaxies from the literature, we show, albeit with small number of cases, the possibility that galaxies, which bear powerful interstellar shocks unrelated to the current SF, and galaxies, in which an energetic active galactic nucleus contributes significantly to the bolometric luminosity, have their higher and lower than , respectively.
Subject headings:
galaxies: active — galaxies: ISM — galaxies: star formation — infrared: galaxies — ISM: molecules — submillimeter: galaxies1. INTRODUCTION
Luminous Infra-Red Galaxies [LIRGs, defined as (81000 µm) L⊙] dominate the cosmic star formation (SF) at (Le Flóch et al. 2005; Magnelli et al. 2009). The local counterparts are all known to be rich in molecular gas (Sanders & Mirabel 1996). While the CO (10) line has been widely used to trace total molecular gas content, SF occurs in the denser parts of molecular gas as evidenced by correlations between and dense gas tracers, such as HCN (10) (e.g., Gao & Solomom 2004; Wu et al. 2005). SF is expected to heat up the molecular gas substantially. The resulting warm gas can be better traced by mid- CO line transitions such as CO (65), which has a critical density of 3cm-3 and an excitation temperature of 116 K (Carilli & Walter 2013), hinted already by limited ground-based CO data (e.g., Bayet et al. 2009).
We have carried out a survey of warm molecular gas for a sample of 125 LIRGs belonging to the Great Observatories All-Sky LIRG Survey (GOALS; Armus et al. 2009), by obtaining line fluxes of the CO to 1 transitions from up to 13 with the SPIRE Fourier Transform Spectrometer (FTS; Griffin et al. 2010) on-board Herschel (Pilbratt et al. 2010). The other targeted lines include [N ii] 205 µm, [C i] 609 µm and [C i] 370 µm. The program and observational data on individual galaxies will be given in full in a future paper (Lu et al 2014; in preparation). An earlier paper (Zhao et al. 2013) presented the initial results on how the [N ii] 205 µm line correlates with the SF rate. In this paper we report our initial findings on the observed CO line emission for 65 sample galaxies from the early Herschel observations. We provide a brief description of our survey program and data reduction in §2, and present our results and discuss physical implications on gas and dust heating in §3.
2. The Sample, Observations and Data Reduction
Our full FTS sample is a flux-limited subset of the GOALS sample, which contains 202 LIRGs down to Jy, by further satisfying (81000 µm) W m-2, where is as defined in Sanders & Mirabel (1996) and the conversion between and used the luminosity distance given in Table 1 in Armus et al. (2009). Galaxies in a pair were treated separately with their individual derived as in Díaz-Santos et al. (2010). Our FTS sample contains 7 galaxies with . Ninety-three galaxies were eventually observed by us (program ID: OT1-nlu-1) using the high resolution, sparse mode centered on each galaxy. The remainder have archived FTS data. Our own program emphasized detections of the mid- CO lines (i.e., ). The on-target integration times range from 1,332 to 7,992 sec, set to detect the anticipated CO (65) flux at S/N .
The 65 galaxies chosen for this paper are practically point-like sources with respect to the SPIRE beams (see Zhao et al. 2013), including 38 from own observations, 24 archived observations originally from the HerCULES program (PI: P. van der Werf; van der Werf et al. 2010), UGC 05101 and NGC 7130 from Pereira-Santaella et al (2013), and Arp 220 from Rangwala et al. (2011). The SPIRE data were reduced homogeneously using Herschel Interactive Processing Environment (HIPE), version 9 (Ott 2010), which offers a line flux accuracy better than 10%. The final spectrum was extracted from the two central detectors (SSWD4 and SLWC3). As an example, Fig. 1 shows the spectrum of IRAS 17578-0400, a starburst with and IRAS 60-to-100 µm flux density ratio (also referred to as FIR color), , with the fitted CO, [C i] ad [N ii] lines marked.
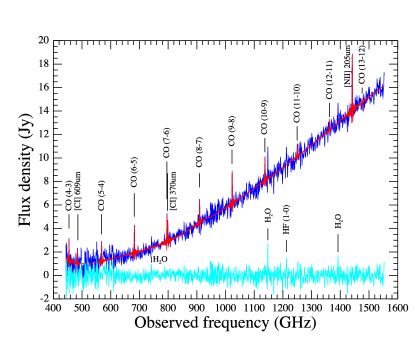
We used the spectrum fitter in HIPE to simultaneously fit a polynomial (of order 5) to the continuum and SINC functions in frequency to the targeted lines. For each SINC profile, only its FWHM was fixed at 1.44 GHz. A line was regarded as being detected if (a) the fitted line flux is greater than 3 times the r.m.s. noise, measured within a frequency interval of 20 FWHM wide, centered on the line frequency in the residual spectrum, and (b) its inferred line velocity difference with the (usually) brightest [N ii] 205 µm line is within the expected uncertainty based on the spectral resolution and data sampling frequency. The SINC line profiles were adequate for all the CO lines detected in nearly all sources. The only clear exception was NGC 6240, for which the broad CO lines are partially resolved and were fit with a Gaussian convolved profile using the algorithm described in Zhao et al. (2013).
3. Results and Discussion
3.1. CO Spectral Line Energy Distribution
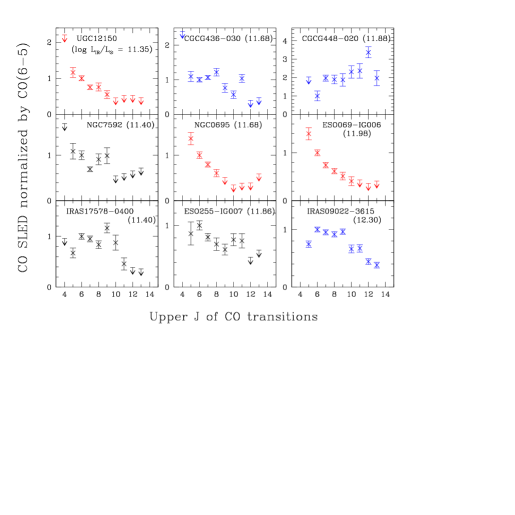
Fig. 2 shows 9 examples of the observed CO spectral line energy distributions (SLEDs) from our own observations, in order of increasing . These plots illustrate that is not the best predictor for the SLED shapes. For example, CGCG 448-020 and ESO 069-IG006 are similar in , but have very different CO SLEDs: The SLED of the former peaks at while that of the latter peaks at . This difference is mainly due to their different dust temperatures: for CGCG 448-020 vs. for ESO 069-IG006. To show how , which measures the average intensity of the dust heating radiation field (Tuffs & Popescu 2003), correlates with the SLED shape, we color-coded the SLEDs in Fig. 2 on . Almost all the red-colored SLEDs, with , peak at with the line fluxes decreasing rapidly as increases. In contrast, the blue-colored SLEDs, with , are dominated by a broad distribution over . This suggests that it is the intensity of the radiation field, rather than , which determines the SLED shape.
Fig. 3 plots the logarithmic CO line luminosity, normalized by , as a function of for CO (43), CO (65), CO (76) and CO (1211). An undetected CO line is shown with its 3 upper limit. The average fractional AGN contribution to the bolometric luminosity, , has been derived for most of the GOALS galaxies. This was from a set of the mid-IR diagnostics based on [Ne v]/[Ne ii], [O iv]/[Ne ii], continuum slope, PAH equivalent width and the diagram of Laurent et al. (2000), following the prescriptions in Armus et al. (2007) (see also Petric et al. 2011; Stierwalt et al. 2013). Of the galaxies used here, only two have (i.e., 56% for Mrk 231 and 60% for IRASF 05189-2524). The remainder all have , including only 3 galaxies with between 30 and 40%, and are thus SF dominated. In Fig. 3, the two galaxies with are further enclosed by a circle.
All the plots in Fig. 3 span 1.6 dex vertically so that the sample dispersions can be visually compared. The dotted line in each plot helps identifying the most energetic CO line at any given by noticing that a galaxy lies on a vertical line across the plots. Fig. 3 shows that as increases, the overall CO gas gets warmer: The slope of the linear fit (i.e., the dashed line in each plot) to the detections only (but excluding the outlier NGC 6240) increases monotonically from about -0.8 for CO (43) to +0.7 for CO (1211). Both plots of CO (43) and CO (1211) contain quite a few upper limits. We performed two tests on whether the fitted slope could be substantially biased due to the non-detections: (a) a full regression including the upper limits based on a survival analysis outlined by Isobe et al. (1986), and (b) using only the detections from the 27 galaxies with the more sensitive CO data from the Herschel archive, for which there are fewer upper limits. The results from both tests confirm, within the fit uncertainties, that the slopes derived from the fits to the detections are representative of the entire sample.
A more significant message from Fig. 3 is that the ratio of CO (65) or CO (76) to the IR emission is rather constant over the range of probed. This argues for at least two gas components: A warm component, which emits the CO lines primarily in mid- (i.e., ) and correlates best with the dust emission, is mainly responsible for the observed constant ratio seen around or 7. Since the dominant heating source for the IR emission is current SF, the same ongoing SF should be also responsible for this warm CO gas component. The other component is a “cold” and predominantly less dense gas that emits CO lines primarily at and is not directly related to current SF. As increases, the warm gas component becomes more energetic, resulting in the trend seen in Figs. 2 and 3. As we argue in §3.2, in galaxies with a prominent AGN, there could also be a meaningful third component of hot and likely denser gas, which emits CO lines primarily at and is thus not sampled adequately by the SPIRE spectrometer.


3.2. Molecular Gas and Dust Heating
Various heating mechanisms have been considered in the literature for warm CO line emission in galaxies, including far-UV photon heating from massive stars (hereafter referred to as photon dominated region or PDR scenario) (e.g., IC 342, Rigopoulou et al. 2013), X-ray photon heating from AGNs (referred to as X-ray dominated region or XDR scenario) (e.g., Mrk 231, van der Werf et al. 2010; NGC 1068, Spinoglio et al. 2012), heating by cosmic-rays enhanced from supernovae (e.g., NGC 253; Bradford et al. 2003), and interstellar shocks (e.g., Flower & Pineau Des Forêts 2010). The shock scenario has been favored in many cases, including M 82 (Kamenetzky et al. 2012), Arp 220 (Rangwala et al. 2011), NGC 891 (Nikola et al. 2011), NGC 253 (Rosenberg et al. 2014), NGC 6240 (Meijerink et al. 2013), and NGC 1266 (Pellegrini et al. 2013). In this paper, we further divide the shock scenario into two categories: (A) shocks associated with processes derived from current SF, such as supernovae and stellar winds; and (B) shocks that derive from energy sources other than current SF, such as those associated with AGN-driven gas outflows, radio jets, or galaxy-galaxy collision. While studies of XDR point to CO SLEDs peaking well beyond mid- (e.g., Spaans & Meijerink 2008), all the other heating mechanisms can, in principle, produce similar CO SLEDs within the mid- regime, making them difficult to be differentiated based on SPIRE CO data alone.
In Fig. 4, we sum over the mid- CO lines of 5, 6, 7, 8 and 10, and plot in log the resulting luminosity to ratio, , as a function of . [The CO (98) line was left out because the FTS spectra are usually noisier around its frequency.] Our sample galaxies are in solid or open squares, with the latter representing those with one or more of the CO lines undetected. For these galaxies, we present the possible range for between the 0 and 3 values for the undetected lines. In most of these cases, the actual ratio should be much closer to the upper end of the range as most of the undetected lines in the mid- regime have a fitted line flux not far below the 3 threshold. Overall, shows little systematic dependence on , except for (i) , where more data points (e.g., Mrk 231) tend to lie below the sample mean, and (ii) the clear outlier NGC 6240. As comparison cases, we also plot in Fig. 4 four additional galaxies indicated by crosses. Three are from the references listed above: M 82, an archetypical starburst; NGC 1266, a disk galaxy with possible AGN-driven molecular outflows (Alatalo et al. 2011); and NGC 1068, a well-known Seyfert galaxy with its CO line emission detected up to (Hailey-Dunsheath et al. 2012) and (Telesco & Decher 1988). M 82 is slightly extended and its used here was limited to within the same beam size as for the CO SLED. The fourth object is 3C 293, a radio galaxy rich in warm H2, possibly excited by radio jet-driven shocks (Ogle et al. 2010). From the archival SPIRE spectrum of 3C 293 (Obs. ID: 1342238242; PI: P. Papadopoulos), we derived the fluxes of 1.69, 2.91 and 2.14 W m-2 for CO (65), CO (76) and CO (87), respectively, all at S/N , but only the 3 upper limits of 5.49 and 3.15 W m-2 for CO (54) and CO (109), respectively. Its W m-2, based on an 12 µm flux from Siebenmorgen et al. (2004) and IRAS flux densities at 25, 60 and 100 µm from Golombek, Miley & Beugebauer (1988). The galaxy 3C 293 is shown in Fig. 4 by its possible range in . In both NGC 1266 and 3C 293, our estimated , based on [O iv]/[Ne ii] from Dudik, Satyapal & Marcu (2009) or Ogle et al. (2010).
The relatively small sample scatter in Fig. 4 for the SF-dominated LIRGs (except for NGC 6240) suggests convincingly that the current SF is also the main heating source for the mid- CO line emission. If we exclude NGC 6240 on one side of the main locus and the two AGNs from our sample on the other side, the average and sample standard deviation of from the remaining detections in our own sample are (; i.e., the dashed line in Fig. 4) and (; marked by the two dotted lines in Fig. 4), respectively.
NGC 6240 has , which is 8 above . The starburst superwinds in NGC 6240 are believed to power the large-scale diffuse ionized gas (e.g., Heckman et al. 1987) and shock-excited H2 line emission (e.g., Max et al. 2005). It is not clear how a category-A shock case can lead to such a high . The energy output of stellar winds should scale in certain way with that of the far-UV photons powering , resulting in around some characteristic value. Indeed, all the other superwind galaxies (e.g., Arp 220 and M 82) show a “normal” . The fact that no galaxies are seen at intermediate values argues against the hypothesis that NGC 6240 represents an optimal wind-gas coupling efficiency. Therefore, we can not rule out the possibility that some forms of category-B shocks might also be at work in the nuclear region of NGC 6240, where the gas is highly turbulent (Tacconi et al. 1999) and the heating source of the warm H2 emission is still controversial, with arguments for (e.g., Ohyama et al. 2000) and against (e.g., Feruglio et al. 2013) a superwind case. A category-B shock scenario can in principle explain a higher as there is little far-UV counterpart. Indeed, both NGC 1266 and 3C 293, where the warm CO emission might be enhanced respectively by the AGN- and radio jet-driven shocks, show a higher in Fig. 4.
On the other hand, both Mrk 231 and NGC 1068 have a lower in Fig. 4. They both have significant hot CO gas emitting at (González-Alfonso et al. 2014; Hailey-Dunsheath et al. 2012), likely associated with XDR (van der Werf et al. 2010; Spinoglio et al. 2012). Furthermore, the model prediction that the XDR-associated CO emission occurs mainly at higher levels is also supported by the observation that, with comparable , M 82 and Mrk 231 have almost identical CO SLEDs for (Pereira-Santaella et al. 2013). These results suggest that an significantly lower than may be a result of missing most of the XDR-associated CO line cooling at . However, not all the galaxies with a lower CO/IR ratio in Fig. 4 have a powerful AGN. One marked example is CGCG 448-020, of which is dominated by an extremely compact, extranuclear starburst (Inami et al. 2010). This might hint that a lower could also be associated with some rare, extreme starbursts as a large-scale version of those Galactic extreme compact molecular cores where the CO line emission peaks at (Etxaluze et al. 2013; Habart et al. 2010).
Under the assumption that AGN/XDR results in CO line emissions mainly at , one can use Fig. 4 to estimate the fractional AGN contribution to in an AGN where no significant Category-B shock is present: The measured , where is the AGN component of . For example, the observed of for Mrk 231 implies that (), in good agreement with from our mid-IR diagnostics. In the case of NGC 1068, we have (), in good agreement with an independent estimate in Telesco & Decher (1988).
In summary, (1) we demonstrated that the SF-dominated LIRGs show a relatively tight distribution in terms of , with a mean of and a sample standard deviation of ; and (2) we showed, albeit with small number of cases, the possibility that (a) galaxies bearing powerful interstellar shocks not associated with current SF and (b) galaxies with a significant AGN contribution to their bolometric luminosity, have their higher and lower than , respectively.
While it is rather conclusive that the heating source of the mid- CO line emission in most LIRGs is current SF, more work needs to be done to clarify which SF-related mechanisms are directly responsible for the warm CO line emission.
References
- (1) Alatalo, K., Blitz, L., Young, L. M., et al. 2011, ApJ, 735, 88
- (2) Armus, L., Charmandaris, V., Bernard-Salas, J., et al. 2007, ApJ, 656, 148
- (3) Armus, L., Mazzarella, J. M., Evans, A. S., et al. 2009, PASP, 121, 559
- (4) Bayet, E., Gerin, M., Philips, T. G., & Contursi, A. 2009, MNRAS, 399, 264
- (5) Bradford, C. M., Nikola, T., Stacey, G. J., Bolatto, A. D., Jackson, J. M., Savage, M. L., Davidson, J. A., & Higdon, S. J. 2003, ApJ, 586, 891
- (6) Carilli, C. L., & Walter, F. 2013, ARA&A, 51, 105
- (7) Díaz-Santos, T., Charmandaris, V., Armus, L., et al. 2010, ApJ, 723, 993
- (8) Dudik, R. P., Satyapal. S., & Marcu, D. 2009, ApJ, 691, 1501
- (9) Etxaluze, M., Goicoechea, J. R., Cernicharo, J., et al. 2013, A&A, 556, A137
- (10) Feruglio, C., Fiore, F., Piconcelli, E., Cicone, C., Maiolino, R., Davies, R., & Sturm, E. 2013, A&A, 558, A87
- (11) Flower, D. R., & Pineau Des Forêts, G. 2010, MNRAS, 406, 1745
- (12) Gao, Y, & Solomon, P. M. 2004, ApJ, 606, 271
- (13) Golombek, D, Miley, G. K., & Neugebauger, G. 1988, AJ, 95, 26
- (14) González-Alfonso, E., Fischer, J., Graciá-Carpio, J., et al. 2014, A&A, 561, A27
- (15) Griffin, M. J., Abergel, A., Abreu, A., et al. 2010, A&A, 518, L3
- (16) Habart, E., Dartois, E., Abergel, A., et al. 2010, A&A, 518, L116
- (17) Hailey-Dunsheath, S., Sturm, E., Fischer, J., et al. 2012, ApJ, 755, 57
- (18) Heckman, T. M., Armus, L., Miley, G. K., 1987, AJ, 93, 276
- (19) Inami, H., Armus, L., Surace, J. A., et al. 2010, AJ, 140, 63
- (20) Isobe, T., Feigelson, E. D., & Nelson, P. I. 1986, ApJ, 306, 490
- (21) Kamenetzky, J., Glenn, J., Rangwala, N., et al. 2012, 753, 70
- (22) Laurent, O, Mirabel, I. F., Charmandaris, V., Gallais, P., Madden, S. C., Sauvage, M., Vigroux, L., & Cesarsky, C. 2000, A&A, 359, 887
- (23) Le Flóch, E., Papovich, C., Dole, H., et al. 2005, ApJ, 632, 169
- (24) Magnelli, B., Elbaz, D., Chary, R. R., Dickinson, M., Le Borgne, D., Frayer, D. T., & Willmer, C. N. A. 2009, A&A, 496, 57
- (25) Max, C. E., Canalizo, G., Macintosh, B. A., Raschke, L., Whysong, D., Antonucci, R., & Schneider, G. 2005, ApJ, 621, 738
- (26) Meijerink, R., Kristensen, L. E., Weiß, A., et al. 2013, ApJ, 762, L16
- (27) Nikola, T., Stacey, G. J., Brisbin, D., et al. 2011, ApJ, 742, 88
- (28) Ogle, P., Boulanger, F., Guillard, P., et al. 2010, ApJ, 1193
- (29) Ohyama, Y., Yoshida, M., Takata, T., et al. 2000, PASJ, 52, 563
- (30) Ott, S., 2010, ASPC, 434, 139
- (31) Pellegrini, E. W., Smith, J. D., Wolfire, M. G., et al. 2013, ApJ, 779, L19
- (32) Pereira-Santaella, M., Spinoglio, L., Busquet, G., et al. 2013, ApJ, 768, 55
- (33) Petric, A. O., Armus, L., Howell, J., et al. 2011, ApJ, 730, 28
- (34) Pilbratt, G. L., Riedinger, J. R., Passvogel, T. et al. 2010, A&A, 518, L1
- (35) Rangwala, N., Maloney, P. R., Glenn, J., et al. 2011, ApJ, 743, 94
- (36) Rigopoulou, D., Hurley, P. D., Swinyard, B. M., et al. 2013, MNRAS, 434, 2051
- (37) Rosenberg, M. J. F., Kazandjian, M. V., van der Werf, P. P., Israel, F. P., Meijerink, R., Weiß, A., Requena-Torres, M. A., & Güsten, R., 2014, A&A, 564, A126
- (38) Sanders, D. B., & Mirabel, I. F. 1996, ARA&A, 34, 749
- (39) Siebenmorgen, R., Freudling, W., Krugel, E., & Baas, M. 2004, A&A, 421, 129
- (40) Spaans, M., & Meijerink, R. 2008, ApJ, 678, L5
- (41) Spinoglio, L., Pereira-Santaella, M., Busquet, G., et al. 2012, ApJ, 758, 108
- (42) Stierwalt, S., Armus, L., Surace, J. A., et al. 2013, ApJS, 206, 1
- (43) Tacconi, L. J., Genzel, R., Tecza, M., Gallimore, J. F., Downes, D., & Scoville, N. Z. 1999, ApJ, 524, 732
- (44) Telesco, C. M., & Decher, R. 1988, ApJ, 334, 573
- (45) Tuffs, R. J., & Popescu, C. C. 2003, in ESA Publications Series, ESA SP-511, Exploiting the ISO Data Archive. Infrared Astronomy in the Internet Age, ed. C. Gry, S. Peschke, J. Matagne, P. Garcia-Lario, R. Lorente, & A. Salama (Noordwijk, the Netherlands: ESA Publication Division, European Space Agency), 239 (astro-ph/0209622)
- (46) van der Werf, P. P., Isaak, K. G., Meijerink, R., et al. 2010, A&A, 518, L42
- (47) Wu, J., Evans, N. J., II, Gao, Y., Solomon, P. M., Shirley, Y. L., & Vanden Bout, P. A. 2005, ApJ, 635, 173
- (48) Zhao, Y., Lu, N., Xu, C. K., et al. 2013, ApJ, 765, L13