Frontier Fields: High-Redshift Predictions And Early Results
Abstract
The Frontier Fields program is obtaining deep Hubble and Spitzer Space Telescope images of new “blank” fields and nearby fields gravitationally lensed by massive galaxy clusters. The Hubble images of the lensed fields are revealing nJy sources (AB mag 31), the faintest galaxies yet observed. In this paper, we present high-redshift () number count predictions for the full program and candidates in three of the first Hubble Frontier Fields images. The full program will transform our understanding of galaxy evolution in the first 600 million years (). Where previous programs yielded perhaps a dozen candidates, the Frontier Fields may yield 70 (6 per field). We base this estimate on an extrapolation of luminosity functions observed between and gravitational lensing models submitted by the community. However, in the first two deep infrared Hubble images obtained to date, we find candidates but no strong candidates at . This might suggest a deficit of faint galaxies as also reported in the Ultra Deep Field (even while excesses of brighter galaxies were reported in shallower fields). At these redshifts, cosmic variance (field-to-field variation) is expected to be significant (greater than %) and include clustering of early galaxies formed in overdensities. The full Frontier Fields program will significantly mitigate this uncertainty by observing six independent sightlines each with a lensing cluster and nearby blank field.
Subject headings:
early universe – galaxies: high redshift – cosmology: dark ages, reionization, first stars – galaxies: evolution – gravitational lensing: strong – galaxies: clusters1. Introduction
Discovering the first galaxies (Bromm & Yoshida, 2011; Dunlop, 2013) and determining their role in reionizing the universe (Robertson et al., 2013) are frontier research areas of extragalactic astronomy. The Hubble and Spitzer Space Telescopes (HST and SST) are steadily discovering more distant high-redshift galaxies at earlier times with the Wide Field Camera 3 infrared channel (WFC3/IR; Kimble et al. 2008) and Infrared Array Camera (IRAC; Fazio et al. 2004), respectively. Gravitational lensing by galaxy clusters (Kneib & Natarajan, 2011) has helped boost the power of these telescopes to observe faint sources (e.g., Bradley et al., 2008), as in the Cluster Lensing And Supernova survey with Hubble (CLASH; Postman et al. 2012). Prior to October 2013 (including all of CLASH), the deepest WFC3/IR observations of any strong lensing cluster were 7 orbits (divided among the WFC3/IR filters). Still, these have complemented “blank” field programs such as the Ultra Deep Field (UDF; Illingworth et al. 2013; Ellis et al. 2013), the Cosmic Assembly Near-Infrared Deep Extragalactic Legacy Survey (CANDELS; Grogin et al. 2011; Koekemoer et al. 2011), the WFC3/IR Early Release Science (ERS) observations (Windhorst et al., 2011), and the HST pure-parallel programs BoRG (Trenti et al., 2012) and HIPPIES (Yan et al., 2011) in searching for the most distant galaxies yet known.
CLASH observations yielded a strongly lensed candidate observed 420 Myr after the Big Bang (Coe et al., 2013). A handful of candidates have been reported at – 10 from CLASH (Zheng et al., 2012; Bouwens et al., 2012a), the UDF (e.g., Ellis et al., 2013; Oesch et al., 2013a), and CANDELS (Oesch et al., 2013b). A more sizable sample of 100 candidates has been discovered at from CLASH (Bradley et al., 2013) and blank fields (e.g., Finkelstein et al., 2012; Schmidt et al., 2014; Bouwens et al., 2014). Ground-based observatories have contributed spectroscopic confirmations out to (Finkelstein et al., 2013) or 7.62 (Schenker et al., 2014) plus additional high-redshift candidates confirmed out to (Shibuya et al., 2012; Ono et al., 2012).
From these early times (), the average cosmic star formation rate density (SFRD) steadily increased to its peak at before declining to its modern day value as gas supplies dwindled (see Madau & Dickinson 2014 for a recent review). At earlier times (), a similarly steady evolution in SFRD may have been required to yield the galaxy stellar masses observed at and later (Behroozi & Silk, 2014). But some observations suggest a more rapid buildup at earlier times () than observed at . Bouwens et al. (2011a) and Oesch et al. (2012a, 2013a) report too few candidates at faint magnitudes (30 AB) in the UDF and surrounding fields. At brighter magnitudes (26–27 AB), Oesch et al. (2013b) find an excess of – 10 candidates in CANDELS observations of GOODS-N and GOODS-S, where no such “bright” candidates were expected (see also Bouwens et al. 2014).
Improved statistics on luminosity functions are forthcoming the Frontier Fields program. In October 2013, this program began obtaining deep Hubble and Spitzer imaging of six galaxy clusters and six blank fields in parallel. The Hubble images of the lensed fields are now our deepest views of the universe to date, probing nJy sources (intrinsic AB magnitudes 31). The WFC3/IR images (70 orbits) are 10 times deeper than any previous strong lensing cluster WFC3/IR imaging. Improved constraints on faint number counts (which rise steeply with magnitude at high redshifts; e.g., Bradley et al. 2012) will further constrain the ability of faint galaxies to reionize the early universe (e.g., Bouwens et al., 2012b). And where the Ultra Deep Field may, by chance, be overdense or underdense at a given redshift, the six Frontier Fields sightlines significantly reduce uncertainties due to cosmic variance (e.g., Trenti & Stiavelli, 2008; Bouwens et al., 2014).
To date, the Frontier Fields program has obtained half of the Hubble observations of four fields: the galaxy cluster Abell 2744, its blank parallel field, cluster MACSJ0416.1-2403, and its blank parallel field. Previous works presented high-redshift candidates lensed by Abell 2744, based on the deep infrared Hubble imaging and the first half of deep Spitzer imaging (Atek et al., 2013; Laporte et al., 2014; Zheng et al., 2014).
In this paper, we identify new high-redshift candidates in the field lensed by MACSJ0416.1-2403 and its blank parallel field. We also present, for the first time, predictions of lensed high-redshift number counts from the full Frontier Fields program based on public lensing models of the clusters submitted by multiple teams.
Below we briefly describe the Frontier Fields program (§2) and the gravitational lensing models submitted by the community (§3). We use these lens models along with extrapolated luminosity functions to predict high-redshift galaxy yields from the program (§4). Based on the Hubble Frontier Fields observations to date (§5), we identify high-redshift candidates (§6) and conclude by discussing our results (§7).
We assume a flat concordance CDM cosmology with , , and , where km s-1 Mpc-1.

| a | Depthb | Sens.c | |||
|---|---|---|---|---|---|
| Camera | Filter | (m) | Exposure | (AB) | (nJy) |
| HST ACS/WFC | F435W | 0.43 | 18 orbits | 28.8 | 2.2 |
| HST ACS/WFC | F606W | 0.59 | 10 orbits | 28.8 | 2.2 |
| HST ACS/WFC | F814W | 0.81 | 42 orbits | 29.1 | 1.7 |
| HST WFC3/IR | F105W | 1.06 | 24 orbits | 28.9 | 2.0 |
| HST WFC3/IR | F125W | 1.25 | 12 orbits | 28.6 | 2.6 |
| HST WFC3/IR | F140W | 1.39 | 10 orbits | 28.6 | 2.6 |
| HST WFC3/IR | F160W | 1.54 | 24 orbits | 28.7 | 2.4 |
| SST IRAC | ch1 | 3.6 | 50 hours | 26.6 | 16.6 |
| SST IRAC | ch2 | 4.5 | 50 hours | 26.0 | 28.9 |
2. Frontier Fields
The Frontier Fields111
http://www.stsci.edu/hst/campaigns/frontier-fields/
(PI Lotz) is a Hubble and Spitzer Space Telescope program
to obtain deep images of six strongly lensing clusters and six nearby “blank” fields
6′ from the cluster cores.
After deliberating over white papers submitted by the community,
the Hubble Deep Fields Initiative (HDFI) science working group unanimously recommended this program222
http://www.stsci.edu/hst/campaigns/frontier-fields/
HDFI_SWGReport2012.pdf
to the directors of the
Space Telescope Science Institute (STScI)
and the
Spitzer Science Center (SSC).
The directors approved observations of the first four pairs of clusters and blank fields
with approval for the final two pairs pending an early interim review.
The complete Hubble program would span three years (Cycles 21–23).
The six galaxy clusters to be observed are, in order, Abell 2744 (), MACSJ0416.1-2403 (), MACSJ0717.5+3745 (), MACSJ1149.5+2223 (), Abell S1063 (), and Abell 370 (). These clusters were discovered by Abell (1958), Abell et al. (1989), and the Massive Cluster Survey (MACS; Ebeling et al. 2007, Mann & Ebeling 2012).
Hubble is imaging each cluster and “blank” field for 140 orbits
with the Advanced Camera for Surveys (ACS) and the Wide Field Camera 3 (WFC3) IR channel
working in parallel with seven filters spanning 0.4–1.7m.
The 5 detection limit for point sources is roughly 29th magnitude AB in each filter (Table 1).
Spitzer is imaging each field for 100 hours total
with the Infrared Array Camera (IRAC)
in channels 1 and 2 spanning 3–5m.333
http://ssc.spitzer.caltech.edu/warmmission/scheduling/
approvedprograms/ddt/frontier/
The 50-hour 3.6m and 4.5m images are expected to reach AB mag 26.6 and 26.0, respectively (5 point source).
3. Gravitational Lensing Models
Based on further recommendations from the HDFI science working group, STScI commissioned five teams to produce gravitational lensing models for all six Frontier Fields clusters to be made available to the community. All teams shared the latest observational constraints, including positions and redshifts of galaxies strongly lensed to form multiple images, before working independently on the lensing models. Some teams also included weak lensing constraints in their modeling. For each cluster, the teams altogether submitted seven or eight models they deemed “best” as well as ranges of models yielding the uncertainties for each method. All of these models are available to the public along with tools to facilitate their use.444 http://archive.stsci.edu/prepds/frontier/lensmodels/
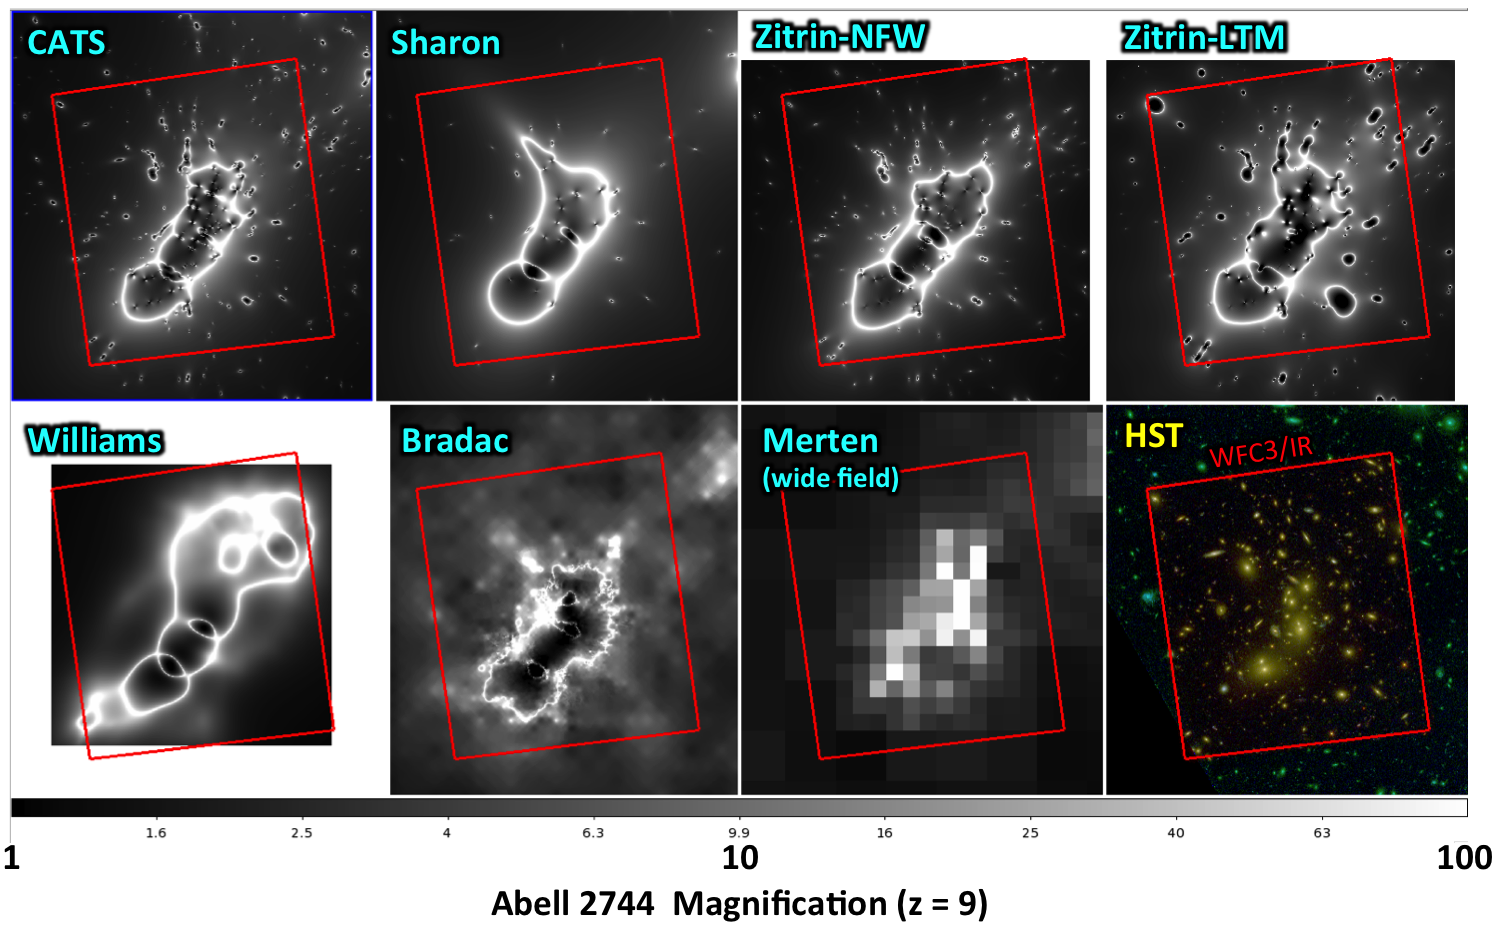
In Figure 2, we show high-redshift () magnification maps from the seven “best” models submitted for Abell 2744. The various methodologies are summarized online555 http://www.stsci.edu/hst/campaigns/frontier-fields/Lensing-Models and described in more detail in each team’s README files. Here we briefly describe the various models.
The “CATS” (Clusters As Telescopes) team (including Co-PIs J.-P. Kneib and P. Natarajan; Admin PI H. Ebeling; modelers J. Richard and M. Limousin) and the K. Sharon (PI) group including modeler T. Johnson both use Lenstool (Kneib et al., 1993; Jullo et al., 2007; Jauzac et al., 2012). They model each cluster’s mass as one or more large halos plus smaller subhalos at the positions of cluster galaxies identified in the images. Each halo and subhalo is modeled as a pseudo-isothermal elliptical mass distribution (PIEMD; Kassiola & Kovner 1993). In this work we use the “version 2” models from the Sharon group and version 1 from all others.
A. Zitrin (Co-PI with J. Merten) independently implemented a similar parameterization for the “Zitrin-NFW” models with PIEMDs for the galaxy halos and elliptical NFW (Navarro et al., 1996) mass distributions for the cluster halos (as in Zitrin et al. 2013). He also submitted “LTM” models (Broadhurst et al., 2005; Zitrin et al., 2009) in which light traces mass more completely: in addition to cluster galaxies tracing the positions of subhalos, the cluster halo is modeled as a smoothed version of the cluster galaxy light. For these models, A. Zitrin used two smoothing kernels: polynomial splines (“Zitrin-LTM”) and Gaussians (“Zitrin-LTM-Gauss”). For each cluster, he submitted models based on two or three of these methods (NFW, LTM, and LTM-Gauss).666 Zitrin-LTM is available for all six clusters. Zitrin-LTM-Gauss is available for all but Abell 2744, and Zitrin-NFW for all but MACSJ0717.5+3745 and MACSJ1149.5+2223.
Others submitted models which made no assumptions about light tracing mass, forgoing that useful prior in favor of a broader range of allowed solutions. The M. Bradac (PI) team including A. Hoag used the method from Bradač et al. (2005, 2009). The L. Williams (PI) team used Grale (Liesenborgs et al., 2006, 2007). J. Merten (Co-PI with A. Zitrin) used SaWLens (Merten et al., 2009, 2011) to produce lower resolution models of wider areas extending out to include the parallel “blank” fields based on observed weak lensing.
3.1. Lens Model Products
Pre-computed magnification maps are available online at four redshifts () along with maps of the mass surface density and weak lensing shear , from which we derive magnification maps at other redshifts using the scripts provided online. Magnifications are calculated as after and have been scaled to the desired redshift. Both and are proportional to , a ratio of angular-diameter distances from lens to source and observer to source . For a flat universe (), angular-diameter distances are calculated as follows (Fukugita et al. 1992, filled beam approximation; see also Hogg 1999 and online calculators such as iCosmos777http://www.icosmos.co.uk):
| (1) | |||||
| (2) |
where (again for a flat universe) the Hubble parameter varies with redshift as .
All lens modelers who assumed light traces mass to some degree (CATS, Sharon, Zitrin) also submitted models of the lensing deflection fields . These enable us to study the delensed source plane as predicted by each model. The deflections are also proportional to ; the online maps must be scaled by this factor.


| Optimistica | Pessimistica | |||||||
|---|---|---|---|---|---|---|---|---|
| Redshiftb | Field | Lensed | Total | Field | Lensed | Total | ||
| c | 62 | 61 | 123 | 62 | 61 | 123 | ||
| 29 | 33 | 52 | 9 | 15 | 24 | |||
| 14 | 19 | 33 | 0.6 | 3 | 4 | |||
| 3 | 7 | 10 | 0 | 0.4 | 0 | |||
| 0 | 1 | 1 | 0 | 0 | 0 | |||
| 29 | 42 | 71 | 3.5 | 9 | 13 | |||


4. High Redshift Predictions
In this section, we predict high-redshift number counts in the lensed and “blank” Frontier Fields. For , we present ranges of predictions, as there are few observational constraints to date. To predict lensed number counts, we convolved the field luminosity functions with magnification histograms from lens models submitted by the community (§3).
The numbers we quote are upper limits, as we do not address incompleteness here. Foreground objects, including galaxies in the clusters and intracluster light, will render a significant fraction of faint objects undetectable. Incompleteness and contamination must both be quantified as a function of redshift and magnitude typically by inserting simulated galaxies into the images and repeating one’s analysis (searching for high-redshift candidates).
4.1. Field Luminosity Functions
The UV luminosity function (LF) of star forming Lyman Break Galaxies (LBGs) in the field has been fairly well constrained out to where 100 candidates have been discovered (Bouwens et al., 2011b; Oesch et al., 2012b; Yan et al., 2012; Bradley et al., 2012; Dunlop et al., 2013; McLure et al., 2013; Schenker et al., 2013; Schmidt et al., 2014; Bouwens et al., 2014). Estimating expected counts at and greater requires extrapolation from lower redshifts tempered with the handful of candidates discovered to date.
We adopted the best fit LF from Bradley et al. (2012). They found the observed number counts as a function of luminosity were well fit by a Schechter (1976) function with normalization Mpc-3, characteristic rest-frame UV absolute magnitude AB, and faint end slope . Other recent studies (McLure et al., 2013; Schenker et al., 2013; Schmidt et al., 2014; Bouwens et al., 2014) found similar results including similarly steep faint end slopes (, , , and , respectively) which help boost numbers of lensed faint galaxies (§4.2). We explicitly tested the Schmidt et al. (2014) LF and found it gives very similar expected number counts as those presented in §4.4.
For , we evolved the Bradley et al. (2012) LF by assuming and remain constant. Bouwens et al. (2006) and most subsequent works found such evolution to fit observed number counts well. We adopted and as our fiducial “optimistic” and “pessimistic” cases, respectively. The former is roughly consistent with the evolution observed at lower redshifts (), while the latter is consistent with the low numbers of candidates discovered to date (Oesch et al. 2012a, 2013a; as discussed in Coe et al. 2013). However we acknowledge that the UV luminosity function evolution may be more accurately described by evolution in the other parameters ( and ) or all three as found more recently by Oesch et al. (2013b) and Bouwens et al. (2014).
We also considered the Bouwens et al. (2012b) and Bouwens et al. (2014) evolving LFs derived from observations in which all three parameters evolve with redshift. These yield even more galaxies than the “optimistic” LF evolution we adopted above, especially for lensed galaxies as the faint end slope continues to steepen to . Bouwens et al. show that extrapolating these relations to higher redshifts significantly overestimates the numbers of faint and galaxies observed in the field. We adopted a fixed faint end slope so as not to exacerbate the disagreements with these results. The Frontier Fields observations are required to better constrain faint number counts within our predicted ranges and perhaps to constrain the minimum luminosity of high-redshift galaxies (Mashian & Loeb, 2013).
4.2. Lensed Luminosity Functions
We estimated lensed number counts by convolving the above luminosity functions with lens model magnification maps submitted by the community (§3). We performed this calculation in two ways, yielding expected numbers of lensed images and unique sources.
For the first method (yielding lensed images), for every pixel within the WFC3/IR FOV (4.65 arcmin2), we brightened the luminosity function by the magnification and divided by the magnification to account for the reduced area. We then summed over all pixels each with lensed area in the image to yield lensed number counts (“arcs”) as a function of observed luminosity:
| (3) |
Galaxies which are lensed to form multiple images are counted multiple times. Thus observed catalogs can be compared directly to these predictions.
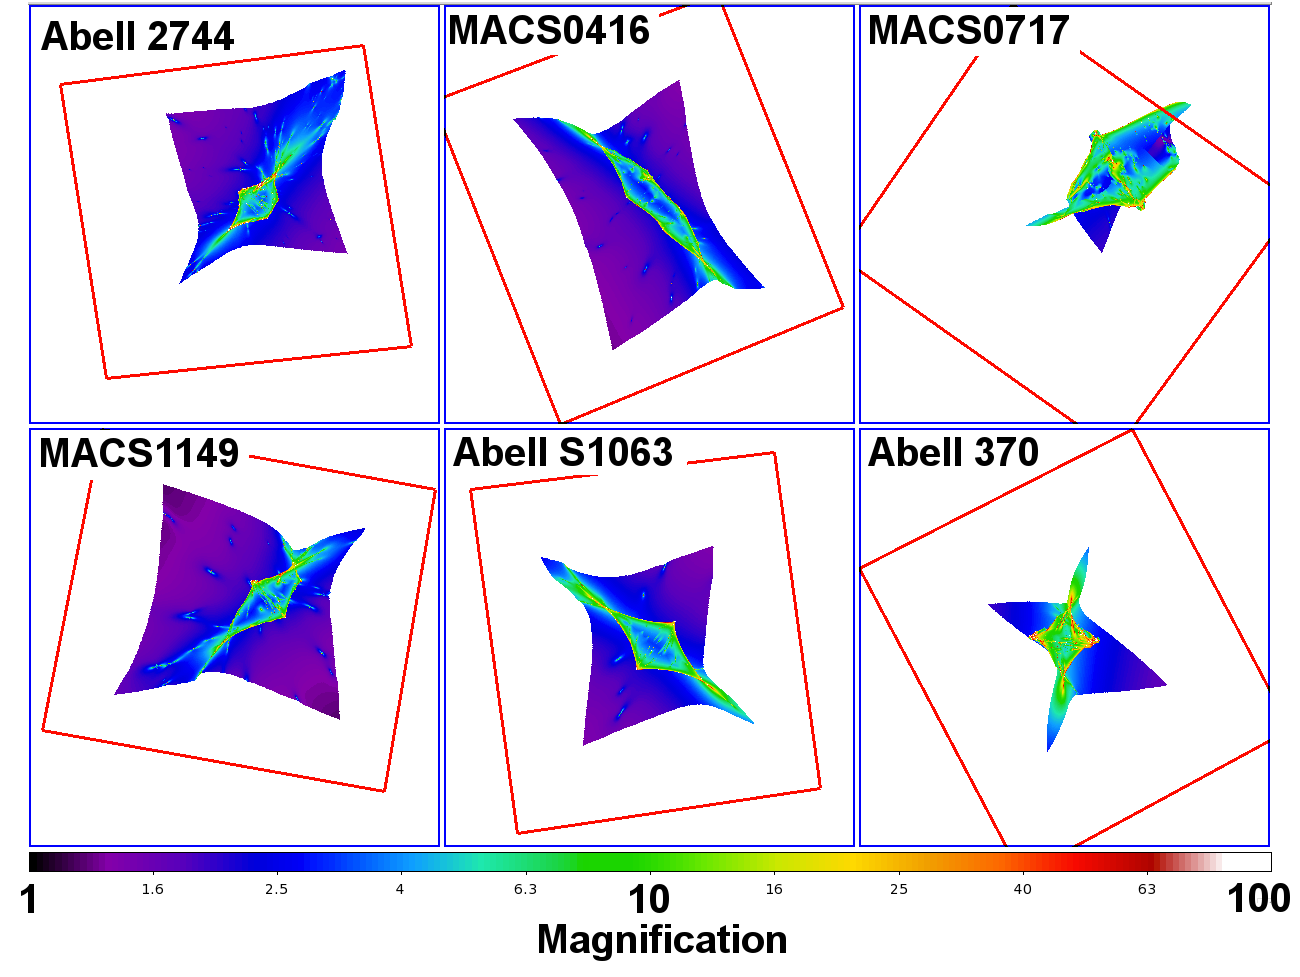
Our second estimation method yields numbers of unique source galaxies. For those modelers who provided deflection maps (CATS, Sharon, Zitrin), we delensed the magnification map back to the source plane sampled at higher resolution (with pixels of area ) at the desired redshift.888 We began by rebinning the deflection field to derive values at the pixel corners (rather than their centers). We then divided each magnification map pixel into two triangles, both assuming the magnification value in the square pixel. We delensed the vertices of each triangle using our rebinned deflection field. Our use of triangles ensures unique delensed regions in the source plane. Squares could get twisted upon delensing. Alternatively, we could have skipped the initial rebinning and simply measured each triangle’s magnification as the ratio of its lensed and delensed areas. This yields nearly identical results. We identified all overlapping delensed areas and retained the highest magnifications at those pixels. This corresponds to retaining only the brightest of each multiply-imaged galaxy. Figure 3 shows our result for the delensed CATS magnification maps as an illustrative example.
We then summed over all source pixels , brightening the luminosity function by the magnifications (but not reducing the areas since we are already working in the delensed source plane) to yield lensed number counts of unique background galaxies:
| (4) |
4.3. Source Plane Search Volumes
Based on the delensed magnification maps from CATS, Sharon, and Zitrin, we can estimate the total source plane search areas as a function of magnification. These search areas correspond to search volumes within, say, of a given redshift as plotted for reference in Figure 4 (e.g., Hogg, 1999). In Figure 5, we plot the cumulative search area (and volume) as a function of magnification for all six clusters according to the CATS and Zitrin-LTM models. (T. Johnson et al., 2014, in preparation, present a corresponding plot for the Sharon models.) We also show the strong general agreement between the total lensed areas according to CATS, Sharon, and Zitrin-LTM. Based on these models, the full survey should yield 5 arcmin2 (9,000 Mpc3 at ) of source plane search area in the 6 lensed WFC3/IR fields. About 10% of that should be magnified by a factor of 6 (2 magnitudes) or greater. The blank parallel fields will yield about 5–6 times the search area of the lensed fields (28 arcmin2, or 50,000 Mpc3 at ). We stress these are upper limits as we have not accounted for search area lost due to foreground objects.
4.4. Predicted Number Counts
Figure 6 shows our “optimistic” LF (the Bradley et al. 2012 LF with fainter by 0.36 mag) lensed by every submitted lens model, yielding estimated numbers of lensed images as a function of observed magnitude. (For this plot, we count galaxies in the image plane allowing multiple images of galaxies to count multiple times.)
The variety of lens models yield broadly consistent predictions for lensed luminosity functions, especially at fainter observed magnitudes (). Some consistency is guaranteed by the faint end slope . This slope means that faint number counts are roughly inversely proportional to luminosity squared (). Thus for a given observed brightness, a magnification decreases the search area by but compensates by brightening fainter () galaxies which are more numerous by (Broadhurst et al., 1995).
For our remaining calculations, we considered source galaxy counts, discarding the fainter multiple images of any galaxy as described in the previous subsections. Figure 7 shows our optimistic LF magnified by the delensed CATS, Sharon, and Zitrin-LTM models for each cluster.
We next considered the full survey and both the “optimistic” () and “pessimistic” () scenarios discussed in §4.1. We plot cumulative expectations as a function of magnitude in Figure 8. We then plot the cumulative numbers for F160W 28.7 AB as a function of redshift in the left panel of Figure 9. Integrating one more time, we plot total expected cumulative counts for F160W 28.7 AB as a function of redshift in the right panel of Figure 9.
We also tabulate some of these results in Table 2. In the optimistic case, we expect totals of 40 lensed galaxies and 30 field galaxies. In the pessimistic case, we may only find 9 lensed and 3.5 field galaxies at . Roughly, we can expect either six or one candidate(s) in each of the 12 Frontier Fields (lensed or blank) depending on how smoothly (“optimistic”) or dramatically (“pessimistic”) the LF declines at . Again, we emphasize incompleteness may significantly reduce these numbers.
In Figure 10, we highlight the fact that the lensed Frontier Fields are the deepest images ever obtained. The UDF still has the greatest exposure time of any HST image, including 253 orbits WFC3/IR, 84 of which were obtained in F160W yielding a 5 point source detection limit of 29.45 AB mag (Koekemoer et al., 2013). The FF 24-orbit F160W images have 5 depths of 28.7 AB mag (0.75 mag fainter), but a significant fraction (about half) of the source area will be lensed by factors of 2 (0.75 mag) or greater (Figure 5). Figure 10 shows that significant numbers of galaxies intrinsically fainter than the UDF detection limit should be detected out to with perhaps a few detected out to or 11 or so.
In fact, significant numbers of the detected galaxies will be magnified by factors up to 10 (2.5 mag) or more. In Figure 11, we plot (top left panel) the magnification likelihoods for galaxies as a function of observed magnitude as lensed by the Abell 2744 CATS model. In the remaining panels, we plot the magnification likelihood distributions for all clusters according to multiple models for a galaxy observed (lensed to) F160W = 28 AB mag. Extreme magnifications () are expected to be far less frequent. In a way this is fortunate as such high magnification estimates for individual galaxies also have large uncertainties (e.g., Bradač et al., 2009).
| R.A. | Decl. | ACS | WFC3/IR | Spitzer | |||
|---|---|---|---|---|---|---|---|
| Cluster | Field | Namea | (J2000) | (J2000) | (orbits) | (orbits) | (hours) |
| Abell 2744b | cluster | FFC1 | 00:14:21.20 | -30:23:50.1 | 16c | 71d | 100 |
| Abell 2744b | parallel | FFB1 | 00:13:53.27 | -30:22:47.8 | 87e | 0 | 100 |
| MACSJ0416.1-2403f | cluster | FFC2 | 04:16:08.90 | -24:04:28.7 | 84g | 7d,g | 100 |
| MACSJ0416.1-2403f | parallel | FFB2 | 04:16:33.40 | -24:06:49.1 | 0 | 80 | 100 |
5. Observations and Analysis
We present high redshift candidates lensed by the first two Frontier Fields clusters and in the first “blank” parallel field to be observed with WFC3/IR. No Frontier Field has yet to be observed deeply (70 orbits) with both ACS and WFC3/IR, but deep WFC3/IR imaging is available for Abell 2744 and the MACSJ0416.1-2403 parallel field (as summarized in Table 3). Deep Spitzer observations (100 hours) have also been obtained for the first two clusters and parallel fields.
The deep WFC3/IR and Spitzer imaging of Abell 2744 has been studied previously (Atek et al., 2013; Laporte et al., 2014; Zheng et al., 2014). And Bradley et al. (2013) presented brighter high-redshift candidates lensed by MACSJ0416.1-2403 based on shallower 20-orbit, 16-band HST imaging from CLASH.
5.1. HST Images
We analyzed the version 1.0 HST image mosaics produced by STScI and available via the Mikulski Archive for Space Telescopes (MAST).999 http://archive.stsci.edu/prepds/frontier/ Associated README files describe in detail the observations and image processing, which we summarize here. The image mosaics incorporate all images obtained to date in the Frontier Fields filters from multiple programs (see Table 3).
The STScI pipeline corrected all images for bias, dark current, and flat fields with up-to-date reference files. Satellite trails were manually identified and masked. WFC3/IR image processing included up-the-ramp cosmic ray rejection and manual masking of persistence and bad pixels. The WFC3/IR images were also corrected for time-variable sky emission, most significantly due to Helium line emission at 1.083m affecting F105W observations (Brammer et al., 2014). This effect has been observed and addressed previously in CLASH (Coe et al., 2013) and in the Ultra Deep Field (Koekemoer et al., 2013). ACS images were corrected for CTE (charge transfer efficiency) and bias striping. Separate “self-calibrated” ACS images were also produced but not analyzed here.
The calibrated images were all aligned to a common 0.06″ pixel grid using procedures from Astrodrizzle (Gonzaga & et al., 2012) and as outlined in Koekemoer et al. (2002, 2011). Cosmic rays were identified in the multiple ACS exposures and rejected. Inverse variance maps (IVMs) were produced quantifying the uncertainty in each pixel before accounting for correlated pixel noise (an additional 10-15%) and Poisson source noise. These IVMs were used as weights to drizzle-combine the images obtained in each filter. The final seven filter image mosaics are aligned with one another to precisions of 0.002–0.005″ RMS.
5.2. Photometric Redshifts
Based on the STScI version 1.0 seven-filter HST image mosaics and IVMs of each field, we measured photometry and photometric redshifts in a manner similar to our analyses of CLASH images (e.g., Coe et al., 2013; Jouvel et al., 2014). We created a weighted sum of all four HST WFC3/IR images to be used as our detection image for each field. And we took the inverse square root of each inverse variance map to create an RMS map for each filter.
We ran SExtractor (Bertin & Arnouts, 1996) version 2.8.6 in dual-image mode to detect objects in each field and define their isophotal apertures for photometry to be measured in each filter image. For object detection, we required 9 contiguous pixels in the detection image above the RMS measured after background subtraction in grids of pixels. We set the deblending of adjacent objects to 64 levels of 0.0001 minimum contrast. For photometry, we used a 24-pixel-wide rectangular annulus around each object to estimate and subtract the local background.
We estimated Bayesian photometric redshifts using BPZ (Benítez, 2000; Coe et al., 2006), one of the top performing methods in controlled tests (Hildebrandt et al., 2010). We used updated spectral models and priors (Benítez et al. in prep.) as described in Coe et al. (2013). Briefly, the model spectral energy distributions (SEDs) are originally from PEGASE (Fioc & Rocca-Volmerange, 1997) but recalibrated based on observed photometry and spectroscopic redshifts from FIREWORKS (Wuyts et al., 2008). The templates were selected to encompass ranges of metallicities, extinctions, and star formation histories observed for the vast majority of real galaxies.
BPZ fits our observed photometry to these redshifted models and then tempers the redshift likelihood with a Bayesian prior on each galaxy redshift and type given its observed magnitude. The updated prior is based on galaxy samples observed in COSMOS (Ilbert et al., 2009), GOODS-MUSIC (Grazian et al., 2006; Santini et al., 2009), and the UDF (Coe et al., 2006).
This prior may be conservative in that it assumes high-redshift () galaxies are less likely than their primary interlopers (red galaxies). Bouwens et al. (2012a) argued that at these faint magnitudes, red galaxies are actually less common (Giallongo et al., 2005) than high redshift galaxies (Bouwens et al., 2011b). Our conservative prior may be more appropriate at given the declines in number counts suggested by field searches (most recently Bouwens et al. 2014). For our high-redshift searches, we consider both the conservative prior as well as a flat prior which assumes all redshifts are equally likely (the “maximum likelihood” results output by BPZ).
| F606Wc | F814Wc | F105Wc | F125Wc | F140Wc | F160Wc | ||||
|---|---|---|---|---|---|---|---|---|---|
| IDa | b | d | (nJy) | (nJy) | (nJy) | (nJy) | (nJy) | (nJy) | magnif.d |
| FFC1-2493-2561h | 0.95 | ||||||||
| FFC1-2306-3090fh | 1.00 | ||||||||
| FFC1-2136-2432h | 0.98 | ||||||||
| FFC1-2508-2497fgh | 0.99 | ||||||||
| FFC1-2481-2561h | 0.99 | ||||||||
| FFC1-2555-2516fh | 0.83 | ||||||||
| FFC1-2355-2566h | 0.58 |
| R.A. | Decl. | F105Wc | F125Wc | F140Wc | F160Wc | |||
|---|---|---|---|---|---|---|---|---|
| IDa | (J2000) | (J2000) | b | d | (nJy) | (nJy) | (nJy) | (nJy) |
| FFB2-3642-6304 | 04:16:36.42 | -24:06:30.4 | 0.85 | |||||
| FFB2-3597-6481 | 04:16:35.97 | -24:06:48.1 | 0.79 | |||||
| FFB2-3043-6011 | 04:16:30.43 | -24:06:01.1 | 0.73 | |||||
| FFB2-3157-5248 | 04:16:31.57 | -24:05:24.8 | 0.44 | |||||
| FFB2-3045-6002 | 04:16:30.45 | -24:06:00.2 | 0.85 |
| F606Wd | F814Wd | F105Wd | F125Wd | F140Wd | F160Wd | ||||
|---|---|---|---|---|---|---|---|---|---|
| IDa | b | c | (nJy) | (nJy) | (nJy) | (nJy) | (nJy) | (nJy) | magnif.e |
| FFC2-1153-4532f | 0.38 | ||||||||
| FFC2-1151-4540 | 1.00 | ||||||||
| FFC2-1148-4581 | 0.95 | ||||||||
| FFC2-0744-5264 | 0.63 | ||||||||
| FFC2-0960-3426g | 0.84 | ||||||||
| FFC2-0500-3510g | 0.80 | ||||||||
| FFC2-1148-3435g | 0.99 | ||||||||
| FFC2-0900-3404 | 0.94 | ||||||||
| FFC2-1221-3595 | 0.98 | ||||||||
| FFC2-0829-5229 | 0.68 | ||||||||
| FFC2-0972-5201 | 0.91 | ||||||||
| FFC2-1321-4063 | 1.00 | ||||||||
| FFC2-0640-3143 | 1.00 |
6. High Redshift Candidates
6.1. Lensed by Abell 2744
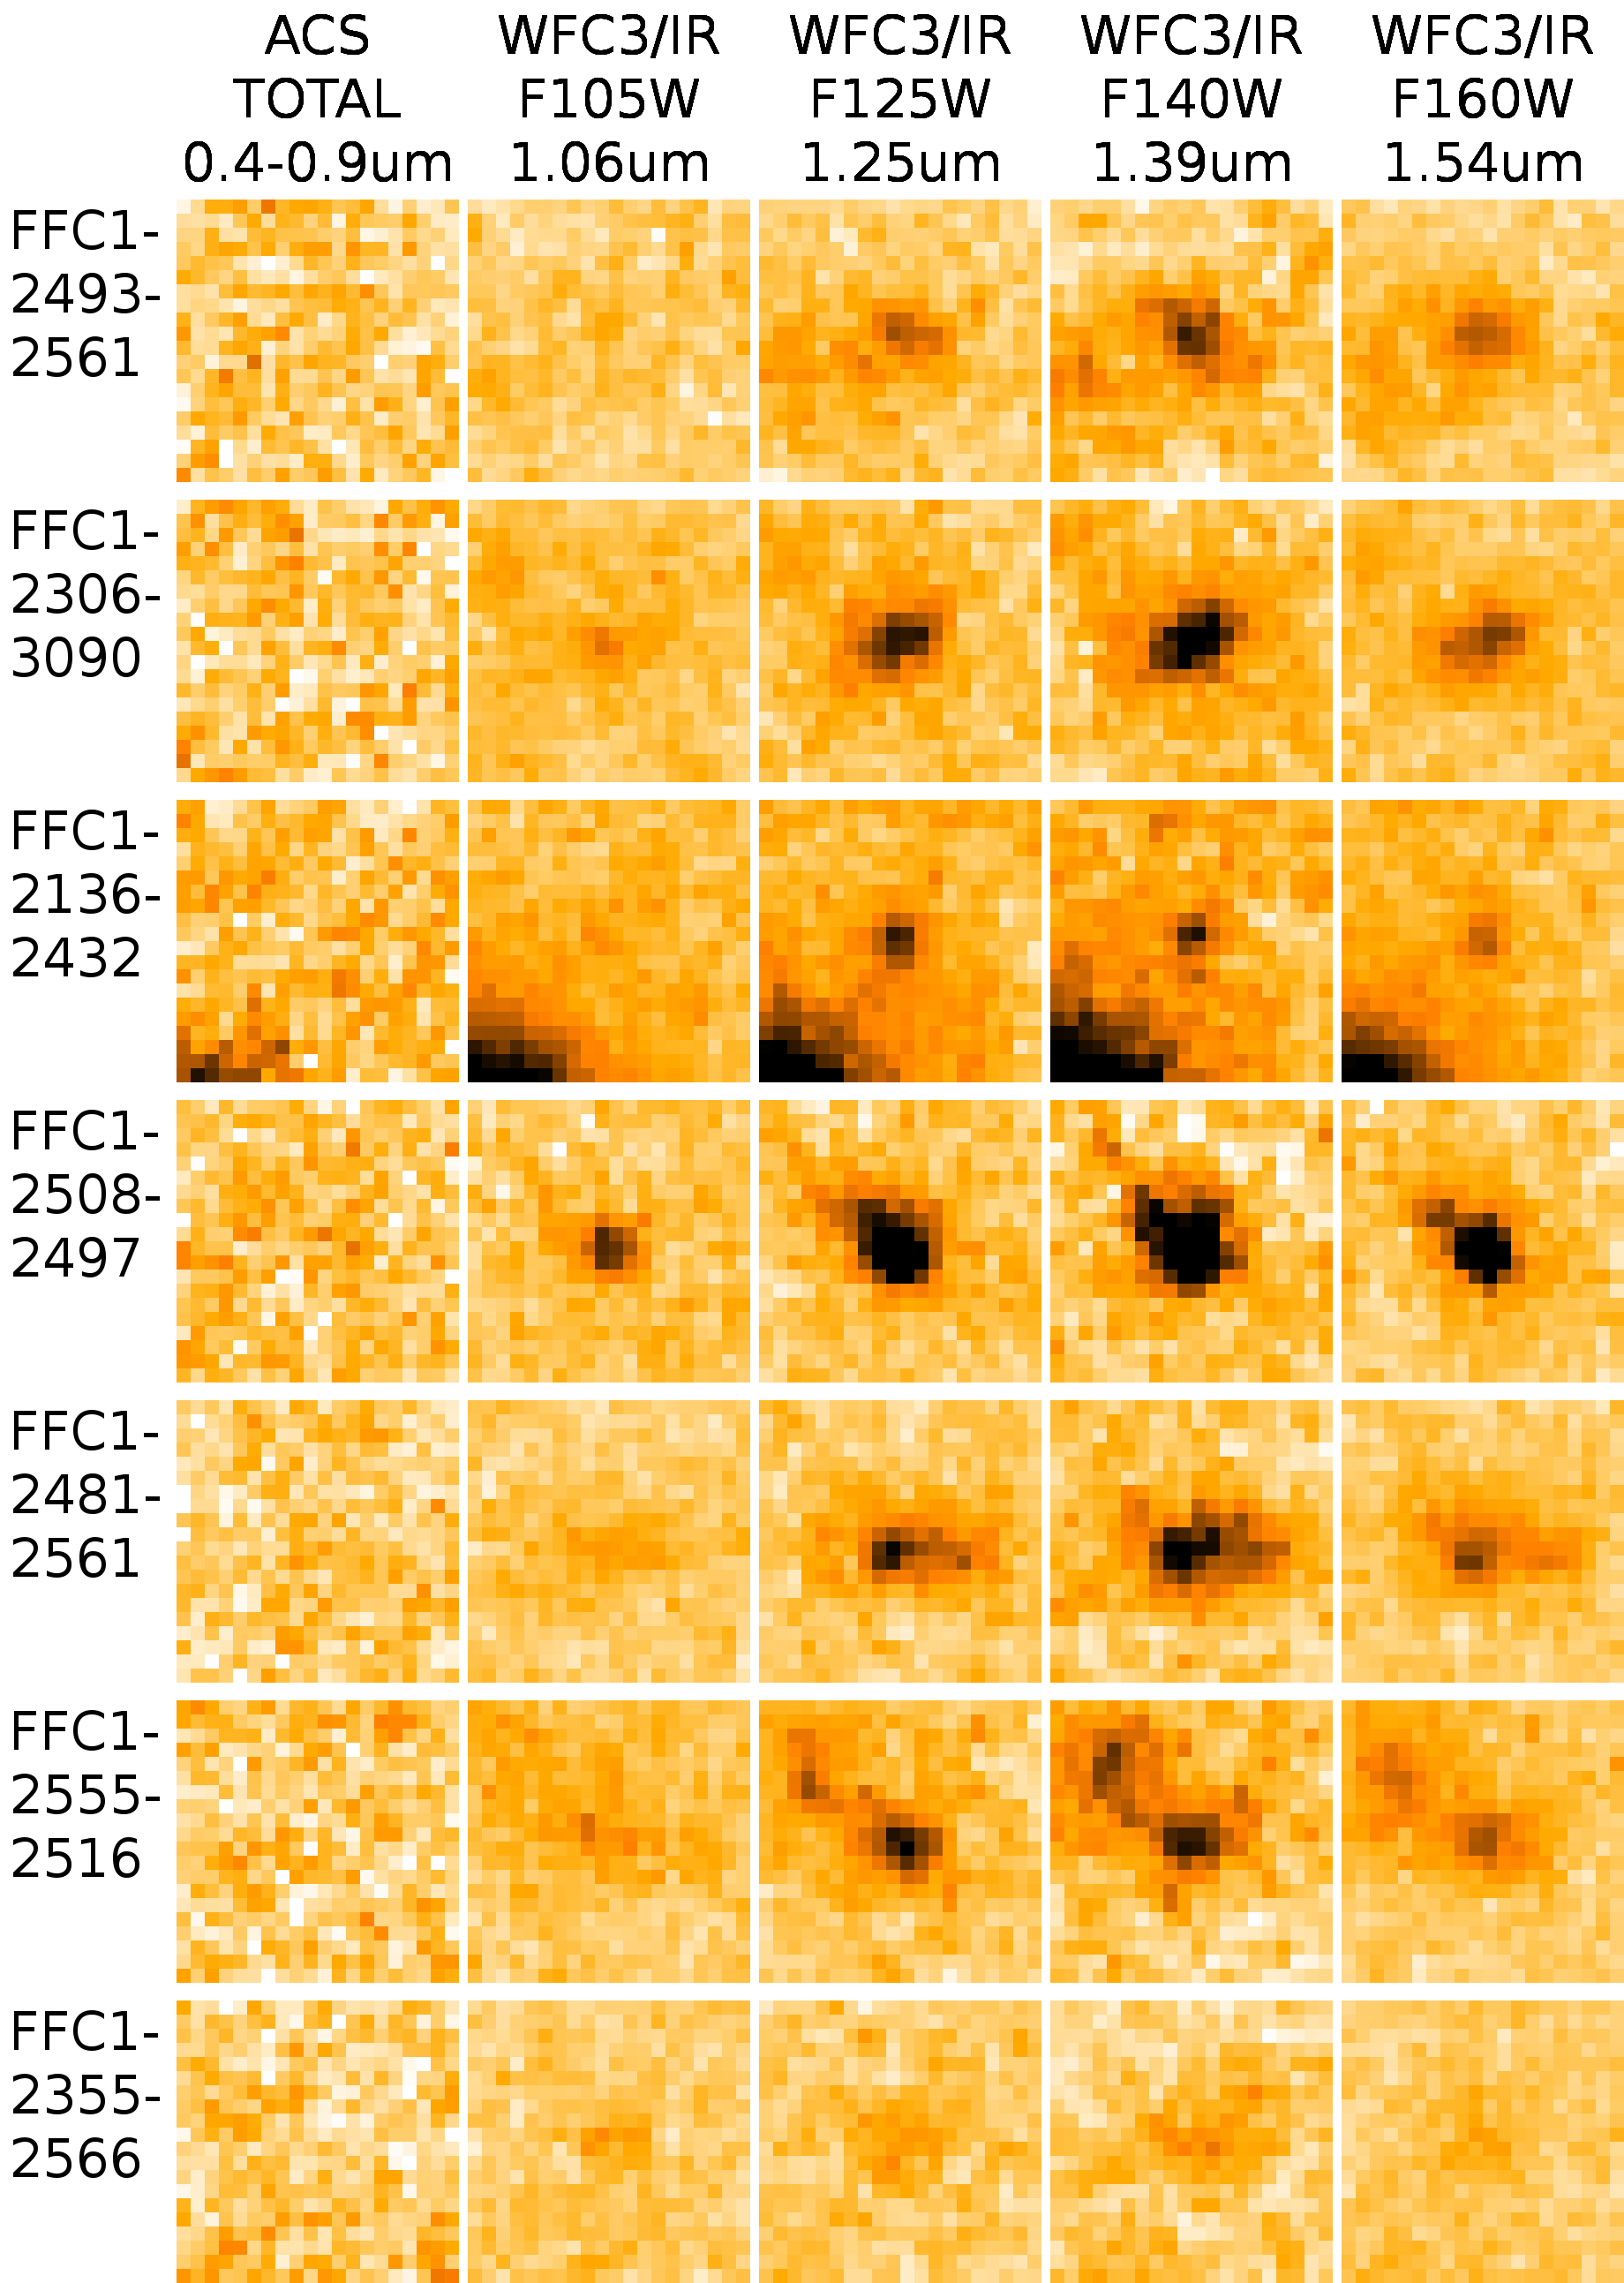
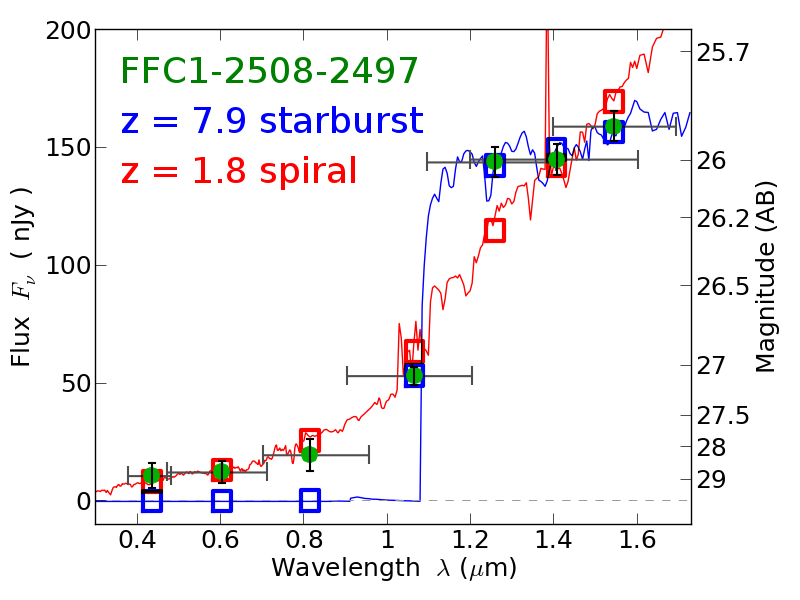
In Table 4, we present our most likely candidates lensed by Abell 2744 as observed in the deep WFC3/IR imaging and shallow archival ACS imaging (Figure 12). Atek et al. (2013) previously noted three of these seven candidates, and Laporte et al. (2014) further analyzed the brightest candidate FFC1-2508-2497. Zheng et al. (2014) reported all of these candidates plus others not included here due to our more conservative priors. The upcoming deep ACS imaging should help discriminate between the and solutions for these objects.
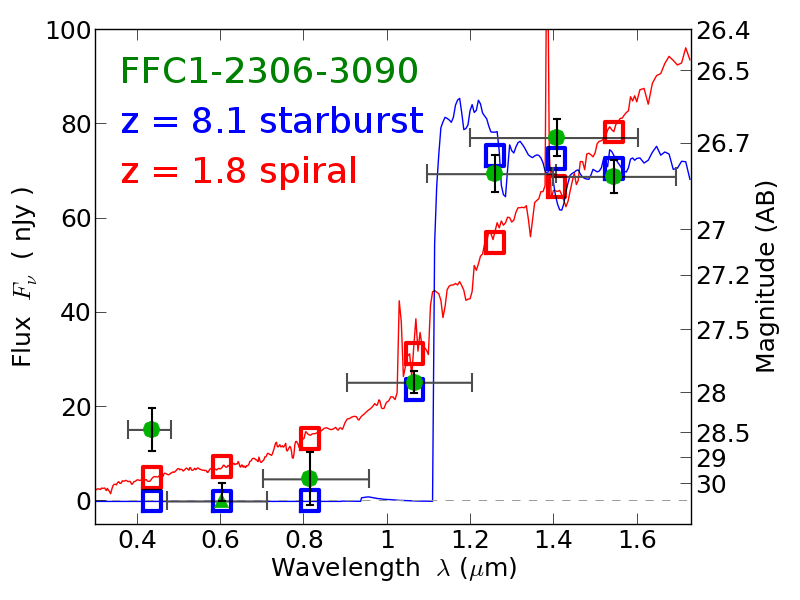
We provide the estimated likelihood that each object is at high redshift () versus low redshift based on the Bayesian analysis including the conservative prior. Here we only include candidates more likely to be high redshift than not, discarding a number of candidates with conservative . In Figure 13, we plot example SEDs of two of the more confident candidates, including FFC1-2508-2497.
Intriguingly, all of our candidates are located in one corner of the image. As noted by Zheng et al. (2014), this could be the densest concentration of candidates yet observed. Trenti et al. (2012) discovered five candidates within a diameter of 140″ (6 comoving Mpc) in one BoRG field. Zheng et al. (2014) find nine candidates within a 20″ search diameter. We find at least four of these to be robust (conservatively) and that all seven of our candidates fit within 110″.
According to the submitted lens models, magnifications in this region are relatively low, around a factor of 2. In Table 4, we provide magnification estimates and uncertainties based on the ranges of models submitted by each team (altogether 1,000 models per cluster). We weight each modeler (CATS, Sharon, Zitrin, Williams, Bradac, Merten) equally regardless of the number of models submitted.
We first provide the median and 68% confidence range for the methods which make use of the prior that light traces mass (CATS, Sharon, Zitrin). We then quote the range allowed when including also the more flexible models which make no assumptions about light tracing mass (Williams, Bradac, Merten). For example, FFC1-2508-2497 is likely magnified by a factor of 1.6, or 1.4 – 2.2 with 68% confidence, according to the light-traces-mass methods. This range expands to 1.2 – 3.2 when considering all methods. For some other objects, the 68% confidence range shrinks when all models are included.
6.2. MACSJ0416.1-2403 parallel blank field
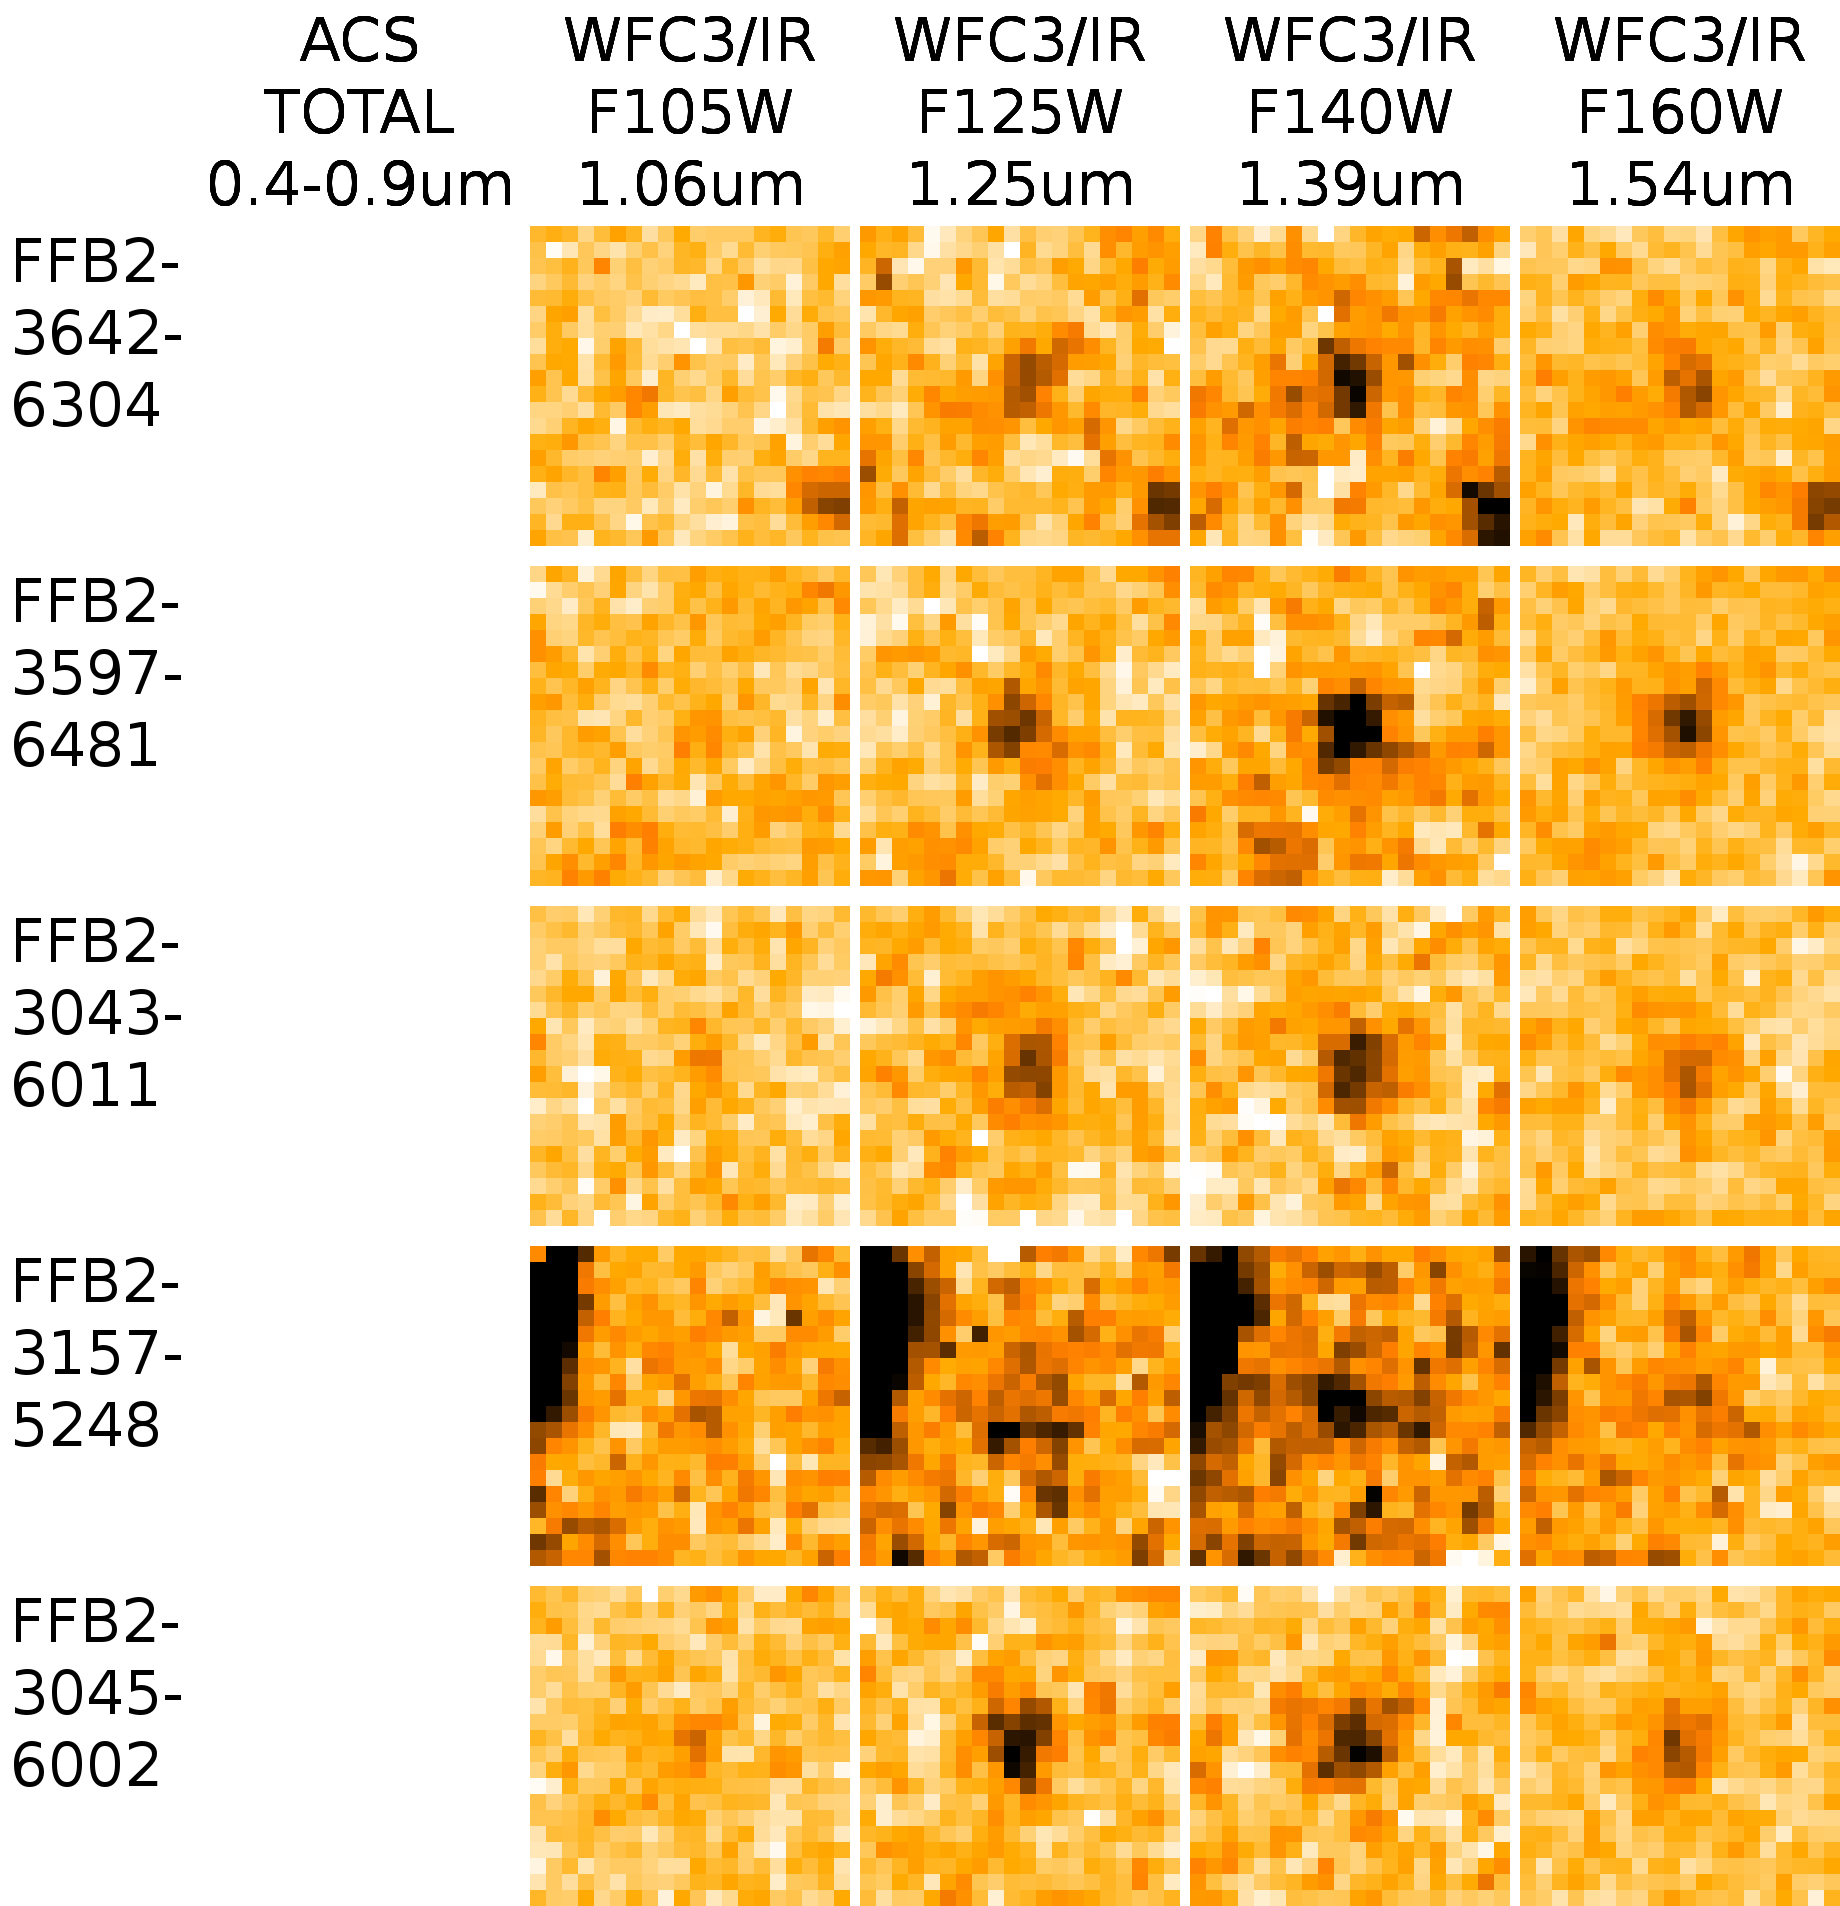
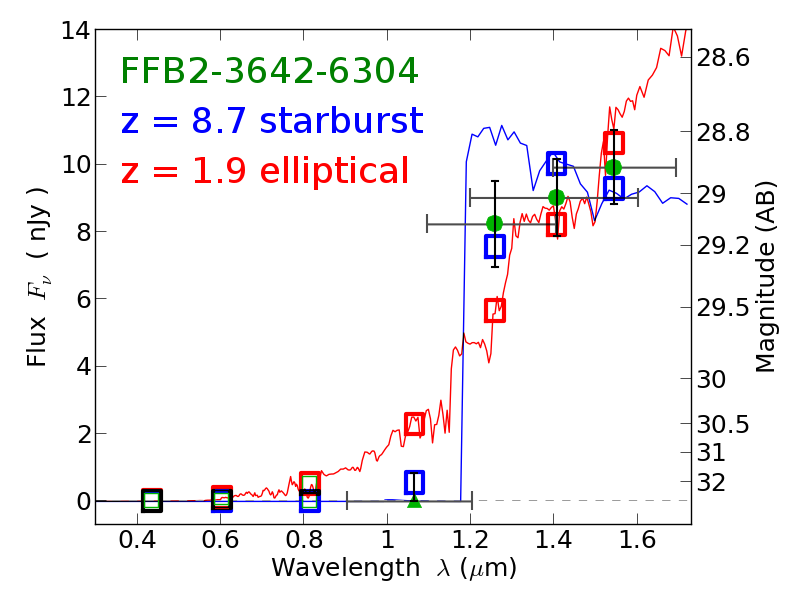
In Table 5, we report for the first time high-redshift () candidates in the deep WFC3/IR imaging of FFB2, the blank field observed in parallel with MACSJ0416.1-2403. Though no ACS imaging is available, galaxies drop out significantly from F105W (Figure 1), so we may already begin to search for candidates at these high redshifts. We find higher redshift candidates in this field, out to . We show WFC3/IR image stamps in Figure 14 and an example SED in Figure 15. All of these candidates allow for lower redshift () solutions within their 95% confidence limits again using our conservative prior.
6.3. Lensed by MACSJ0416.1-2403
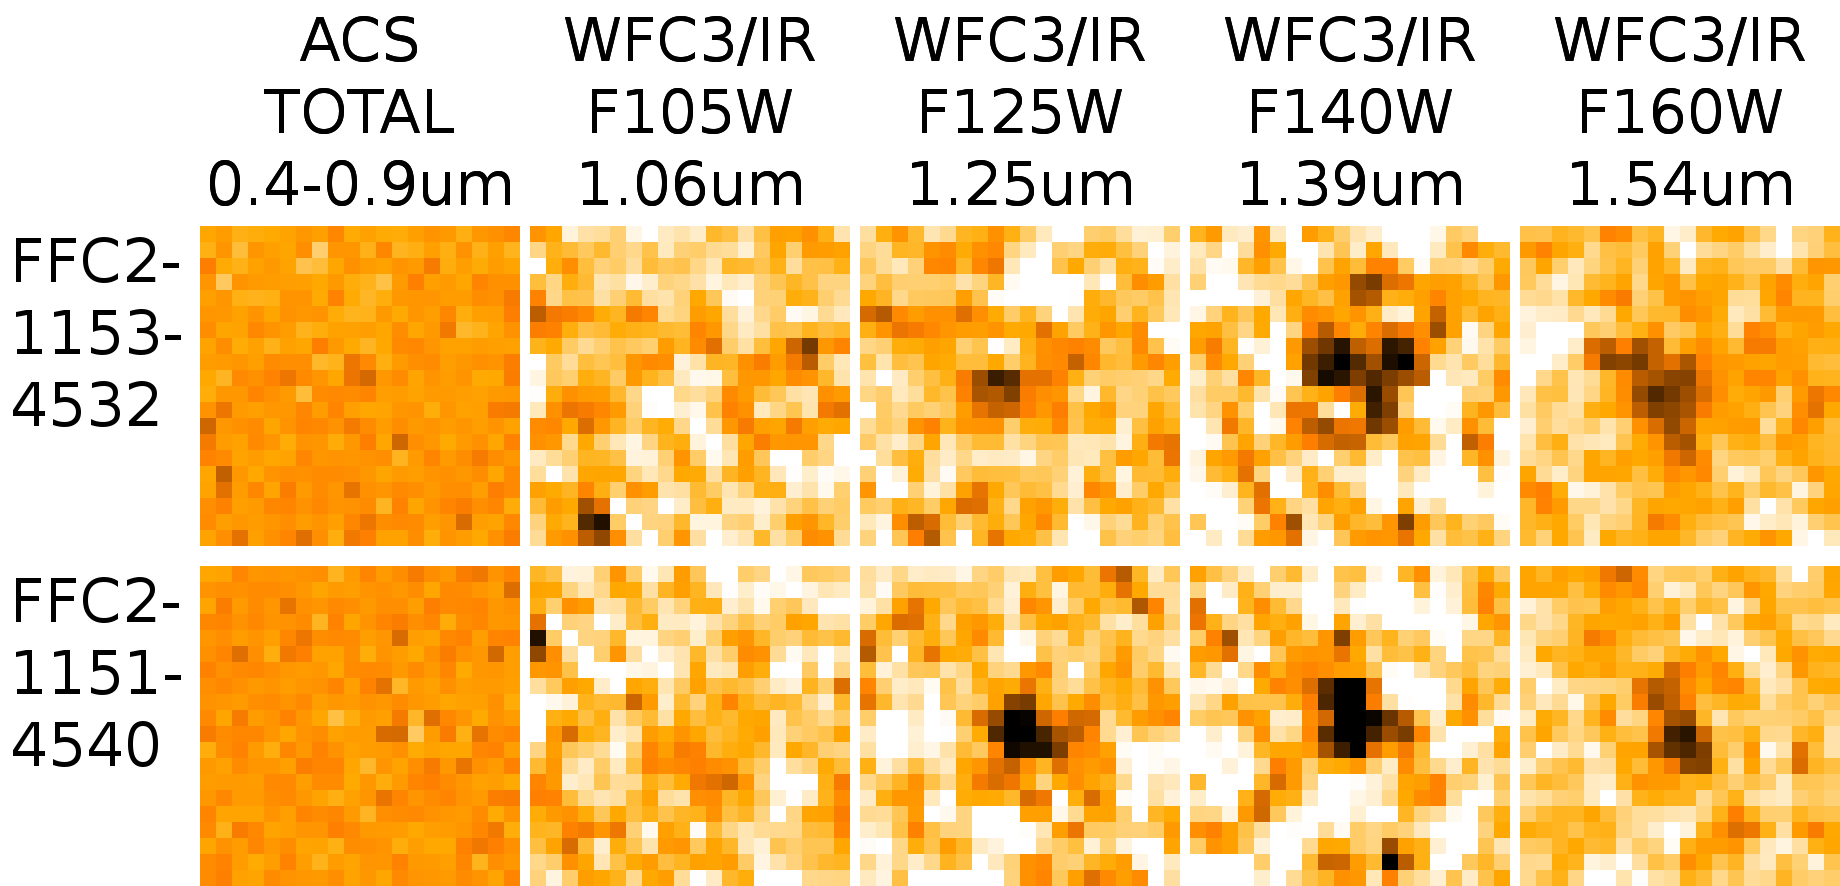
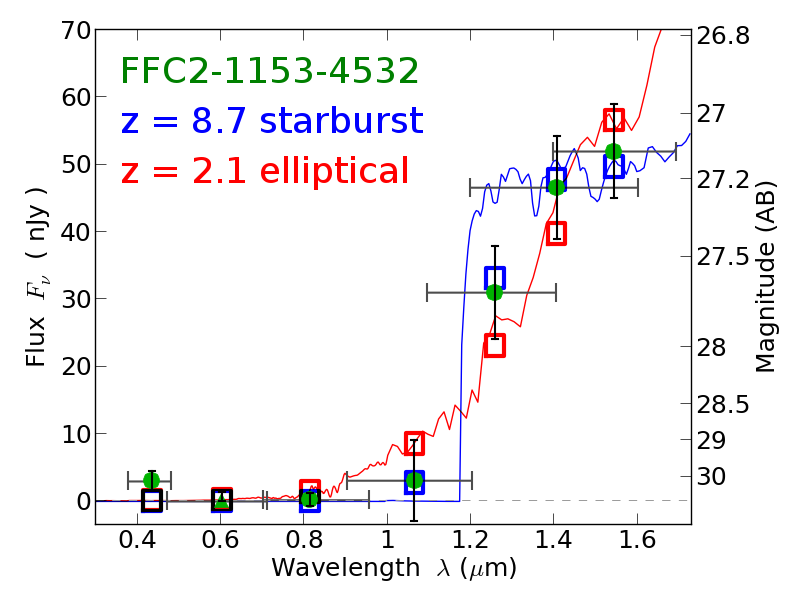
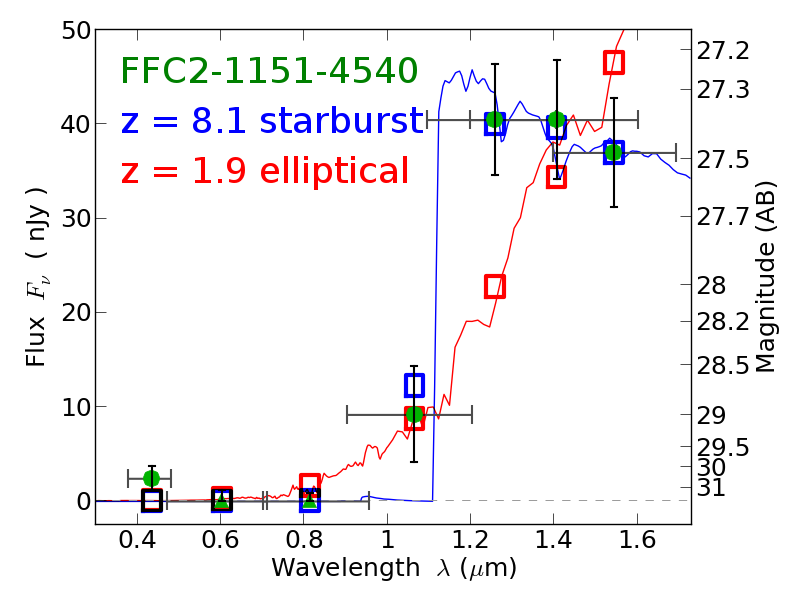
In Table 6, we report new high-redshift candidates lensed by MACSJ0416.1-2403. Due to the lack of deep WFC3/IR imaging, we do not yet expect to find many candidates. But we can search for brighter candidates in the 6-orbit CLASH WFC3/IR imaging. We find two separated by 1″: a confident candidate and a less confident candidate. We present image stamps in Figure 16 and SEDs in Figure 17
We also expand our search to allowing us to compare with Bradley et al. (2013) who identified candidates in CLASH imaging of 18 clusters including MACSJ0416.1-2403. They identified three strong candidates and four less confident candidates (with uncertainties extending to ) lensed by MACSJ0416.1-2403. (They also noted one candidate likely to be a star, which we exclude here.) Based on the deeper ACS imaging, two of their less confident candidates (#546, #419) are now more confidently high redshift. One of their confident candidates (#427) remains confident. Another (#1821) is surprisingly now more likely low redshift (). The third (#1957) is not properly deblended in our detection, lowering its redshift estimate to . We defer further analysis to the full ACS + WFC3/IR dataset.
7. Discussion
The Frontier Fields program promises to yield significant numbers of high redshift candidates, including 10 – 70 candidates at where only 10 or so are known to date (Zheng et al., 2012; Coe et al., 2013; Ellis et al., 2013; Oesch et al., 2013a, b). Importantly, the multiple sightlines will reduce uncertainties due to cosmic variance, or chance observations of overdense or underdense fields. The lensed fields are yielding nJy sources, the faintest galaxies observed to date. All of the lens models agree roughly on the number of faint galaxies expected, especially if the luminosity function faint end slope is as observed at .
In early Frontier Fields observations, including two deep (70 orbit) WFC3/IR images (with deep ACS imaging yet to come), we find no strong candidates. This contrasts with our expectation of 6 candidates per field assuming smooth luminosity function evolution as observed from to 8 continuing to .
Given the significant cosmic variance (more than per field; see Bouwens et al. 2014) and possible strong clustering expected (Trenti et al., 2012), the six independent sightlines of blank and lensed fields observed by the full Frontier Fields program will be key to constraining galaxy evolution in the first 600 million years.
References
- Abell (1958) Abell, G. O. 1958, ApJS, 3, 211 [ADS]
- Abell et al. (1989) Abell, G. O., Corwin, Jr., H. G., & Olowin, R. P. 1989, ApJS, 70, 1 [ADS]
- Atek et al. (2013) Atek, H., Richard, J., Kneib, J.-P., et al. 2013, arXiv, 1311.7670 [ADS]
- Behroozi & Silk (2014) Behroozi, P. S. & Silk, J. 2014, arXiv, 1404.5299 [ADS]
- Benítez (2000) Benítez, N. 2000, ApJ, 536, 571 [ADS]
- Bertin & Arnouts (1996) Bertin, E. & Arnouts, S. 1996, A&AS, 117, 393 [ADS]
- Bouwens et al. (2012a) Bouwens, R., Bradley, L., Zitrin, A., et al. 2012a, arXiv, 1211.2230 [ADS]
- Bouwens et al. (2006) Bouwens, R. J., Illingworth, G. D., Blakeslee, J. P., & Franx, M. 2006, ApJ, 653, 53 [ADS]
- Bouwens et al. (2011a) Bouwens, R. J., Illingworth, G. D., Labbe, I., et al. 2011a, Nature, 469, 504 [ADS]
- Bouwens et al. (2011b) Bouwens, R. J., Illingworth, G. D., Oesch, P. A., et al. 2011b, ApJ, 737, 90 [ADS]
- Bouwens et al. (2012b) —. 2012b, ApJ, 752, L5 [ADS]
- Bouwens et al. (2014) —. 2014, arXiv, 1403.4295 [ADS]
- Bradač et al. (2005) Bradač, M., Erben, T., Schneider, P., et al. 2005, A&A, 437, 49 [ADS]
- Bradač et al. (2009) Bradač, M., Treu, T., Applegate, D., et al. 2009, ApJ, 706, 1201 [ADS]
- Bradley et al. (2008) Bradley, L. D., Bouwens, R. J., Ford, H. C., et al. 2008, ApJ, 678, 647 [ADS]
- Bradley et al. (2012) Bradley, L. D., Trenti, M., Oesch, P. A., et al. 2012, ApJ, 760, 108 [ADS]
- Bradley et al. (2013) Bradley, L. D., Zitrin, A., Coe, D., et al. 2013, arXiv, 1308.1692 [ADS]
- Brammer et al. (2014) Brammer, G. B., Pirzkal, N., McCullough, P., & MacKenty, J. W. 2014, WFC3 Instrument Science Report 2014-03, Tech. rep., STScI
- Broadhurst et al. (2005) Broadhurst, T., Benítez, N., Coe, D., et al. 2005, ApJ, 621, 53 [ADS]
- Broadhurst et al. (1995) Broadhurst, T. J., Taylor, A. N., & Peacock, J. A. 1995, ApJ, 438, 49 [ADS]
- Bromm & Yoshida (2011) Bromm, V. & Yoshida, N. 2011, ARA&A, 49, 373 [ADS]
- Coe et al. (2006) Coe, D., Benítez, N., Sánchez, S. F., Jee, M., Bouwens, R., & Ford, H. 2006, AJ, 132, 926 [ADS]
- Coe et al. (2012) Coe, D., Umetsu, K., Zitrin, A., et al. 2012, ApJ, 757, 22 [ADS]
- Coe et al. (2013) Coe, D., Zitrin, A., Carrasco, M., et al. 2013, ApJ, 762, 32 [ADS]
- Dunlop (2013) Dunlop, J. S. 2013, in Astrophysics and Space Science Library, Vol. 396, Astrophysics and Space Science Library, ed. T. Wiklind, B. Mobasher, & V. Bromm, 223 [ADS]
- Dunlop et al. (2013) Dunlop, J. S., Rogers, A. B., McLure, R. J., et al. 2013, MNRAS, 432, 3520 [ADS]
- Ebeling et al. (2007) Ebeling, H., Barrett, E., Donovan, D., Ma, C., Edge, A. C., & van Speybroeck, L. 2007, ApJ, 661, L33 [ADS]
- Ellis et al. (2013) Ellis, R. S., McLure, R. J., Dunlop, J. S., et al. 2013, ApJ, 763, L7 [ADS]
- Fazio et al. (2004) Fazio, G. G., Hora, J. L., Allen, L. E., et al. 2004, ApJS, 154, 10 [ADS]
- Finkelstein et al. (2013) Finkelstein, S. L., Papovich, C., Dickinson, M., et al. 2013, Nature, 502, 524 [ADS]
- Finkelstein et al. (2012) Finkelstein, S. L., Papovich, C., Ryan, R. E., et al. 2012, ApJ, 758, 93 [ADS]
- Fioc & Rocca-Volmerange (1997) Fioc, M. & Rocca-Volmerange, B. 1997, A&A, 326, 950 [ADS]
- Fukugita et al. (1992) Fukugita, M., Futamase, T., Kasai, M., & Turner, E. L. 1992, ApJ, 393, 3 [ADS]
- Giallongo et al. (2005) Giallongo, E., Salimbeni, S., Menci, N., Zamorani, G., Fontana, A., Dickinson, M., Cristiani, S., & Pozzetti, L. 2005, ApJ, 622, 116 [ADS]
- Gonzaga & et al. (2012) Gonzaga, S. & et al. 2012, The DrizzlePac Handbook (STScI) [ADS]
- Grazian et al. (2006) Grazian, A., Fontana, A., de Santis, C., et al. 2006, A&A, 449, 951 [ADS]
- Grogin et al. (2011) Grogin, N. A., Kocevski, D. D., Faber, S. M., et al. 2011, ApJS, 197, 35 [ADS]
- Hildebrandt et al. (2010) Hildebrandt, H., Arnouts, S., Capak, P., et al. 2010, A&A, 523, A31+ [ADS]
- Hogg (1999) Hogg, D. W. 1999, ArXiv Astrophysics e-prints, astro-ph/9905116 [ADS]
- Ilbert et al. (2009) Ilbert, O., Capak, P., Salvato, M., et al. 2009, ApJ, 690, 1236 [ADS]
- Illingworth et al. (2013) Illingworth, G. D., Magee, D., Oesch, P. A., et al. 2013, ApJS, 209, 6 [ADS]
- Jauzac et al. (2012) Jauzac, M., Jullo, E., Kneib, J.-P., et al. 2012, MNRAS, 426, 3369 [ADS]
- Jouvel et al. (2014) Jouvel, S., Host, O., Lahav, O., et al. 2014, A&A, 562, A86 [ADS]
- Jullo et al. (2007) Jullo, E., Kneib, J.-P., Limousin, M., Elíasdóttir, Á., Marshall, P. J., & Verdugo, T. 2007, New Journal of Physics, 9, 447 [ADS]
- Kassiola & Kovner (1993) Kassiola, A. & Kovner, I. 1993, ApJ, 417, 450 [ADS]
- Kimble et al. (2008) Kimble, R. A., MacKenty, J. W., O’Connell, R. W., & Townsend, J. A. 2008, Proc. SPIE, 7010, 70101E [ADS]
- Kneib et al. (1993) Kneib, J. P., Mellier, Y., Fort, B., & Mathez, G. 1993, A&A, 273, 367 [ADS]
- Kneib & Natarajan (2011) Kneib, J.-P. & Natarajan, P. 2011, A&A Rev., 19, 47 [ADS]
- Koekemoer et al. (2013) Koekemoer, A. M., Ellis, R. S., McLure, R. J., et al. 2013, ApJS, 209, 3 [ADS]
- Koekemoer et al. (2011) Koekemoer, A. M., Faber, S. M., Ferguson, H. C., et al. 2011, ApJS, 197, 36 [ADS]
- Koekemoer et al. (2002) Koekemoer, A. M., Fruchter, A. S., Hook, R. N., & Hack, W. 2002, in The 2002 HST Calibration Workshop : Hubble after the Installation of the ACS and the NICMOS Cooling System, ed. S. Arribas, A. Koekemoer, & B. Whitmore, 337–+ [ADS]
- Laporte et al. (2014) Laporte, N., Streblyanska, A., Clement, B., et al. 2014, A&A, 562, L8 [ADS]
- Liesenborgs et al. (2006) Liesenborgs, J., De Rijcke, S., & Dejonghe, H. 2006, MNRAS, 367, 1209 [ADS]
- Liesenborgs et al. (2007) Liesenborgs, J., de Rijcke, S., Dejonghe, H., & Bekaert, P. 2007, MNRAS, 380, 1729 [ADS]
- Madau & Dickinson (2014) Madau, P. & Dickinson, M. 2014, arXiv, 1403.0007 [ADS]
- Mann & Ebeling (2012) Mann, A. W. & Ebeling, H. 2012, MNRAS, 420, 2120 [ADS]
- Mashian & Loeb (2013) Mashian, N. & Loeb, A. 2013, J. Cosmology Astropart. Phys, 12, 17 [ADS]
- McLure et al. (2013) McLure, R. J., Dunlop, J. S., Bowler, R. A. A., et al. 2013, MNRAS, 432, 2696 [ADS]
- Merten et al. (2009) Merten, J., Cacciato, M., Meneghetti, M., Mignone, C., & Bartelmann, M. 2009, A&A, 500, 681 [ADS]
- Merten et al. (2011) Merten, J., Coe, D., Dupke, R., et al. 2011, MNRAS, 417, 333 [ADS]
- Navarro et al. (1996) Navarro, J. F., Frenk, C. S., & White, S. D. M. 1996, ApJ, 462, 563 [ADS]
- Oesch et al. (2012a) Oesch, P. A., Bouwens, R. J., Illingworth, G. D., et al. 2012a, ApJ, 745, 110 [ADS]
- Oesch et al. (2012b) —. 2012b, arXiv, 1201.0755 [ADS]
- Oesch et al. (2013a) —. 2013a, ApJ, 773, 75 [ADS]
- Oesch et al. (2013b) —. 2013b, arXiv, 1309.2280 [ADS]
- Ono et al. (2012) Ono, Y., Ouchi, M., Mobasher, B., et al. 2012, ApJ, 744, 83 [ADS]
- Postman et al. (2012) Postman, M., Coe, D., Benítez, N., et al. 2012, ApJS, 199, 25 [ADS]
- Robertson et al. (2013) Robertson, B. E., Furlanetto, S. R., Schneider, E., et al. 2013, ApJ, 768, 71 [ADS]
- Santini et al. (2009) Santini, P., Fontana, A., Grazian, A., et al. 2009, A&A, 504, 751 [ADS]
- Schechter (1976) Schechter, P. 1976, ApJ, 203, 297 [ADS]
- Schenker et al. (2014) Schenker, M. A., Ellis, R. S., Konidaris, N. P., & Stark, D. P. 2014, arXiv, 1404.4632 [ADS]
- Schenker et al. (2013) Schenker, M. A., Robertson, B. E., Ellis, R. S., et al. 2013, ApJ, 768, 196 [ADS]
- Schmidt et al. (2014) Schmidt, K. B., Treu, T., Trenti, M., et al. 2014, arXiv, 1402.4129 [ADS]
- Shibuya et al. (2012) Shibuya, T., Kashikawa, N., Ota, K., Iye, M., Ouchi, M., Furusawa, H., Shimasaku, K., & Hattori, T. 2012, ApJ, 752, 114 [ADS]
- Tokunaga & Vacca (2005) Tokunaga, A. T. & Vacca, W. D. 2005, PASP, 117, 421 [ADS]
- Trenti et al. (2012) Trenti, M., Bradley, L. D., Stiavelli, M., et al. 2012, ApJ, 746, 55 [ADS]
- Trenti & Stiavelli (2008) Trenti, M. & Stiavelli, M. 2008, ApJ, 676, 767 [ADS]
- Windhorst et al. (2011) Windhorst, R. A., Cohen, S. H., Hathi, N. P., et al. 2011, ApJS, 193, 27 [ADS]
- Wuyts et al. (2008) Wuyts, S., Labbé, I., Schreiber, N. M. F., Franx, M., Rudnick, G., Brammer, G. B., & van Dokkum, P. G. 2008, ApJ, 682, 985 [ADS]
- Yan et al. (2012) Yan, H., Finkelstein, S. L., Huang, K.-H., et al. 2012, ApJ, 761, 177 [ADS]
- Yan et al. (2011) Yan, H., Yan, L., Zamojski, M. A., et al. 2011, ApJ, 728, L22 [ADS]
- Zheng et al. (2012) Zheng, W., Postman, M., Zitrin, A., et al. 2012, Nature, 489 [ADS]
- Zheng et al. (2014) Zheng, W., Shu, X., Moustakas, J., et al. 2014, arXiv, 1402.6743 [ADS]
- Zitrin et al. (2009) Zitrin, A., Broadhurst, T., Umetsu, K., et al. 2009, MNRAS, 396, 1985 [ADS]
- Zitrin et al. (2013) Zitrin, A., Meneghetti, M., Umetsu, K., et al. 2013, ApJ, 762, L30 [ADS]