Deep VLA Images of the HH 124 IRS Radio Cluster and its Surroundings and a New Determination of the Distance to NGC 2264
Abstract
We present new deep (Jy) radio images of the HH 124 IRS Radio Cluster at 4.8 and 7.5 GHz. We detect a total of 50 radio sources, most of them compact. Variability and spectral indices were analyzed in order to determine the nature of the sources and of their radio emission. A proper motion study was also performed for several of these radio sources using radio observation previously reported. Our analysis shows that 11 radio sources can be related with Galactic objects, most of them probably young stars. Interestingly, eight of these sources are in an area less than 1 square arcminute in size. The importance of such compact clusters resides in that all its members can be observed in a single pointing with most telescopes, and are, therefore, ideal for multi-wavelength studies of variability. Another 4 of the detected sources are clearly extragalactic. Finally, we propose from statistical arguments that from the remaining sources, about 10 are Galactic, but our study does not allow us to identify which of the sources fall in that specific category. The relatively large proper motions observed for the sources in HH 124 IRS suggest that this region is located at about 400 pc from the Sun. This is significantly smaller than the 800–900 pc distance usually assigned to the nearby open cluster NGC 2264 with which HH 124 is thought to be associated. However, a reanalysis of the Hipparcos parallaxes for members of NGC 2264, a convergent point approach, and a kinematic analysis all argue in favor of a distance of order 400 pc for NGC 2264 as well.
1 Introduction
Star forming regions often present large extinctions of A100 and higher. Thus, some young stellar objects (YSOs) are still hidden in their parental clouds and cannot be detected at optical or even near infrared wavelengths. The level of extinction diminishes for longer wavelengths, being essentially zero in the radio band. Fortunately, around 10-20% of the YSOs detected in X-ray and infrared studies are radio continuum emitters (e.g. André 1996, Dzib et al. 2013). This radio emission can have a thermal (free-free) origin, tracing partially ionized circumstellar material usually associated with outflowing material (Rodríguez 1997). Alternatively, it can be of non-thermal (gyrosynchrotron) origin, produced in the magnetically-active coronae of some young stars (e.g. André et al. 1992). These two types of radiations can be differentiated through their observational characteristics (see Dzib et al. 2013 for a recent discussion). Thermal free-free radiation is usually steady or only slowly variable (with timescales of years, e.g. Rodríguez 1994 and Rodríguez et al. 2012), with a spectral index 0.1, and with no polarization. In contrast, gyrosynchrotron radiation can show variation on timescales of hours to days and spectral indices ranging between very negative values in the optically thin case and in the optically thick limit. It can also show significant levels of circular polarization (e.g. Gómez et al. 2008).
During a program of studies of compact radio emission from regions of star formation, Reipurth et al. (2002) detected a remarkable compact () cluster of six radio objects associated with the HH 124 IRS region. Their flux densities were around 0.1 mJy on the average. All six sources (named VLA 1, 2, 7, 8, 9, and 10 by Reipurth et al.) appear to be variable on a timescale of days, showing excursions of several times 0.01 mJy from one day to the next. However, since the rms noise of the observations of Reipurth et al. (2002) for a given day were of order 0.01 to 0.02 mJy, comparable with the apparent variations, new observations of very high sensitivity were needed to test the reality of the variations. According to Reipurth et al. (2002), in the area where the six sources were found, less than one extragalactic source was expected given the level of sensitivity reached. Finally, since three of these radio sources have near-IR (2MASS) or optical counterparts, they were considered most likely young stellar objects (YSOs).
Here we report new, high sensitivity radio observations, performed with the Karl G. Jansky Very Large Array (VLA), of the HH 124 IRS region. Our main objective was to test the reality of the variations in the emission of the components of the compact radio cluster and to determine the nature of their emission. Also, an astrometric study was performed by combining our observations with those of Reipurth et al. (2002), in order to search for proper motions of the sources in the cluster.
2 Observations
The observations were made with the VLA of the NRAO111The National Radio Astronomy Observatory is operated by Associated Universities Inc. under cooperative agreement with the National Science Foundation. at C band (4 – 8 GHz) in the B configuration. The observations were split in two sub-bands, each with a bandwidth of 1 GHz, centered at 4.8 and 7.5 GHz. A total of four epochs were obtained. The first epoch was on 2012 June 9, and the remaining three were on three consecutive days from 2012 August 8 to 10.
At the beginning of each observation, we observed the standard flux calibrator 3C 138 for 10 minutes. Then we spent one minute on the phase calibrator J0632+1022 followed by nine minutes on the target; this cycle was repeated until the two hours of observation at each epoch were completed. The angular distance between the phase calibrator and the target is 2.54 degrees. The target phase center is RA = and Dec. = , it was chosen to be the center of the compact cluster reported by Reipurth et al. (2002).
The data were edited, calibrated and imaged in the standard fashion using the Common Astronomy Software Applications package (CASA222CASA is developed by an international consortium of scientists based at the National Radio Astronomical Observatory (NRAO), the European Southern Observatory (ESO), the National Astronomical Observatory of Japan (NAOJ), the CSIRO Australia Telescope National Facility (CSIRO/ATNF), and the Netherlands Institute for Radio Astronomy (ASTRON) under the guidance of NRAO.). After the calibration, the visibilities were imaged with a pixel size of 0.14 and 0.20 arcsecond, for the 7.5 and 4.8 GHz sub-bands, respectively. The weighting scheme used was intermediate between natural and uniform (WEIGHTING=’briggs’ with ROBUST=0.0 in CASA). The minimum level of the primary beam used was at a response of 20%. The final images covered circular areas of 10 and 16 arcminutes in diameter, for the 7.5 and 4.8 GHz sub-bands, respectively, and were corrected for the effects of the position-dependent primary beam response. The rms noise levels in the central part of the final images at each epoch were around 5.5 and 6.0 Jy beam-1, in the 7.5 and 4.8 GHz sub-bands, respectively. To obtain deeper images, we concatenated the four epochs, and then imaged the visibilities using the same scheme described above. The rms noise levels in the central part of these final images were 2.8 and 3.2 Jy beam-1, for the 7.5 and 4.8 GHz sub-bands, respectively. The synthesised beams at 7.5 GHz sub-band are ( ; ), ( ; ), ( ; ), and ( ; ) from the first to the last epoch, respectively. In the same way for the 4.8 GHz sub-bands are ( ; ), ( ; ), ( ; ), and ( ; ). For the images with the four concatenated epochs, the synthesised beams are ( ; ) and ( ; ), for the 7.5 and 4.8 GHz sub-bands, respectively. Using these images, we determined the source positions and flux densities using a two-dimensional fitting procedure (task IMFIT in CASA).
3 Results
We first searched for sources in the deep images obtained by concatenating all four epochs. We considered a detection reliable if the source was above three times the rms noise level in the localized area and had a previously known counterpart. If there were no known counterparts, then five times the rms noise level was required in at least one of the sub-bands. This procedure was adopted to minimize the possibility of reporting a large noise fluctuation as a real source.
With these requirements, a total of 50 sources were detected (Table 1). Of these, 28 were detected in both sub-bands, while 20 were detected only in the 4.8 GHz sub-band and 2 only in the 7.5 GHz sub-band. However, 13 of the 20 sources detected only in the 4.8 GHz sub-band fall outside the field of view of the 7.5 GHz image, so only 7 were undetected at 4.8 GHz because their fluxes are below three times the rms noise level. The positions and flux densities of each source from these images are listed in Table 1. Two sources of uncertainties on the fluxes are included: (i) the error that results from the statistical noise in the images, and (ii) a systematic uncertainty of 5% resulting from possible errors in the absolute flux calibration. The spectral index , where S, was determined for those sources detected in both sub-bands, and are also listed in Table 1. After the detection in the deep images, the flux density and position of each source was measured in the images corresponding to the individual epochs. For these images, we considered a non detection when the source was below three times the rms noise level.
Once the flux densities had been obtained from each epoch, they were compared to check for variability. The percentage of variability was measured as the ratio between the largest flux difference (maximum minus minimum flux densities) and the maximum flux density. We did not search for variability in sources with extended emission, because sensitivity and uv coverage effects can produce spurious variations. In addition, we included the uncertainty in the variability that is introduced by absolute pointing errors of the primary beam of the VLA antennas, as described in the Appendix. The percentage of variation in each sub-band is listed in Table 1. This variation was estimated using the four epochs for the sources that were detected at more than one epoch and are not extended. We considered as statistically significant only those variations that are above 3-. From Table 1 we can see that 10 sources (out of a total of 43 where variability could be measured) are variable at 4.8 GHz, while 3 (out of a total of 23) are variable at 7.5 GHz. If we restrict the analysis to the three consecutive epochs, we find that only 4 of the sources at 4.8 GHz are variable, while none of the 7.5 GHz sources is variable. Sources with such short-term variability are indicated in the table. The largest variations observed here are of the order of a factor of two.
3.1 Counterparts of the detected radio sources
Given the position of the sources, we looked for counterparts to the detected radio sources using the SIMBAD astronomical database. A source from SIMBAD was considered a counterpart if it was separated from a radio source reported here by less than 1.0 arcsec. We detected 8 of the 10 sources reported by Reipurth et al. (2002); the two exceptions being VLA 3 and 8. VLA 3 was clearly detected by Rodríguez & Reipurth (1998) with a flux density of 0.60 mJy at 8.3 GHz and considered by them to be a background source. We do not detect it at a level of 11 Jy beam-1, that represents three times the rms noise, at each sub-band, in the area where it was previously reported. This difference in flux densities suggests a large variability, of order 50. However, the observations of Rodríguez & Reipurth (1998) were made with lower angular resolution () than ours and we may be simply resolving out the source. VLA 8, also known as LkHA 46, is a YSO that was first detected in the radio by Reipurth et al. (2002), and showed strong flux variability, by a factor larger than 2, on timescales of days. We do not detect it here at three times the rms noise of 8.4 and 9.6 Jy for 7.5 and 4.8 GHz sub-bands, respectively. From these results, we conclude that LkHA 46 is also strongly variable on timescales of years.
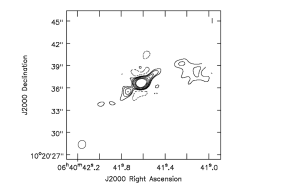
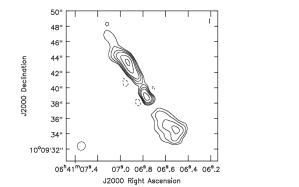
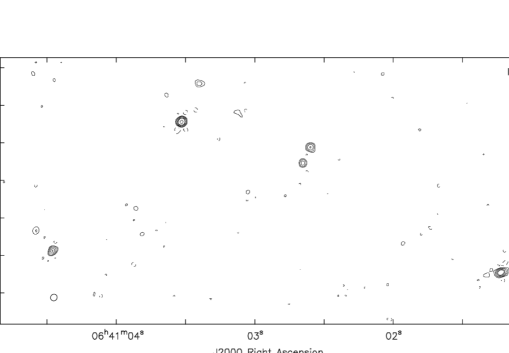
The 2MASS, WISE and SDSS8 catalogs (Cutri et al. 2003, Cutri et al. 2012 and Adelmann-McCarthy 2011, respectively) were also checked and some counterparts to the radio sources were found (see Table 2). HH124-VLA J064102.59 +101503.6 = VLA 1 and HH124-VLA J064102.65 +101501.8 = VLA 9, have infrared counterparts and are known to be YSOs. Together with VLA 8, they are the only radio sources confirmed to be YSOs. Another two of them, HH124-VLA J064041.61+102036.6 (shown in Figure 1) and HH124-VLA J064104.33+101240.9, are classified as extragalactic objects in the SDSS8. The object HH124-VLA J064118.28+101745.7 was associated to a stellar object in the SDSS8. The remaining sources have not been related to any kind of object but their low variability in the radio (Table 1) resembles that of extragalactic objects. Finally, in the cases of HH124-VLA J064106.77+100938.8, HH124-VLA J064112.78+101219.1 and HH124-VLA J064114.16+101158.5 = VLA 6, additionally to their low variability, their jet like morphologies also suggest an extragalactic nature (see Figures 1 and 2), but we cannot discard a Galactic nature.
3.2 Proper motions
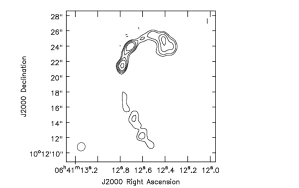
In order to investigate more about the nature of the radio sources around HH 124 IRS, we used the archive data reported by Reipurth et al. (2002) to measure the proper motions, , of the compact bright objects detected in both sessions. A total of eight objects fulfill these requirements and are listed in Table 3. We also include VLA 6 although it is resolved into three different components (see Figure 2). In this case, we consider only the northernmost component, which is the strongest, and use the position reported by Reipurth et al. (2002) corresponding to it. This component is resolved, and we obtain the position just to the brightest region. Its central component was marginally detected and resolved by Reipurth et al. (2002), and we do not perform astrometry with it. The third component was not detected by Reipurth et al. (2002).
 |
 |
 |
The data from Reipurth et al. (2002) were constituted by four 11-hour observations, taken on four consecutive days, from 2000 November 26 to 29, at 8.4 GHz. These data were edited and calibrated following the standard VLA procedures and using the software package AIPS. These observations used the quasar J0613+131 as the phase calibrator. Even though the phase calibrator is not the same for both sessions, their positions are well known and reliable astrometry can be performed. The position of quasar J0632+1022 is known to a level of 10 mas, that it is lower than the statistical errors in position obtained for C-band observations in B configuration. In addition, it is closer to the studied region and stronger than J0613+131, so the phase transfer is better.
In Table 3, the proper motions in Right Ascension, , and Declination , are presented. The total proper motions, , of most sources are consistent with a motion of 7 mas yr-1, except for VLA 6. VLA 6 was suggested to be an extragalactic object by Reipurth et al. (2002), so proper motions are not expected from this source. Indeed, its measured proper motion is consistent with no movement at the 1 level. We note that the lack of detectable motion for this source confirms the reliability of our astrometry.
4 Discussion
4.1 Kinematics of the region and individual objects
As already noted, most proper motions follow the tendency of an absolute value of 7 mas yr-1 in the southeast direction. The different phase calibrators used in both sessions could produce this apparent effect. However, the negligible proper motions of VLA 6, shows that this effect is not important. A more reasonable explanation is that we are measuring the intrinsic motion between the star forming region and the Sun. As YSOs in a star forming region are formed from the same cloud, it is expected that the young stars conserve the memory of the movement of the cloud and, thus, that they will share similar proper motions. We favor this effect as the main contributor to the proper motion tendency. In what follows we discuss some of the sources with measured proper motions in more details.
HH124-VLA J064101.22+101300.5 = VLA 7. Its total proper motion is the largest in our sample and its direction follows that of the group. This is consistent with it being a YSO.
HH124-VLA J064110.65+101538.2 = VLA 4. This source was previously suggested to be an extragalactic object (Reipurth et al. 2002). However, it has a positive spectral index and it is slightly variable. Its proper motion is the second largest in our sample and is in a similar direction as that of the other sources in the cluster. These properties strongly suggest that it is a Galactic object, most probably related to the HH 124 IRS cluster.
HH124-VLA J064112.23+101417.2 = VLA 5. This source was also suggested to be an extragalactic object (Reipurth et al. 2002). It has a flat spectral index and low variability. Within the errors in the spectral index it is not possible to favor if it is a Galactic or extragalactic object. Its proper motion suggests that is a Galactic object and probably related to the compact cluster HH 124 IRS.
HH124-VLA J064056.62+101408.7. The negative spectral index and the low variability of this source suggest an extragalactic origin. Its proper motions are consistent with no motion within two times the errors. Interestingly, however, the measured proper motions are similar to the estimated average of the other considered YSOs. As a consequence, we do not discard a Galactic nature.
4.2 Counts of Background Sources
From Table 1, the number of radio sources classified as definite or likely extragalactic sources is 39. All of them are detected in the 4.8 GHz sub-band, while only 20 are detected in the 7.5 GHz sub-band. Seven of these sources were not detected in the 7.5 GHz sub-band because they fell below three times the noise level in the image. The remaining 12 were outside of the field of view covered by the 7.5 GHz observations.
In order to determine if the number of background sources is consistent with the expected values, we compare them with the values given by the formulation of Anglada et al. (1998). Considering a minimal detection flux of 14 Jy and 16 Jy at 7.5 and 4.8 GHz, the number of expected sources are and . This estimate suggests that we are attributing an extragalactic nature to 10 sources that are actually Galactic. Unfortunately, with the present data it is not possible to establish which sources these might be.
4.3 The compact cluster of radio YSOs around HH 124 IRS
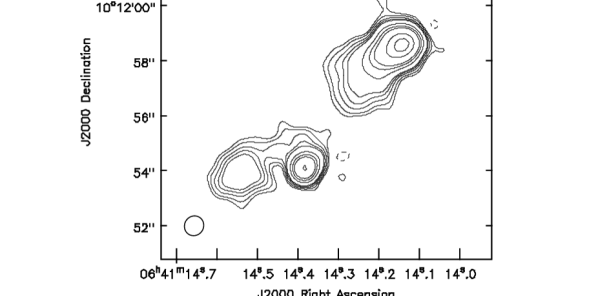
Our observations confirmed the existence of a remarkable cluster of radio sources concentrated to an area of less than 1 arcmin2 initially reported by Reipurth et al. (2002). In addition to the original six sources reported by Reipurth et al. (2002), we detect two new objects in this area (see Figure 3). In such a compact area, less than one background object is expected. Reipurth et al. (2002) reported possible day-to-day variability of the order of 10 Jy, but as the noise level was of the same order as the variability, it was not clear whether or not the variability was real. Our results discard strong day-to-day variability for most of these radio sources, as only the source VLA 10 showed clear short-term variations. However, it should be noted that 4 of the remaining 6 sources in the radio cluster have variability above 2- (but below our threshold of 3-), hinting again at the presence of low level day-to-day variability.
In addition to the cluster around HH 124 IRS, our results show that four other objects have a Galactic origin. HH124-VLA J064118.28+101745.7 is classified as a star in the SDSS8 survey. Its spectral index is not well determined because it was not detected in the 7.5 GHz sub-band. Its variability seems to be low. With the existing data, we cannot ascertain whether it is part of the cluster or a background/foreground object. HH124-VLA J064105.92+101551.7 is definitely a variable radio source, showing variation on timescales of days. This kind of behavior is typical of YSOs. The other two sources, VLA 4 and 5, show a steady flux. The spectral index of VLA 4 is positive which suggest that it is a YSO. VLA 5 shows a flat spectrum. The direction of the proper motions for both sources suggest that they are related to the compact cluster.
The spectral indices for most of the radio sources in the compact cluster are positive. Fluxes produced by thermal processes in YSOs are usually steady and consistent with no variations at all (Rodríguez 1994). On the other hand, gyrosynchrotron emission from YSOs can be variable, on timescales as short as hours (André 1996). Spectral indices for gyrosynchrotron emission vary from very negative to 2.5 (Dulk 1985). We suggest that both mechanisms are present in the different stars in the cluster, with thermal emission being the dominant process.
In a series of papers, Rodriguez & Reipurth (1994), Rodríguez & Reipurth (1996), Rodríguez & Reipurth (1998), Reipurth et al. (1999), Rodríguez et al. (2000), Reipurth et al. (2002) and Reipurth et al. (2004) observed a total of 28 regions of low mass star formation. HH 124, with a cluster of 8 radio sources in a region of only is the one with the densest concentration of sources per solid angle. This kind of compact clusters of YSOs with radio emission are rare and very useful to test the correlation between radio emission and emission at other wavelengths because they can be monitored simultaneously at radio, near-IR and X-ray wavelengths with single pointing observations. HH 124 IRS appears to be an ideal candidate for this kind of studies.
5 Distance to HH 124 and the nearby cluster NGC 2264
The distance to HH 124 IRS is poorly known. This region is usually associated to the nearby (in the plane of the sky) NGC 2264 cluster (see e.g. Reipurth et al. 2002), for which a distance of 913117 pc has been recently determined (Baxter et al. 2009). In this section, we will use our radio determination of the proper motions of sources in HH 124 IRS to estimate the distance to this cluster. We will also discuss the relation between HH 124 and NGC 2264, and revisit the distance determination to the latter.
5.1 A generalized kinematic distance to HH 124 IRS
Kinematic distances are often used for Galactic objects when no trigonometric parallaxes are available. Under this strategy, a Galactic rotation curve is assumed, and the expected value of the radial velocity is calculated as a function of distance for the line of sight corresponding to the Galactic coordinates of the object of interest. The distance ascribed to the object is that for which the expected value best matches the observed radial velocity. Evidently, a similar approach can be followed to estimate distances from the measured components of the proper motion. Here, the expected values of the two components of the proper motion will be calculated as a function of distance (assuming a rotation curve) for the line of sight of interest, and the distance ascribed to the source will be that for which the calculated value best matches the observed proper motion. Two different (but not entirely independent) estimates of the distance (one for each component of the proper motion) will be obtained by this method. Of course, if both the proper motion and the radial velocity are known for a given source, the traditional kinematic distance can also be measured, and three different estimates of the distance can be obtained. Kinematic distances based on proper motions have rarely been used because (i) accurate proper motions are much harder to measure than accurate velocities, and (ii) proper motions are angular velocities (i.e. space velocities divided by distance) so they rapidly become undetectably small with increasing distance.
Both the traditional kinematic distance method and its extension to proper motions are obviously subject to uncertainties. First, the observational errors on the radial velocity and proper motion determinations will propagate to result in an error on the inferred distance. Second, a rotation curve has to be assumed, and any error associated to that choice will affect the measured distances. A third source of error comes from the chosen value of the Solar motion required to transform velocities from the heliocentric to the LSR rest frame. While a value of km s-1 was widely used until recently following Dehnen & Binney (1998), a more recent determination by Schönrich et al. (2010) favours km s-1. We will use this latter value in the present work. Finally, the kinematic distance assumes that the objects move on circular orbits, as described by the rotation curve. In reality, there is also an unknown peculiar velocity contribution. In the case, considered here, of young stars recently formed out of interstellar material, this contribution can be assumed to be reasonably small (of order 10–15 km s-1 –Binney & Merrifield 1998). In addition, the velocity dispersions in radial / azimuthal / vertical Galactic directions are expected to be in the ratio of 10.610.47 (Binney & Merrifield 1998). Here, we will assume dispersions of 10.0 km s-1 in the radial direction, 6.1 km s-1 in the azimuthal direction, and 4.7 km s-1 in the vertical direction. This corresponds to a total velocity dispersion of 12.6 km s-1.
The radial velocity of the source driving the most prominent outflow in HH 124 is = 7.2 1.6 km s-1 (Margulis et al. 1988), corresponding to Vhel = 19.8 1.6 km s-1. On the other hand, from the radio observations presented here, we can estimate the proper motion of the HH 124 IRS cluster by averaging the values obtained for the seven sources identified as YSOs or candidate YSOs (Table 3). We obtain mas yr-1, mas yr-1. From this dataset, we can obtain three different kinematic estimations of the distance to HH 124 IRS (the traditional kinematic distance based on radial velocity, and two estimates based on the two components of the proper motion). The method is illustrated in Figure 4, and the results presented in Table 4. To assess the effect of the rotation curve choice, we have considered four options: (i) the traditional rotation curve of Brand & Blitz (1993); (ii) a flat rotation curve with the IAU recommended value of 220 km s-1 for the LSR circular speed; (iii) the more recent rotation curve proposed by Reid et al. (2009); and (iv) the flat rotation curve also proposed by Reid et al. (2009) with an LSR circular speed of 254 km s-1. The impact of peculiar velocities is shown as ”theoretical error bars” in Figure 4 and has been taken into account in the final distance uncertainties. Figure 4 and Table 4 shows that there is an overlap between the distance determinations produced by the three kinematic methods, so it is meaningful and advantageous to form the weighted mean of the three values. Also, it is clear from Table 4 that the choice of rotation curve only has a modest effect (of order 10%) on the final error budget. The errors are dominated by the observational uncertainties, and unknown peculiar velocities. In the rest of the paper, we will use the most recent rotation curve (by Reid et al. 2009), but emphasize that our results do not strongly depend on this choice.
The distance to HH 124 IRS favoured by our kinematical analysis is 404 127 pc (Note that the proper motions alone favor an even shorter distance of order 350 pc.) This is significantly shorter that the distance to the nearby cluster NGC 2264 favored in the recent literature (913117 pc). Yet, there is evidence for interactions between HH 124 and NGC 2264 (see e.g. Reipurth et al. 2002). Let us now discuss the distance to NGC 2264.

5.2 A review of existing distance estimates for NGC 2264
NGC 2264 is a young open cluster related to the Mon OB 1 association that has been the focus of many studies of stellar evolution. Distance estimates for NGC 2264 reported in the literature from 1950 to 1985 range from 500 pc to 875 pc (see Table IX of Perez et al. 1987), but more recent determinations yield 95075 pc (Perez et al. 1987), 91050 (Neri et al. 1993) and 76085 (Sung et al. 1997). Most of these distance determinations have been derived by the same technique, i.e. cluster fitting of the HR-diagram, and the different results reflect different choices of sample of stars, photometry, and cluster reddening by different authors. In a recent paper, Baxteret al. (2009) employed a different technique and derived a distance of 91340 pc to NGC 2264 by using a method that takes the projected rotational velocities of cluster members and models the observed distribution of (where is the inclination angle of the stellar rotational axis).
As a first approach to examine further the distance to NGC 2264, we searched the new version of the Hipparcos catalog (van Leeuwen 2007) for stars in NGC 2264 with known parallax. We found trigonometric parallaxes for five ‘classical’ cluster members (S Mon, HD 47777, HD 47961, HD 48055 and HD 47732) identified by Walker (1956). Recently, van Leeuwen (2009) revisited the properties of the NGC 2264 cluster and included in his analysis another four stars (HD 47662, HD 47751, HIP 32141 and HIP 32245) in the cluster field that exhibit proper motions and parallax values consistent with the ‘classical’ members listed above. These stars are given in Table 5 together with their proper motions and radial velocities (to be discussed later in this section). The distances corresponding to these trigonometric parallaxes ranges form 254 to 970 pc. Interestingly, the trigonometrical parallax for S Mon, the dominant stellar component of this cluster, is mas corresponding to a distance of pc. The two analysis performed by van Leeuwen (2009) for the NGC 2264 cluster gives parallaxes of mas (435 pc) and mas (552 pc). The first was using the data for all nine stars and the second was obtained by excluding (somewhat arbitrarily) the three stars with parallax near 3.5 mas, i.e. distances shorter than 300 pc. The weighted mean of the nine parallaxes listed in Table 5 is mas ( pc); if we retain only the five ‘classical’ cluster members given in the upper panel of Table 5 we find instead mas ( pc) showing that both results are consistent between themselves. In summary, all Hipparcos estimates of the distance to the NGC 2264 cluster lie between 280 and 550 pc, with a mean around 405 pc. This is inconsistent with the indirect methods that we mentioned earlier, but in excellent agreement with our generalized kinematic method result for HH 124 IRS.
5.3 A convergent point distance to NGC 2264
To make further progress, we queried the CDS database for stars and YSOs related to the NGC 2264 cluster within of its central position, , (Wu et al. 2009), and found 4004 stars previously identified in many studies (Walker 1956; Sagar & Joshi 1983; Sung et al. 1997; Flaccomio et al. 1999, 2000, 2006; Rebull et al. 2002; Sung et al. 2004; Lamm et al. 2004; Ramírez et al. 2004; Dahm & Simon 2005; Dahm et al. 2007). We searched for proper motion data in the Tycho-2 (Høg et al. 2002), UCAC4 (Zacharias et al. 2013) and PPMXL (Roeser et al. 2010) catalogs, and found at least one proper motion measurement for 2024 stars. Among the various proper motions measurements we select the ones with the smallest uncertainties. We reject all stars with proper motion values that are not significant (i.e., ), because of measurement errors, and stars that exhibit discrepant proper motion data (after a elimination). This leaves us with 584 stars in the sample. We found radial velocity information for only 58 stars in that sample. The main source of radial velocities is Fűrész et al. (2006) who showed that the heliocentric radial velocity distribution of cluster members peaks at km s-1 with a dispersion of km s-1. We adopt their radial velocity membership selection criteria and retain only those stars with 8 km s-1 36 km s-1. This leaves us with a final sample of 17 stars (see Table 6) that will be used in the upcoming analysis to estimate the distance to NGC 2264.
Figure 5 shows the proper motion vectors for NGC 2264 stars. One notices that the proper motion vectors point towards a common direction in the sky suggesting the existence of a moving group structure in NGC 2264 as observed in other nearby star-forming regions (see e.g. Bertout & Genova 2006; Galli et al. 2013). Apparently the stellar proper motions in NGC 2264 are not convergent enough to allow for an accurate convergent point solution and membership analysis (which is clearly beyond the scope of this paper) using the usual methods and algorithms given in the literature (Jones 1971; de Bruijne 1999; Galli et al. 2012), because of the large proper motions errors involved and cluster concentration (see Galli et al. 2012 for a more detailed discussion). So we estimate an approximate location of the convergent point using Eq. (10) of de Bruijne (1999) that relates the spatial velocity components with the convergent point coordinates . We calculate the Galactic space motion vector for the ‘classical’ cluster members of NGC 2264 using the procedure described in Johnson & Soderblom (1987) with the proper motions, radial velocities and parallaxes given in Table 5. HD 48055 is excluded from this analysis because it exhibits a negative value for the radial velocity that is not consistent with the remaining members (see discussion below). The mean Galactic space motion vector with respect to the Sun is km/s. We find that the mean space motion vector mentioned before is consistent with a convergent point located at . The so-derived convergent point position should be interpreted with care, because it does not take into account, e.g., the velocity dispersion of the cluster and the various sources of errors discussed by Galli et al. (2012). However, this strategy has proven to yield consistent results in young nearby associations (see e.g. Mamajek 2005; Bertout & Genova 2006) and it will be used in this work only to provide some guidance in our analysis.
Once the convergent point position of a moving group has been determined, it can be used to calculate kinematic parallaxes of individual group members (see e.g. Bertout & Genova 2006; Galli et al. 2013). The individual kinematic parallaxes are given by
| (1) |
where km yr s-1, is the angular distance between the convergent point and a given star in the group, is the radial velocity, and is the stellar proper motion component directed parallel to the great circle that joins the star and the convergent point (see de Bruijne 1999; Galli et al. 2012). This analysis is obviously restricted to the 17 stars with known radial velocities (see Table 6). We stress that the so-derived parallaxes (i.e., distances) should be seen as tentative values due to the large proper motions errors given for a few cluster members in our sample and the approximate location of the convergent point derived from the spatial velocity of Hipparcos stars. In order to make our parallax results less dependent on a single combination of proper motion, radial velocity and convergent point values we performed Monte Carlo simulations that sample the uncertainties of these parameters. In each run we vary the convergent point position within its error bars and assign a different value of proper motion and radial velocity for each star in the sample by resampling these quantities from a Gaussian distribution where the mean and variance correspond, respectively, to the measured value and its uncertainty. We constructed a total of 1000 Monte Carlo realizations and present our distance results in Figure 6. We find a mean distance of 340 pc and a median distance of 300 pc. These results are consistent with the mean distance derived from the trigonometric parallaxes of the Hipparcos catalog (van Leeuwen 2007) within the admittedly large error bars, and with our distance estimate for the HH 124 IRS cluster.
5.4 Generalized kinematic distances to NGC 2264
As a final exercise, we applied our generalized kinematic method to the 17 stars of NGC 2264 listed in Table 6. The method failed on 4 of those stars because the sign of the proper motion component in the direction of Galactic longitude could not be reproduced for any distance. The mean and median distances obtained for the other 13 stars are 453 and 391 pc, respectively. This is, again, in good agreement with the Hipparcos and convergent point distances derived earlier for NGC 2264 and with the kinematic distance of HH 124. As a consequence, we favor a distance of order 400 pc both for HH 124 IRS and for NGC 2264.
This new estimation of the distance is around two times lower than values commonly used in the literature. The used kinematic methods are biased to closer objects which proper motions are better determined. The trigonometrical parallax, however, is a geometric method and does not depend in any physical property of the star. Finally, NGC 2264 has an angular size of 250′, thus it is not unlikely that several star forming regions are trough the line of sight at diferent distances.


6 Conclusions
We presented a series of deep VLA observations of the compact cluster of radio sources around HH 124 IRS. We analyze their spectral indices (between 4.8 and 7.5 GHz), and variability. Also a rough estimate of proper motions was performed to objects detected in both the Reipurth et al. (2002) observations and those reported in this paper. The results show that most of the sources detected by Reipurth et al. (2002) in the cluster are YSOs. We detected two additional sources (both likely YSOs) in the compact cluster, bringing to at least 11 the total number of radio-bright YSOs in HH 124 IRS. Eight of these sources are in an area smaller than 1 arcmin2. The importance of such compact clusters resides in that all of them can be observed in a single pointing with most telescopes. Thanks to these characteristics, HH 124 IRS is an ideal region where to perform simultaneous observations at different wavelengths to understand the variable radio emission and its correlation (or lack thereof) with emission at other wavelengths.
A generalized kinematic method that takes into account both the proper motions and the radial velocity was applied to the sources in HH 124 IRS, and yields a distance of order 400 pc. This is significantly smaller than the 800–900 pc distance usually assigned to the nearby open cluster NGC 2264 with which HH 124 is thought to be associated. However, a reanalysis of the Hipparcos parallaxes for members of NGC 2264, a convergent point approach applied to NGC 2264 members with known proper motions, and a generalized kinematic analysis of sources in NGC 2264 all argue in favor of a distance of order 400 pc for NGC 2264 as well. Thus, we argue that both HH 124 IRS and NGC 2264 are located about twice nearer than usually assumed.
Appendix A Error introduced in the variability by pointing errors of the primary beam
Using the standard pointing constants, the pointing error for the VLA antennas is generally 10 to 20 arcseconds, and can be as bad as an arcminute (Rupen 1997). To correct for this problem, a technique known as referenced pointing is used to reduce this pointing error to a few arcsec. However, in observations below about 18 GHz (as in our case), referenced pointing is not generally used.
These pointing errors introduce an error in the flux density determination of the sources and thus in the determination of possible variability. This error is more serious for sources away from the pointing center, since there a small shift may represent an important change in the primary beam response. In contrast, for sources near the pointing center a small shift is not important, given the relatively flat response of the primary beam there.
To include this error in our variability determinations, we start by noting that the primary beam response can be approximated by a Gaussian function:
where is the displacement from the pointing center and is the full width at half power of the primary beam. In the radial direction the change in response with angular displacement is given by
where is the pointing error. In this last equation we can see that the flux density error increases linearly with the displacement from the pointing center. Finally, taking the absolute value of the equation, we find that the relative error is given by
We have taken this effect approximately into account by adding in quadrature this relative error to the other errors in the measurement, assuming as the typical value for the pointing error. For example, for a of , one expects errors of order 8% for a source at and of 23% for a source at .
References
- Adelman-McCarthy & et al. (2011) Adelman-McCarthy, J. K., & et al. 2011, VizieR Online Data Catalog, 2306, 0
- Andre (1996) Andre, P. 1996, Radio Emission from the Stars and the Sun, 93, 273
- Andre et al. (1992) Andre, P., Deeney, B. D., Phillips, R. B., & Lestrade, J.-F. 1992, ApJ, 401, 667
- Anglada et al. (1998) Anglada, G., Villuendas, E., Estalella, R., et al. 1998, AJ, 116, 2953
- Baxter et al. (2009) Baxter, E. J., Covey, K. R., Muench, A. A., et al. 2009, AJ, 138, 963
- Bertout & Genova (2006) Bertout, C., & Genova, F. 2006, A&A, 460, 499
- Brand & Blitz (1993) Brand, J., & Blitz, L. 1993, A&A, 275, 67
- Binney & Merrifield (1998) Binney, J., & Merrifield, M. 1998, Galactic astronomy / James Binney and Michael Merrifield. Princeton, NJ : Princeton University Press, 1998. (Princeton series in astrophysics) QB857 .B522 1998 ($35.00),
- Cutri et al. (2003) Cutri, R. M., Skrutskie, M. F., van Dyk, S., et al. 2003, ”The IRSA 2MASS All-Sky Point Source Catalog, NASA/IPAC Infrared Science Archive. A href=”http://irsa.ipac.caltech.edu/applications/Gator/”
- Cutri & et al. (2012) Cutri, R. M., & et al. 2012, VizieR Online Data Catalog, 2311, 0
- Dahm & Simon (2005) Dahm, S. E., & Simon, T. 2005, AJ, 129, 829
- Dahm et al. (2007) Dahm, S. E., Simon, T., Proszkow, E. M., & Patten, B. M. 2007, AJ, 134, 999
- de Bruijne (1999) de Bruijne, J. H. J. 1999, MNRAS, 306, 381
- de Bruijne & Eilers (2012) de Bruijne, J. H. J., & Eilers, A.-C. 2012, A&A, 546, A61
- Dehnen & Binney (1998) Dehnen, W., & Binney, J. J. 1998, MNRAS, 298, 387
- Dulk (1985) Dulk, G. A. 1985, ARA&A, 23, 169
- Dzib et al. (2013) Dzib, S. A., Loinard, L., Mioduszewski, A. J., et al. 2013, arXiv:1307.5105
- Fehrenbach et al. (1992) Fehrenbach, C., Burnage, R., & Figuiere, J. 1992, A&AS, 95, 541
- Flaccomio et al. (1999) Flaccomio, E., Micela, G., Sciortino, S., et al. 1999, A&A, 345, 521
- Flaccomio et al. (2000) Flaccomio, E., Micela, G., Sciortino, S., et al. 2000, A&A, 355, 651
- Flaccomio et al. (2006) Flaccomio, E., Micela, G., & Sciortino, S. 2006, A&A, 455, 903
- Fűrész et al. (2006) Fűrész, G., Hartmann, L. W., Szentgyorgyi, A. H., et al. 2006, ApJ, 648, 1090
- Galli et al. (2012) Galli, P. A. B., Teixeira, R., Ducourant, C., Bertout, C., & Benevides-Soares, P. 2012, A&A, 538, A23
- Galli et al. (2013) Galli, P. A. B., Bertout, C., Teixeira, R., & Ducourant, C. 2013, A&A, 558, A77
- Gómez et al. (2008) Gómez, L., Rodríguez, L. F., Loinard, L., et al. 2008, ApJ, 685, 333
- Gontcharov (2006) Gontcharov, G. A. 2006, Astronomy Letters, 32, 759
- Høg et al. (2000) Høg, E., Fabricius, C., Makarov, V. V., et al. 2000, A&A, 355, L27
- Kharchenko et al. (2007) Kharchenko, N. V., Scholz, R.-D., Piskunov, A. E., Röser, S., & Schilbach, E. 2007, Astronomische Nachrichten, 328, 889
- Johnson & Soderblom (1987) Johnson, D. R. H., & Soderblom, D. R. 1987, AJ, 93, 864
- Jones (1971) Jones, D. H. P. 1971, MNRAS, 152, 231
- Lamm et al. (2004) Lamm, M. H., Bailer-Jones, C. A. L., Mundt, R., Herbst, W., & Scholz, A. 2004, A&A, 417, 557
- Mamajek (2005) Mamajek, E. E. 2005, ApJ, 634, 1385
- Margulis et al. (1988) Margulis, M., Lada, C. J., & Snell, R. L. 1988, ApJ, 333, 316
- Neri et al. (1993) Neri, L. J., Chavarria-K., C., & de Lara, E. 1993, A&AS, 102, 201
- Ochsenbein (1980) Ochsenbein, F. 1980, Bulletin d’Information du Centre de Donnees Stellaires, 19, 74
- Perez et al. (1987) Perez, M. R., The, P. S., & Westerlund, B. E. 1987, PASP, 99, 1050
- Ramírez et al. (2004) Ramírez, S. V., Rebull, L., Stauffer, J., et al. 2004, AJ, 127, 2659
- Rebull et al. (2002) Rebull, L. M., Makidon, R. B., Strom, S. E., et al. 2002, AJ, 123, 1528
- Reid et al. (2009) Reid, M. J., Menten, K. M., Zheng, X. W., et al. 2009, ApJ, 700, 137
- Reipurth et al. (1999) Reipurth, B., Rodríguez, L. F., & Chini, R. 1999, AJ, 118, 983
- Reipurth et al. (2002) Reipurth, B., Rodríguez, L. F., Anglada, G., & Bally, J. 2002, AJ, 124, 1045
- Reipurth et al. (2004) Reipurth, B., Rodríguez, L. F., Anglada, G., & Bally, J. 2004, AJ, 127, 1736
- Rodriguez & Reipurth (1994) Rodriguez, L. F., & Reipurth, B. 1994, A&A, 281, 882
- Rodríguez & Reipurth (1996) Rodríguez, L. F., & Reipurth, B. 1996, Rev. Mexicana Astron. Astrofis., 32, 27
- Rodríguez et al. (2000) Rodríguez, L. F., Delgado-Arellano, V. G., Gómez, Y., et al. 2000, AJ, 119, 882
- Rodríguez (1994) Rodríguez, L. F. 1994, Rev. Mexicana Astron. Astrofis., 29, 69
- Rodriguez (1997) Rodriguez, L. F. 1997, Herbig-Haro Flows and the Birth of Stars, 182, 83
- Rodríguez & Reipurth (1998) Rodríguez, L. F., & Reipurth, B. 1998, Rev. Mexicana Astron. Astrofis., 34, 13
- Rodríguez et al. (2012) Rodríguez, L. F., Dzib, S. A., Loinard, L., et al. 2012, Rev. Mexicana Astron. Astrofis., 48, 243
- Roeser et al. (2010) Roeser, S., Demleitner, M., & Schilbach, E. 2010, AJ, 139, 2440
- Rupen (1997) Rupen, M. P. 1997, VLA Test Memorandum No. 202: Referenced Pointing at the VLA (www.vla.nrao.edu/memos/test/202/)
- Sagar & Joshi (1983) Sagar, R., & Joshi, U. C. 1983, MNRAS, 205, 747
- Schönrich et al. (2010) Schönrich, R., Binney, J., & Dehnen, W. 2010, MNRAS, 403, 1829
- Sung et al. (1997) Sung, H., Bessell, M. S., & Lee, S.-W. 1997, AJ, 114, 2644
- Sung et al. (2004) Sung, H., Bessell, M. S., & Chun, M.-Y. 2004, AJ, 128, 1684
- van Leeuwen (2007) van Leeuwen, F. 2007, Astrophysics and Space Science Library, 350,
- van Leeuwen (2009) van Leeuwen, F. 2009, A&A, 497, 209
- Walker (1956) Walker, M. F. 1956, ApJS, 2, 365
- Wilson (1953) Wilson, R. E. 1953, Carnegie Institute Washington D.C. Publication, 0
- Wu et al. (2009) Wu, Z.-Y., Zhou, X., Ma, J., & Du, C.-H. 2009, MNRAS, 399, 2146
- Zacharias et al. (2013) Zacharias, N., Finch, C. T., Girard, T. M., et al. 2013, AJ, 145, 44
| Name | Flux Properties | Spectral | Source | |||
|---|---|---|---|---|---|---|
| HH124-VLA | (mJy) | Var. (%) | (mJy) | Var. (%) | Index | typeaa E = Extragalactic, YSO = Young Stellar Object. Interrogation simbols indicates that we do no discard an extragalactic or galactic origin. |
| J064032.32+101644.0 | (2.040.070.10)e+00 | 32.39.6 | – | – | – | E? |
| J064032.44+101644.9 | (1.160.070.06)e+00 | 30.510.8 | – | – | – | E? |
| J064041.61+102036.6 | (4.070.040.20)e+00 | Extended | – | – | – | E |
| J064047.85+100829.3 | (2.760.510.14)e-01 | 24.329.1 | – | – | – | E? |
| J064049.82+101027.4 | (9.201.700.46)e-02 | 44.915.0 | – | – | – | E? |
| J064050.28+101417.8 | (5.220.740.26)e-02 | 41.618.8 | (2.750.550.14)e-02 | 19.329.4 | -1.40.56 | E? |
| J064050.63+101420.8 | (3.780.460.19)e-02 | 20.118.7 | 0.02 | – | -1.590.31 | E? |
| J064053.63+101343.8 | (3.450.320.17)e-02 | 34.016.0 | (3.660.650.18)e-02 | 46.020.2 | 0.130.47 | E? |
| J064056.62+101408.7 | (2.740.230.14)e-01 | 21.212.0 | (1.840.160.09)e-01 | 39.613.1 | -0.870.31 | E? |
| J064058.51+101445.2 | (3.240.300.16)e-02 | 35.312.7 | (3.130.310.16)e-02 | 40.913.1 | -0.080.34 | E? |
| J064059.25+101756.8 | (5.690.620.28)e-02 | 11.620.5 | (3.620.500.18)e-02 | 32.117.2 | -0.990.42 | E? |
| J064059.64+101758.9 | (2.690.460.13)e-02 | 29.910.1 | 0.02 | – | -0.990.41 | E? |
| J064059.89+101214.4 | (4.680.520.23)e-02 | 55.17.6 | (3.570.610.18)e-02 | –bbSource not detected at three times the noise level on individual epochs, but detected on the image of the concatenated epochs. | -0.590.47 | E? |
| J064100.01+102222.7 | (1.190.070.06)e+00 | 21.110.0 | – | – | – | E? |
| J064101.12+101208.4 | (8.150.600.41)e-02 | 14.814.7 | (5.350.550.27)e-02 | 29.017.5 | -0.920.32 | E? |
| J064101.21+101450.1 | (9.890.670.49)e-02 | 7.59.2 | (7.810.540.39)e-02 | 27.410.8 | -0.520.26 | YSO? |
| J064101.22+101300.5 | (4.140.430.21)e-02 | 15.220.7 | (2.770.290.14)e-02 | 47.619.7 | -0.880.36 | E? |
| J064102.59+101503.5 | (3.870.490.19)e-02 | 38.019.3 | (3.830.320.19)e-02 | 29.014.0 | -0.020.37 | YSO |
| J064102.65+101501.8 | (1.500.510.07)e-02 | –bbSource not detected at three times the noise level on individual epochs, but detected on the image of the concatenated epochs. | (2.670.270.13)e-02 | 33.515.6 | 1.260.79 | YSO |
| J064103.39+101510.3 | 0.01 | – | (2.670.270.13)e-02 | 47.420.9 | 1.870.39 | YSO? |
| J064103.52+101506.2 | (7.780.470.39)e-02 | 18.610.2 | (8.320.590.42)e-02 | 15.212.8 | 0.150.26 | YSO? |
| J064104.33+101240.9 | (7.270.480.36)e-02 | 32.610.2 | (7.870.600.39)e-02 | 13.816.3 | 0.170.27 | E |
| J064104.45+101452.5ccTime variable sources on a timescale of 3 days. | (3.410.360.17)e-02 | 51.312.1 | (4.470.410.22)e-02 | 24.315.7 | 0.590.34 | YSO? |
| J064104.58+101454.6 | 0.01 | – | (4.470.410.22)e-02 | 33.723.7 | 1.260.35 | YSO? |
| J064104.92+101340.0 | (2.620.470.13)e-02 | 44.19.7 | (2.140.680.11)e-02 | –bbSource not detected at three times the noise level on individual epochs, but detected on the image of the concatenated epochs. | -0.440.81 | E? |
| J064105.92+101551.7ccTime variable sources on a timescale of 3 days. | (4.150.360.21)e-02 | 40.710.6 | (3.350.370.17)e-02 | 28.316.4 | -0.470.34 | YSO? |
| J064106.53+101739.7 | (4.500.410.22)e-02 | 27.017.9 | (3.610.850.18)e-02 | 36.617.6 | -0.480.57 | E? |
| J064106.77+100938.8 | (3.090.030.15)e+00 | Extended | – | – | – | E |
| J064107.90+102201.0 | (6.470.500.32)e-01 | 14.111.7 | – | – | – | E? |
| J064109.69+101455.7 | (5.470.660.27)e-02 | 31.417.0 | (5.401.300.27)e-02 | 58.119.6 | -0.030.61 | E? |
| J064110.65+101538.2 | (3.080.150.15)e-01 | 9.37.7 | (3.890.050.19)e-01 | 6.33.1 | 0.510.19 | YSO? |
| J064111.69+101417.6 | (2.490.480.12)e-02 | 16.721.9 | (2.160.460.11)e-02 | –bbSource not detected at three times the noise level on individual epochs, but detected on the image of the concatenated epochs. | -0.310.65 | E? |
| J064112.18+101010.3ccTime variable sources on a timescale of 3 days. | (2.740.040.14)e+01 | 12.32.3 | – | – | – | E? |
| J064112.23+101417.2ccTime variable sources on a timescale of 3 days. | (9.160.070.46)e-01 | 14.11.5 | (8.750.060.44)e-01 | 10.03.0 | -0.10.16 | YSO? |
| J064112.49+101416.4 | (1.180.100.06)e-01 | 17.514.5 | (9.170.840.46)e-02 | 12.822.2 | -0.550.31 | E? |
| J064112.78+101219.1 | (9.520.190.48)e-01 | Extended | (4.830.210.24)e-01 | Extended | – | E |
| J064114.16+101158.5 | (2.610.010.13)e+01 | Extended | (1.570.010.08)e+01 | Extended | – | E |
| J064115.05+101148.8 | (8.670.960.43)e-02 | 29.418.1 | (3.620.700.18)e-02 | –bbSource not detected at three times the noise level on individual epochs, but detected on the image of the concatenated epochs. | -1.910.51 | E? |
| J064115.18+101655.8 | (2.870.380.14)e-02 | 43.515.3 | 0.02 | – | -0.340.33 | E? |
| J064115.29+101126.3 | (1.230.130.06)e-01 | 46.812.9 | (1.010.180.05)e-01 | –bbSource not detected at three times the noise level on individual epochs, but detected on the image of the concatenated epochs. | -0.430.48 | E? |
| J064116.18+101441.4 | (2.280.150.11)e-01 | 13.012.3 | (1.310.100.07)e-01 | 39.517.9 | -1.210.27 | E? |
| J064117.55+101533.4 | (6.760.690.34)e-02 | 15.518.4 | (4.990.710.25)e-02 | 27.927.8 | -0.670.41 | E? |
| J064118.28+101745.7 | (4.130.640.21)e-02 | 39.117.9 | 0.06 | – | 0.820.37 | Star |
| J064119.82+101537.6 | (5.380.760.27)e-02 | 49.312.8 | 0.04 | – | -0.710.35 | E? |
| J064120.73+101323.4 | (8.200.790.41)e-02 | 30.615.8 | 0.06 | – | -0.580.26 | E? |
| J064122.32+101439.7 | (5.710.550.29)e-02 | 7.424.1 | 0.07 | – | 0.280.26 | E? |
| J064123.26+101036.6 | (2.310.180.12)e+00 | 13.811.3 | – | – | – | E? |
| J064123.64+101231.7 | (6.770.740.34)e-02 | –bbSource not detected at three times the noise level on individual epochs, but detected on the image of the concatenated epochs. | – | – | – | E? |
| J064124.11+101949.7 | (4.770.410.24)e-01 | 32.011.5 | – | – | – | E? |
| J064126.64+101008.6 | (3.380.260.17)e-01 | 27.017.2 | – | – | – | E? |
| HH124-VLA Name | Radio | WISE | 2MASS | SDSS | Origin |
|---|---|---|---|---|---|
| J064041.61+102036.6 | Y | Y | Y | E | |
| J064101.21+101450.1 | VLA 7 | N | N | N | YSO? |
| J064102.59+101503.6 | VLA 1 | Y | Y | N | YSO |
| J064102.65+101501.8 | VLA 9 | Y | Y | N | YSO |
| J064103.52+101506.2 | VLA 2 | N | N | N | YSO? |
| J064104.45+101452.5 | VLA 10 | N | N | N | YSO? |
| J064110.65+101538.2 | VLA 4 | N | N | N | YSO? |
| J064112.23+101417.2 | VLA 5 | N | N | N | YSO? |
| J064114.16+101158.5 | VLA 6 | N | N | N | E |
| J064104.33+101240.9 | Y | Y | Y | E | |
| J064106.77+100938.8 | Y | N | N | E? | |
| J064112.18+101010.3 | Y | N | N | E? | |
| J064115.29+101126.3 | Y | N | N | E? | |
| J064118.28+101745.7 | Y | Y | Y | Star | |
| J064120.73+101323.4 | Y | N | N | E? | |
| J064126.64+101008.6 | Y | N | N | E? |
| HH124-VLA Name | (mas yr-1) | (mas yr-1) | (mas yr-1) | Type |
|---|---|---|---|---|
| J064056.62+101408.7 | E? | |||
| J064101.21+101450.1=VLA 7 | YSO? | |||
| J064102.59+101503.6=VLA 1 | YSO | |||
| J064102.65+101501.8=VLA 9 | YSO | |||
| J064103.52+101506.2=VLA 2 | YSO? | |||
| J064104.45+101452.5=VLA 10 | YSO? | |||
| J064110.65+101538.2=VLA 4 | YSO? | |||
| J064112.23+101417.2=VLA 5 | YSO? | |||
| J064114.16+101158.5=VLA 6 | E |
| Rotation curve | (pc) | (pc) | (pc) | (pc) |
|---|---|---|---|---|
| Blitz & Rand | 620 | 430 | 280 | 356 155 |
| Flat (IAU) | 600 | 450 | 240 | 362 148 |
| Reid et al. | 550 | 390 | 240 | 336 127 |
| Flat (Reid) | 510 | 440 | 240 | 346 114 |
| Star | Ref. | Ref. | ||||||
| (h:m:s) | (mas/yr) | (mas/yr) | (km/s) | (mas) | ||||
| HD 47732 | 06 40 28.6 | +09 49 04 | TYCHO2 | 1 | ||||
| HD 47777 | 06 40 42.3 | +09 39 21 | UCAC4 | 2 | ||||
| V*SMon | 06 40 58.7 | +09 53 45 | UCAC4 | 3 | ||||
| HD 47961 | 06 41 27.3 | +09 51 14 | TYCHO2 | 2 | ||||
| HD 48055 | 06 41 49.7 | +09 30 29 | UCAC4 | 4 | ||||
| HD 47662 | 06 40 13.4 | +10 26 29 | UCAC4 | 4 | ||||
| HD 47754 | 06 40 36.5 | +10 23 31 | UCAC4 | 4 | ||||
| HIP 32141 | 06 42 43.6 | +08 51 19 | UCAC4 | 5 | ||||
| HIP 32245 | 06 43 54.0 | +09 03 50 | UCAC4 | – |
| Star | Ref. | Ref. | |||||
|---|---|---|---|---|---|---|---|
| (h:m:s) | (mas/yr) | (mas/yr) | (km/s) | ||||
| Cl*NGC2264RMS1241 | 06 39 49.6 | 09 33 22 | PPMXL | 1 | |||
| Cl*NGC2264LBM677 | 06 39 56.4 | 09 43 32 | PPMXL | 1 | |||
| Cl*NGC2264LBM1207 | 06 40 01.4 | 09 31 06 | PPMXL | 1 | |||
| V*V594Mon | 06 40 23.7 | 09 55 24 | PPMXL | 1 | |||
| V*NTMon | 06 40 30.9 | 09 34 41 | PPMXL | 1 | |||
| HD261878 | 06 40 51.6 | 09 51 49 | UCAC4 | 2 | |||
| Cl*NGC2264LBM5696 | 06 41 01.1 | 09 34 52 | PPMXL | 1 | |||
| HD261938 | 06 41 01.9 | 09 52 48 | TYCHO2 | 2 | |||
| V*OQMon | 06 41 06.9 | 09 29 24 | PPMXL | 1 | |||
| V*V817Mon | 06 41 09.2 | 09 53 02 | PPMXL | 1 | |||
| Cl*NGC2264RMS3656 | 06 41 10.9 | 10 00 41 | PPMXL | 1 | |||
| V*V368Mon | 06 41 18.4 | 09 39 41 | PPMXL | 1 | |||
| Cl*NGC2264FMS502 | 06 41 41.2 | 09 32 43 | PPMXL | 1 | |||
| Cl*NGC2264LBM8851 | 06 41 48.1 | 09 42 43 | PPMXL | 1 | |||
| Cl*NGC2264DS489 | 06 41 49.0 | 09 41 06 | PPMXL | 1 | |||
| Cl*NGC2264LBM9866 | 06 41 56.4 | 09 50 06 | PPMXL | 1 | |||
| Cl*NGC2264RMS5374 | 06 42 09.2 | 09 44 03 | PPMXL | 1 |