Revealing accretion onto black holes: X-ray reflection throughout three outbursts of GX 3394
Abstract
Understanding the dynamics behind black hole state transitions and the changes they reflect in outbursts has become long-standing problem. The X-ray reflection spectrum describes the interaction between the hard X-ray source (the power-law continuum) and the cool accretion disc it illuminates, and thus permits an indirect view of how the two evolve. We present a systematic analysis of the reflection spectrum throughout three outbursts (500+ observations) of the black hole binary GX 3394, representing the largest study applying a self-consistent treatment of reflection to date. Particular attention is payed to the coincident evolution of the power-law and reflection, which can be used to determine the accretion geometry. The hard state is found to be distinctly reflection weak, however the ratio of reflection to power-law gradually increases as the source luminosity rises. In contrast the reflection is found dominate the power-law throughout most of the soft state, with increasing supremacy as the source decays. We discuss potential dynamics driving this, favouring inner disc truncation and decreasing coronal height for the hard and soft states respectively. Evolution of the ionisation parameter, power-law slope and high-energy cut-off also agree with this interpretation.
keywords:
accretion, accretion discs - black hole physics - relativistic processes - X-rays: binaries1 Introduction
The most fundamental classification of black hole X-ray binaries (BHXRBs) indicates two distinct classes: persistent and transient systems. Persistent sources are typically wind-fed by high-mass companions, allowing a consistently high accretion rate and hence modest spectral variability. The transient systems however, which have Roche-lobe filling low-mass companions, exhibit dramatic outbursts spanning as many as 8 orders of magnitude in luminosity, but ultimately spend the majority of their existence in quiescence (Remillard & McClintock, 2006; Fender & Belloni, 2012). Remarkably, almost all transients showcase more or less identical characteristic spectral and temporal evolution in outburst, and understanding the mechanisms driving this has become a key focus in astrophysics.
At the onset of an outburst the X-ray spectrum is distinctly hard, peaking in power at around 100 keV, and is well described by power-law (), hence being commonly known as the low/hard (hereafter ‘hard’) state. In bright hard states an additional soft component is also often observed (Di Salvo et al., 2001; Miller et al., 2006; Reis et al., 2010; Kolehmainen et al., 2014), usually attributed to thermal emission with a peak temperature of keV, whilst there is a high level of aperiodic variability (up to 50 %; van der Klis 2006). The dominant power-law probably arises from inverse-Compton scattering of ‘seed’ photons, supplied by the accretion disc, in a hot and optically thin ‘corona’ of electrons. Steady radio emission is also observed at GHz frequencies, associated with a steady compact jet (Fender et al., 2004) and is well correlated with the X-ray emission (Corbel et al., 2003; Gallo et al., 2003; Corbel et al., 2013a). The source spans many decades in X-ray luminosity as it rises up the hard state, but nevertheless shows little spectral evolution.
Above a few % of Ledd systems often (but not always) commence a transition to a softer X-ray state. First the source advances into the hard-intermediate state (HIMS), where now the power-law is steeper () and the thermal component has increased in both temperature and contribution (now ), resulting in a softer spectrum (see e.g. Hiemstra et al. 2011). Progressing through this state the flux continually rises whilst the integrated variability begins to decrease. Beyond the HIMS lies the soft-intermediate state (SIMS) which harbours a similar, albeit slightly softer, spectrum to the HIMS. The timing properties are however distinctly different with a fractional RMS now below 10 % (Muñoz-Darias et al., 2011). The flux has also continued to increase, and the SIMS typically marks the most luminous phase of the outburst. As the state transition occurs this also reveals contrasting radio emission, by which the jet declines but also displays dramatic flare events often two or more orders of magnitude more luminous than the steady hard state emission (see e.g. Miller-Jones et al. 2012; Brocksopp et al. 2013).
After the brief state transition (typically days) the system enters the high/soft (hereafter ‘soft’) state, dominated by thermal emission from the accretion disc, which now has an effective temperature of keV (Dunn et al., 2011). The variability lessens further (now ) whilst the Comptonised emission remains steep and relatively weak throughout. Radio emission is now undetected, and is believed to signify quenching of the jet (Russell et al., 2011). The soft state typically lasts for many months, during which there is some variation in hardness, and in some cases one or two brief excursions back into the SIMS, and even sometimes the HIMS. Throughout though the source is generally fading in flux, and upon reaching a few % in Eddington luminosity makes a state transition through the intermediate states and back into the hard state (Maccarone, 2003) where it fades further into quiescence.
The interplay between the respective soft thermal and hard Comptonised emission ultimately defines the two distinct hard and soft states. However, defining the morphology leading to state transitions and separating the two states has proven to be difficult, not least due to an insufficient physical understanding of the corona. Interpreting the role of the jet has also proven to be difficult, even though the X-ray and radio emission correlate well (Corbel et al., 2003; Gallo et al., 2003; Corbel et al., 2013a). Furthermore the base of the jet has been proposed as a source of hard X-rays (e.g. Beloborodov 1999; Markoff et al. 2005), heightening the need to understand the connection between the two.
1.1 The reflection spectrum
While photons up-scattered in the corona are observed directly as a hard power-law many will also irradiate the disc leading to a number of reprocessing features, collectively known as the reflection spectrum (see Fabian & Ross 2010 for a recent review). Fluorescent emission, as atoms de-excite after photoelectric absorption, is of highest prominence and interest in the X-ray band, and is dominated by Fe emission as a result of high abundance and fluorescent yield (which varies as the atomic number ). Early works by George & Fabian (1991) and Matt et al. (1991) performed Monte Carlo calculations of fluorescent emission resulting in estimates of equivalent widths, line strengths and angular dependance for the Fe K line. Of additional importance is electron scattering which dominates above 10 keV (photoelectric absorption dominates below this) and is observed as a peak in flux around 20–40 keV known as the Compton hump.
The surface layers of the accretion disc are likely to become ionised by the powerful irradiation arising from the corona, and has lead to many works studying the affect of ionisation upon the reflection spectrum (Ross & Fabian, 1993; Matt et al., 1993; Zycki et al., 1994; Ross et al., 1999; Nayakshin et al., 2000; Nayakshin & Kallman, 2001; Ballantyne et al., 2001; Ross & Fabian, 2005). In particular, Ross & Fabian (2005) represents the grid reflionx which is today the most widely applied reflection model, taking into account the strongest emission lines and self-consistent treatment of the continuum. More recently García & Kallman (2010) introduced xillver (see also García et al. 2011, 2013) which represents a furthering in the treatment of atomic processes, in particular making use of the photo-ionisation code xstar, and is the model applied in this study. The extent of ionisation in the surface layers of the disc is defined by the ionisation parameter , which represents the ratio of the illuminating X-ray flux with the gas density (Tarter et al., 1969; García et al., 2013). In BHXRBs lighter elements in the surface layers are expected to be fully stripped by the ionising power of the disc, resulting in a high albedo and values of (Ross & Fabian, 1993; Zycki et al., 1994). This effect also leads to effective Fe emission, since the fully ionised lighter elements are not able to absorb the emitted Fe photons (Matt et al., 1993).
As it is inherently dependant upon the geometry of the corona producing the photons and the disc intercepting them, the reflection spectrum presents the opportunity to infer changes in the two components in comparison to their own specific emission.
1.2 GX 3394 and this study
GX 3394 is a BHXRB (Hynes et al., 2003; Muñoz-Darias et al., 2008) and one of the most active transient systems, exhibiting numerous outbursts since its discovery (Markert et al., 1973), including four complete cycles (with state-changes) in the past twelve years. As a result, GX 3394 is one of the most studied transient systems and over the lifetime of RXTE111Rossi X-ray Timing Explorer (1995–2012) an extensive archive of data has been amassed, allowing an unparalleled timeline to investigate source variability with the same mission. To this end it has formed the basis of many important works key to our understanding of BHXRBs (see e.g. Belloni et al. 2005; Dunn et al. 2010; Corbel et al. 2013a and references therein). Restricting to periods where both the Proportional Counter Array (PCA; Jahoda et al. 2006) and High Energy X-ray Timing Experiment (HEXTE; Rothschild et al. 1998) instruments were active this presents three fully sampled outbursts to analyse.
In addition GX 3394 is the best monitored BHXRB in the radio band, allowing a unique insight into the outburst nature of transient systems. In this study we examine how the X-ray reflection evolves throughout these three outbursts, presenting one of the most extensive and detailed studies to date of reflection in BHXRBs. We begin by outlining our data reduction strategy in §, followed by details of the model applied to the observations and our automated fitting procedure in §3. We then present the results of the study in §4 and then outline and discuss our favoured interpretations in §5.
2 Observations and Data Reduction
We performed spectral analysis using data from the PCA and the HEXTE onboard RXTE. The data were reduced using HEASOFT software package v6.13 following the standard steps described in the (RXTE) data reduction cookbook222http://heasarc.gsfc.nasa.gov/docs/xte/data_analysis.html. We extracted PCA spectra from the top layer of the Proportional Counter Unit (PCU) 2 which is the best calibrated detector out of the five PCUs, although we added a systematic uncertainty of 0.5 % to all spectral channels to account for any calibration uncertainties. We produced the associated response matrix and modelled the background to create background spectra.
For HEXTE, we produced a response matrix and applied the necessary dead-time correction. The HEXTE background is measured throughout the observation by alternating between the source and background fields every 32s. The data from the background regions were then merged. When possible we used data from both detector A and B to extract source and background spectra. However, from 2005 December, due to problems in the rocking motion of Cluster A, we extracted spectra from Cluster B only. HEXTE channels were grouped by four. The variability analysis (i.e. the RMS-Intensity diagrams) was performed using event modes or a combination of single-bit modes depending on the case.
| Outburst | Start (MJD) | End (MJD) | Total Observations (Exposure) |
|---|---|---|---|
| 2002 | 52367 | 52784 | 133 (300 ks) |
| 2004 | 53044 | 53514 | 202 (465 ks) |
| 2007 | 53769 | 54379 | 193 (357 ks) |
| Total | 528 (1122 ks) |
3 Fitting method
There are two significant reasons we have used archival RXTE observations for this study. Firstly, the PCA (3–50 keV) and HEXTE (25–200 keV) instruments provide an outstanding spectral bandpass. Although the Fe K line is the prominent feature of X-ray reflection, it is ultimately just a fraction of the overall signal. When looking for subtle effects, such as those due to strong gravity, the line profile is a very revealing signature. However the poor spectral resolution of the PCA ( keV at keV) renders it insufficient to attempt precise constraints on parameters such as black hole spin. However, the large bandpass and effective area allows us to study a much larger fraction of reflection spectrum, including important signatures such as the Compton hump and Fe edge, which characterise emission over a much larger range. As a result of this, RXTE offers an alternative and complementary view to high-resolution missions such as XMM-Newton, which are restricted to the 0.3–10 keV band.
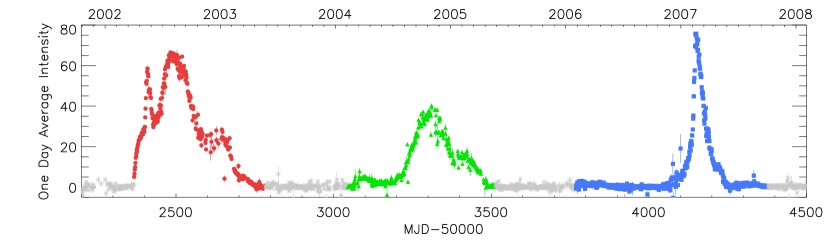
This leads on to the second significant rationale, which is the unprecedented number of observations that RXTE offers. In a recent study of the hard state of GX 3394 limited to high-resolution XMM-Newton and Suzaku spectra, Plant et al. (2013) were restricted to just four observations, whereas the sampling of the hard state in this investigation amounts to nearly 350 observations. In total this study makes use of more than 500 observations, totalling over Ms of PCA exposure time, allowing one of the most detailed investigations to date of how the reflection spectrum is evolving throughout an outburst (Table 1 and Figure 2). In particular, such high cadence enables a scrupulous analysis of state transitions, which are typically completed within one week.
3.1 Our adopted model
Many attempts have been made to quantify how X-ray reflection evolves in BHXRBs, but often they have employed phenomenological models focusing upon the Fe K region. Dunn et al. (2008) fitted the Fe K emission with a single gaussian line fixed at 6.4 keV, while Rossi et al. (2005) applied relativistic broadened emission (laor; Laor 1991) with a smeared edge (smedge; Ebisawa et al. 1994). Both offer a useful diagnostic of the reflection, however they only account for a small fraction of the full reflection signal. Furthermore while the latter may offer a more physical interpretation of the Fe K line, the two components are still not physically linked. Ultimately, to fully understand how the reflection component is evolving one must apply a model where all the signatures are physically linked and accounted for. Motivated by this, Reis et al. (2013) recently applied the blurred reflection model kdblur*reflionx (Laor, 1991; Ross & Fabian, 2005) to an outburst of XTE J1650-500. Although this presented a significant improvement to previous works, it only focuses upon one outburst of one source. Here we apply an angle-dependent version of the reflection model xillver (García & Kallman, 2010; García et al., 2011), known as xillver-a (García et al., 2013), to a much larger sample (Table 1). This model offers a significant improvement in the treatment of atomic processes over the more widely used reflionx, and in addition includes larger grid for the photon index and ionisation parameters (see García et al. 2013 for a comparison). It should be noted that reflionx represents an angle-averaged solution, hence neglecting the important effect of inclination in the observed reflection spectrum (see e.g. Magdziarz & Zdziarski, 1995; Matt et al., 1996; García et al., 2014).
We account for interstellar absorption using the model phabs with a NH fixed at cm-2, given that the hydrogen column density towards GX 3394 is well resolved to be within the range (0.4–0.6) cm-2 (Kong et al., 2000). Since the low-energy cut-off of the PCA is at keV the ability to constrain the column freely is severely reduced and we also note that the effect of this moderate column above keV is small.
The remaining continuum is characterised by a combination of a multi-colour blackbody (diskbb; Mitsuda et al. 1984) and Comptonised seed photons (cutoffpl). Recently it has been shown by Muñoz-Darias et al. (2013) that relativistic effects can strongly affect how we interpret the thermal emission. However such impact is fairly weak at the low-moderate inclination GX 3394 is expected to have (Muñoz-Darias et al. 2013 classify GX 3394 as a ‘low inclination’ source), hence diskbb should describe the thermal accretion disc emission sufficiently well. We model the Comptonised emission as a simple power-law with an exponential cut-off. While more physical Comptonisation models exist, they ultimately bring with them further complexity in fitting the data at hand, and is beyond the scope of this study focusing upon reflection.
Another important consideration is the consistency between the continuum we resolve and the spectral energy distribution assumed in the reflection model. The illuminating spectrum used in xillver-a assumes a power-law with a high-energy cut-off at keV, making cutoffpl the best Comptonisation model to maintain consistency and allowing an accurate determination of relative flux levels. When a smaller cut-off is required we switch to a solution of xillver-a including a variable cut-off for the illuminating spectrum, linking the cut-off in the Comptonisation and reflection models. xillver-a also includes a low-energy cut-off at 0.1 keV to prevent the input spectrum being unphysically over-populated with low-energy photons. It should be noted though that the reflection spectrum will also be influenced by photons emitted in the disc (Ross & Fabian, 1993, 2007), and this is not currently accounted for by xillver-a, nor is it in any other publicly available reflection model333Note: The model rfxconv (Done & Gierliński, 2006; Kolehmainen et al., 2011) can accept any input continuum, including that of a disc, which we discuss in §5.3. Finally, we also apply the convolution model relconv (Dauser et al., 2010) to account for any relativistic effects. Thus our base model applied to each observation is:
phabs(diskbb + cutoffpl + relconvxillver-a)
| Model | Parameter | Value | Min | Max |
| phabs | NH () | 0.5 | ||
| diskbb | Tin | 0.5 | 0.1 | 2 |
| ND | 1000 | 0 | 1e+10 | |
| cutoffpl | 2 | 1.2 | 3.4 | |
| Ec | 50 | 10 | 300 | |
| relconv | (∘) | 45 | ||
| rin (rg) | 10 | 6 | 1000 | |
| rout (rg) | 1000 | |||
| 3 | ||||
| 0 | ||||
| xillver-a | 2.5 | 1 | 4.5 | |
| (∘) | 45 |
3.2 The fitting procedure
By definition transient BHXRBs spend the majority of their lifetime in a quiescent state. GX 3394 is somewhat an exception to this being one most active of all the transient systems, exhibiting four complete outbursts in the past twelve years. Nevertheless, observations during periods of inactivity, or not reaching sufficient statistics through low count rates and short exposures, will require removal. For an observation to be considered we require a PCA pointing with at least 1000 background subtracted counts. We ignore all data below 3 keV (channels ) and above 50 keV (channels ), however the regions keV and keV must have a minimum of 100 and 50 background subtracted counts respectively to be included. Furthermore these must amount to at least 10% of the total counts registered in that region.
Signatures of the reflection spectrum at hard X-ray energies, such as the Compton hump, offer a large signal in addition to the Fe K line. Additionally, the reflection remains strong at high energies allowing greater constraint. This hence underlines why we take such an approach to the upper-energy threshold of the PCA and a similar criteria is therefore applied to the HEXTE to ensure adequate data quality. We require that the combined HEXTE A and B cluster units, if both available (see §2), have a minimum of 1000 background subtracted counts. If this is not the case then the observation is ignored regardless of the merit of the PCA. We fix the lower energy limit to be 25 keV and allow the upper bound to be 200 keV, however this is truncated to 100 keV should there be less than 100 background subtracted counts above this threshold.
In the hard and some hard-intermediate states, fitting the disc was problematic due to the low-energy cut-off of the PCA. Thermal emission from the disc in the hard state has been uncovered in many sources using instruments extending to softer energies (<1 keV; see e.g. Di Salvo et al. 2001; McClintock et al. 2001; Kolehmainen et al. 2014), however the signal above 3 keV is not sufficient to constrain the diskbb parameters. For this reason if T keV then diskbb is removed to ensure the analysis is reliable. In such cases the model is likely to be fitting some slight curvature in the Comptonised continuum or having a negligible effect. We also remove discs with T keV since temperatures are not expected to reach such levels, especially for a low inclination source (see e.g. Dunn et al. 2011; Muñoz-Darias et al. 2013), and hence suggests a erroneous fit. Additionally the normalisation value must exceed 50 to flag any severe degeneracy with the disc temperature, and should it be below this value then the disc model is removed. We note that normalisation is of the order in the soft state, where the disc is expected to be at the innermost stable circular orbit (ISCO), and should hence represent the lowest values in the outburst. These criteria do not affect the soft and soft-intermediate state observations, all of which retain the disc model within this criteria.
One of the free parameters of the reflection model xillver-a is the photon index of the source illuminating the ionised slab (i.e. the accretion disc), of which the tabulated range is 1.2–3.4. We link this parameter to the cutoffpl photon index to keep the two components self-consistent using the tabulated range as the hard limits. Previous studies of BHXRBs suggest this range should be sufficient, however it is another motivation for us using xillver-a instead of reflionx, which offers a smaller grid of 1.4–3.3. The high energy cut-off (Ec) is allowed to be free within the range to keV, however if the parameter reaches < keV or > keV the cut-off is fixed at keV for the remainder of the analysis. This prevents any erroneous fits and maintains consistency with the assumed illuminating spectrum in the standard version of xillver-a. Only in the bright states of the hard state is a smaller high energy cut-off required, hence during this period we switch to a larger grid of xillver-a which includes the high energy cut-off of the illuminating spectrum as a fitted parameter. In this case the parameter is linked between the cutoffpl and xillver-a models to maintain consistency. We note that the values and evolution of the high energy cut-off are consistent with that found by Motta et al. (2009; see Figure 6 and §4.1 later in this paper).
The other key parameters in xillver-a are the ionisation parameter, (where is the total illuminating flux in the 1-1000 Ry energy band and the electron number density; Tarter et al. 1969; García et al. 2013), the iron abundance (which we assume to be solar), and the inclination angle of the source. The ionisation parameter is fitted within the range (1.0–4.5) and a fixed inclination of 45∘ is applied. To date there is no precise measurement of the inclination of GX 3394, however a value lower than appears unfeasible given that it will result in BH mass of M☉ (assuming the constraints reported in Hynes et al. 2003 and Muñoz-Darias et al. 2008). The value of 45∘ is consistent with the findings of Plant et al. (2013) through the reflection method and the lack of evidence for a accretion disc wind, which are visible only in high inclination sources (; Ponti et al. 2012). Also, we note that dips and eclipses have never been detected from GX 3394.
The relativistic effects are modelled using relconv, for which the emissivity index , defined as R-α where R is the disc radius, is fixed to be 3. While the spectral resolution of the PCA ( keV at keV) allows moderately broad lines to be detected, the more subtle effects of the emissivity profile cannot be resolved, thus the Newtonian value of 3 is reasonable assumption for this study. We do however allow the inner radius to be fitted freely from the ISCO (6 rg) up to the largest tabulated value of 1000 rg. The outer radius of the disc is fixed to be 1000 rg and the black hole is assumed to have zero spin. The effect of the latter is rather trivial given the resolution of the PCA and is nevertheless not a significant concern given that the relativistic effects are not the main focus of this study. Finally the inclination is fixed at 45∘ to be consistent with the reflection model.
Comparing relative flux levels can be hampered by the chosen energy band, hence all fluxes are extrapolated using cflux and fitted in the 0.1–1000 keV band unless otherwise stated. As an example, Comptonised photons reprocessed in the cool disc may be down-scattered to energies below the RXTE bandpass, hence extrapolating the fit ensures that the truest extent of the spectrum is being measured. The lower limit is chosen to ensure that there is not an unphysical over-population of photons in the cut-off power-law model, which is particularly a problem when the photon index is large (). The illuminating spectrum in the reflection model also assumes a low-energy cut-off of 0.1 keV to tackle this problem, hence we are therefore keeping the two models consistent by imposing this limit.
To deal with such a vast dataset we fit each observation through an automated routine, therefore Table 2 lists the input parameter values applied to our adopted model. Throughout the investigation we use XSPEC version 12.8.0 and all quoted errors are at the 90% confidence level unless otherwise stated. Throughout the study we apply fiducial values of and 10 and 8 kpc for the black hole mass and distance to GX 3394 respectively.
3.3 Defining spectral states
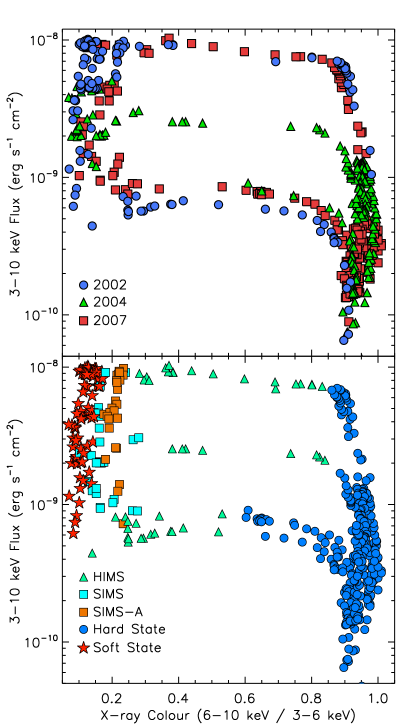
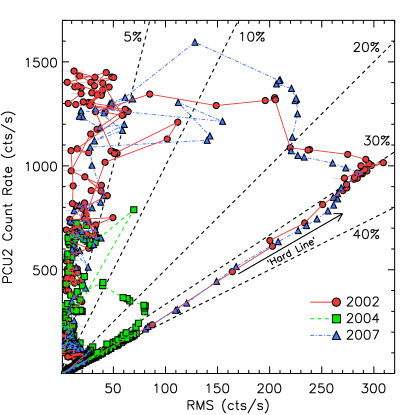
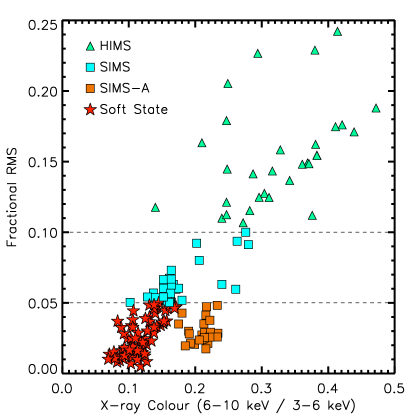
In order to separate each observation into spectral states we use a combination of timing and spectral characteristics. While the hard and soft states are easily discernible via their spectra in the PCA bandpass, the intermediate periods are qualitatively alike. Muñoz-Darias et al. (2011) studied the relation between the RMS amplitude of the variability and flux (Figure 3), uncovering marked changes in the transition between states in the three outbursts of GX 3394 used in this study. The rising hard state follows a distinctive ‘hard track’ of increasing RMS and flux, with a fraction RMS of 30–40 %. Transition into the HIMS occurs as the RMS lessens whilst the flux continues to rise. A further significant decrease in RMS marks the SIMS, which we define as the region 10 % fractional RMS.
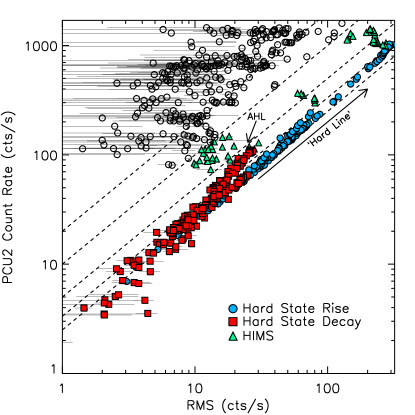
The soft-state is characterised again by a sudden decrease in RMS, and defined here by a fractional RMS of 5 %. However there exists a group of harder observations (X-ray colour 0.175; Figure 4) at low variability. We note as well that these points lie typically at a slightly higher fractional RMS than the least variable soft-state points. The state classification for these observations is not straight forward since they share properties associated to both SIMS and soft state (see e.g. Belloni et al., 2005, 2011). Nevertheless, we define these points as SIMS-A since many show type-A quasi-periodic oscillations (QPOs), which is in contrast to the normal SIMS (5 RMS 10) where type-B oscillations are observed (Motta et al., 2011). Interestingly the SIMS-A lie off the standard luminosity-temperature relation established by the soft state (§4.4.2). We do note however that the 5 % line separating the soft and SIMS should be taken with caution since, for example, fast transitions occurs as this stage of the outburst, leading to hybrid observations (Muñoz-Darias et al., 2011). To determine the HIMS to hard state transition we use ’adjacent hard line’ (AHL) described in Muñoz-Darias et al. (2011), whereby the decay phase of the hard state displays a clear track in the RMS-intensity diagram. This is indicated by the red circles in the lower plot of Figure 3. The transition is not so clear if one attempts to determine it by X-ray colour (Figure 2), and thus demonstrates the importance of timing characteristics in determining the state of the system.
4 Analysis and results
4.1 The Comptonised emission
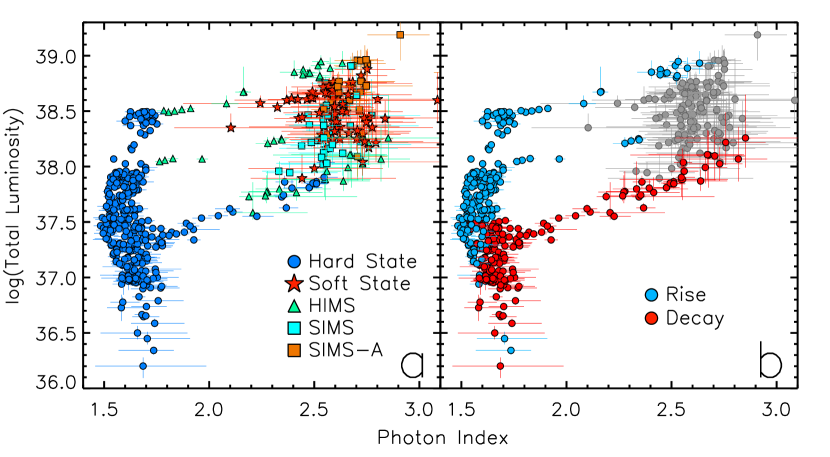
In Figure 5 we display how the photon index evolves with the total unabsorbed luminosity. The shape is remarkably similar to the HID (Figure 2) and indicates well how the hardness of the X-ray spectrum is not solely due to the influence of the thermal emission from the accretion disc. The blue points in Figure 5a mark the hard state whereby mainly lies in a narrow range of 1.5–1.7, and appears to remain rather constant despite the hard state spanning over two orders of magnitude in luminosity. However, Figure 5b separates the periods of rise (blue) and decay (red) and displays quite clearly that above tends to become softer as the source rises up the hard track, consistent with an increase in seed photons to cool the corona (see Done et al. 2007 and references therein). Furthermore as the source reaches the hard state in decay the photon index is clearly softer than the rise at that luminosity, appearing to retain a softer slope towards quiescence (although see also Stiele et al. 2011).
During the state transition the photon index undergoes very distinct softening, eventually reaching . In fact the bulk of the evolution appears to take place in the HIMS, rather than the SIMS, which itself is consistent with the values recorded in the soft state. The soft state shows some scatter (2.4–2.9), but is ultimately dominated by large confidence intervals due to the diminished signal in the hard band. The SIMS-A are also typically steeper than the SIMS (see also Table 4). The decay phase (Figure 5b) displays clear hardening as the source makes its way through the soft-hard transition. In Figure 5 we plot against the total luminosity calculated between 0.1 and 1000 keV which accounts for the non-negligible disc flux below 3 keV, therefore displaying the source decay through the transition not so apparent in the 3–10 keV HID (Figure 2). This then serves to exhibit clearly how the source hardens monotonically with luminosity towards the hard state.
Throughout our investigation, we model the Comptonised emission with a cut-off power-law fixed at 300 keV, in order to remain consistent with the assumed illuminating spectrum in the reflection model (García et al., 2013). However, as part of our routine, we initially allow the high energy cut-off to be a free parameter as it has been shown to be significantly lower in the brighter phases of the hard state and subsequent transition (Motta et al., 2009). We allow the cut-off to be free within the range 10 to 300 keV, however should it converge on a value lower than 15 keV or higher than 250 keV respectively we deem the fit to be erroneous and fix the parameter to be 300 keV.
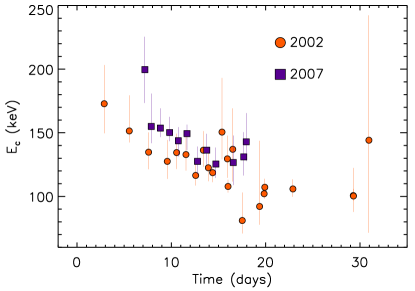
In Figure 6 we plot the time-evolution of the high energy cut-off in the 2002 and 2007 outbursts. No cut-off was resolved in any of the 2004 observations, however the transition luminosity in this outburst was lower than any of the 2002 and 2007 observations which did. Time-zero in Figure 6 marks the first observation where the cut-off was determined freely and displays a gradual decrease in energy as the source continues its rise through the hard state. All observations intermediate to the respective first and last resolved observation in Figure 6 were able to fit the parameter freely. Furthermore, for both outbursts, the final three observations resolving the cut-off took place in the HIMS, confirming this trend continues into the state transition. The high energy cut-off is thought to represent the temperature of the electrons in the corona, hence meaning the power-law emission symbolises thermal Comptonisation. The softening of the photon index and decreasing high energy cut-off are both consistent with increasing amounts of seed photons cooling the corona.
The trend we find is very consistent with that found by Motta et al. (2009) using the same datasets, however they resolve the cut-off over a longer period than us all the way into the soft state. In this study we are more focused on the reflection, hence to maintain a reasonable timescale for our routine we do not apply such a stringent and detailed criteria for detecting the cut-off, hence we refer the interested reader to the work of Motta et al. (2009) for an more in depth study of the cut-off.
4.2 The reflection fraction ()
The illumination of the disc by Compton up-scattered photons gives rise to the reflection spectrum, thus one would expect the two components to follow a relatively linear relationship. As an example, increasing the total of Comptonised photons by a factor of two should lead to the same doubling of the power-law flux we observe, and that irradiates the disc, assuming the geometry remains constant. Therefore in such a case the reflected emission will double as well. Ultimately the situation is not that simple as the surface layers of the disc will also respond to the change, for example by becoming more ionised which may in turn affect the albedo (but see §4.5). Nevertheless it serves as a useful example of how the power-law and reflected emission should evolve somewhat identically if the accretion geometry does not vary. Alternatively, if the two components do not evolve in a one-to-one manner then there is a considerable chance that the geometry is changing. Thus observing how these two components evolve together presents a very powerful diagnostic to reveal the underlying accretion dynamics in outburst.
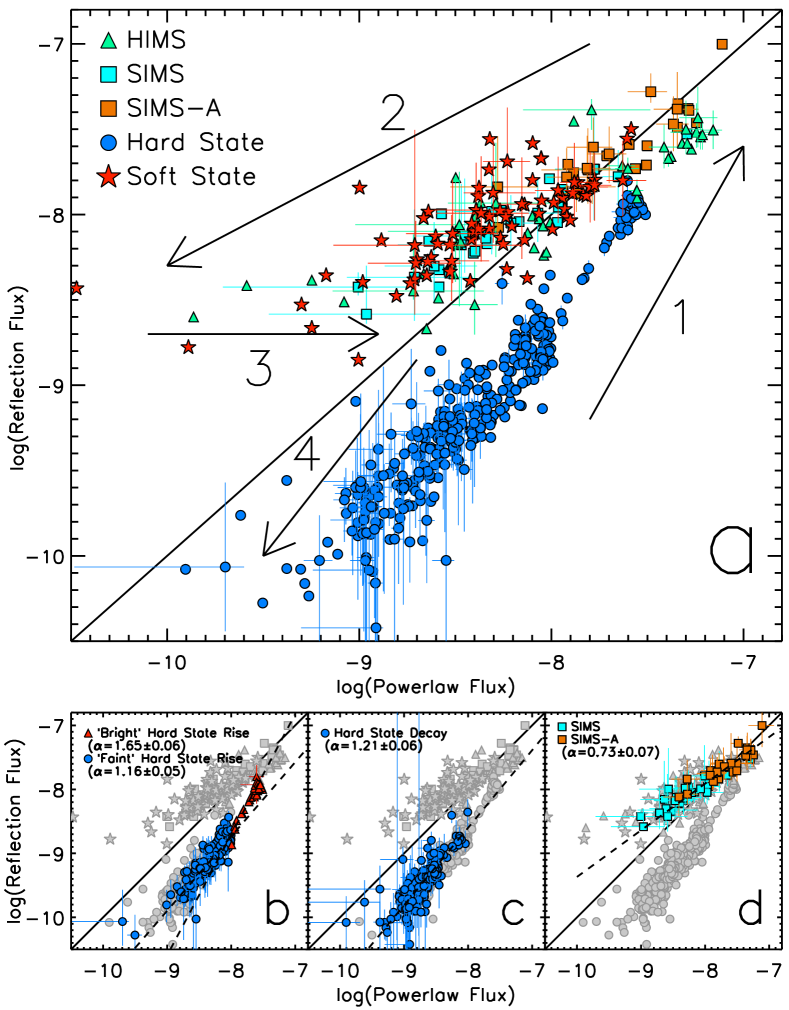
We find that indeed the power-law and reflection are very well correlated, forming strong positive correlations throughout each spectral state (Table 3). Here we define the reflection fraction (RF) as the ratio of the reflection to the Comptonised flux, such that corresponds to an equal quota of both components. Figure 7 details the evolution of the two elements throughout the three outbursts studied, with the five principle states colour-coded. The hard state (blue circles) lies exclusively below the solid line indicating , thus the hard state Comptonised flux always dominates the reflection. The fitted slope to the rising hard track is , however it indicates two distinct regions hence we instead separate the rising hard state into observations above and below a power-law flux of erg s-1cm-2 (Figure 7b). At lower luminosities (‘faint hard state’) the slope is , thus signifying a gradually increasing reflection fraction as the total source flux rises. Here the mean reflection fraction is 0.2. The track of the ‘bright hard state’ is much steeper () marking a clear furthering in how the rate of the reflection fraction is increasing, which reaches values up to 0.6. We note that whilst this is coincident with the period where the high energy cut-off is fitted below keV (§4.1), this should not be behind this effect as the reflection spectrum includes the same cut-off in the illuminating spectrum it is calculated from. In addition we fit the decay phase of the hard state as the source returns to quiescence (Figure 7c), for which the slope is consistent with the ‘faint’ regime of the rise ( vs ), thus suggesting that the underlying changes responsible for the evolution in the reflection fraction are consistent whether the source is at the onset or end of the outburst. To summarise, we find that there is a substantial increase in the reflection fraction as the overall source flux rises, although it remains less than one throughout the hard state. In addition, the correlates better with the reflection component, rather than the Comptonised one, suggesting changes in the former are more behind the evolution of the (Table 3).
| Spearman’s Rank Correlations For Various Fitted Parameters | |||||||||||
| Hard State | HIMS | SIMS | SIMS-A | Soft State | |||||||
| Parameter 1 | Parameter 2 | -value | -value | -value | -value | -value | |||||
| 0.938 | 0 | 0.871 | 3.88 | 0.916 | 4.90 | 0.900 | 4.17 | 0.735 | 1.31 | ||
| … | … | 0.710⋆ | 1.82⋆ | 0.694 | 1.52 | 0.839 | 8.40 | 0.474 | 1.04 | ||
| … | … | 0.731⋆ | 6.02⋆ | 0.601 | 3.52 | 0.653 | 3.02 | 0.438 | 5.43 | ||
| … | … | 0.528⋆ | 1.12⋆ | 0.701 | 1.13 | 0.825 | 2.17 | 0.361 | 1.07 | ||
| 0.375 | 5.73 | 0.835 | 5.64 | 0.855 | 8.94 | 0.688 | 1.04 | 0.765 | 2.30 | ||
| 0.637 | 1.01 | 0.498 | 4.35 | 0.621 | 1.96 | 0.366 | 6.58 | 0.190 | 9.32 | ||
⋆Calculated using only observations requiring a disc model.
The HIMS points (green triangles) are situated almost entirely at larger RF than those of the hard state. Furthermore they are typically close to . There are however two clusters of points from the hard-soft branch due to the lower flux of the transition in the 2004 outburst. The soft-hard branch (S erg s-1cm-2) leads gradually but directly onto the hard track suggesting that the process in decay is progressive rather than sudden. The SIMS(-A) points lie at larger RF to the HIMS in the hard-soft transition (those at higher fluxes), continuing the general rise observed so far throughout the states (see also Table 4). The soft state itself is almost entirely consistent with a , meaning that the reflection is now dominant over the Comptonised component. There is however a lot of scatter, and large confidence limits due to the customary reduced signal in the hard band, thus the slope of the soft state decay can only be fitted when the 2002 outburst is excluded, but nevertheless this confirms that the increases as the source decays (). The soft state also tends to show significant variations in variability and spectral hardness throughout its decay (see Figures 2 and 3) and thus makes several forays into the SIMS and SIMS-A between state transitions. The best-fit to the SIMS and SIMS-A observations yields a slope of (Figure 7d) representing an furthering of the domination by the reflection component over the Comptonised emission as the source decays, consistent with the evolution of the reflection and power-law in the soft state. Throughout the soft and soft-intermediate states the correlates best with the Comptonised component, suggesting that it is mainly responsible for the increasing in decay (Table 3). The is a proxy for the EW of the Fe line, hence this agrees with the soft-state X-ray Baldwin effect previously reported in GX 3394 (Dunn et al. 2008; see also Baldwin 1977).
4.3 Contrasting emission in spectral states
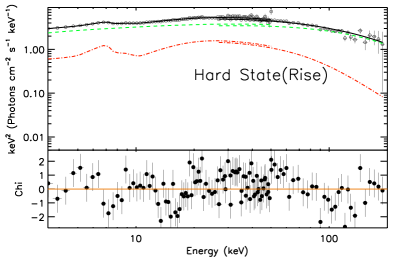
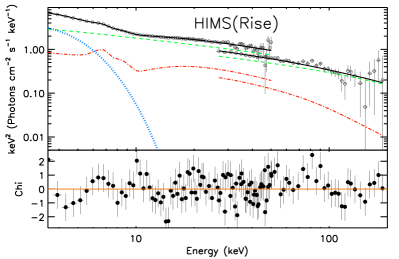

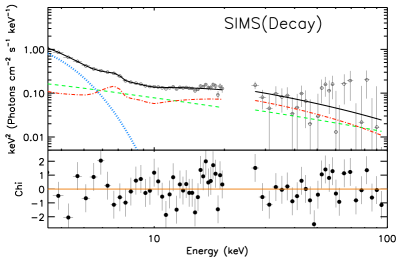
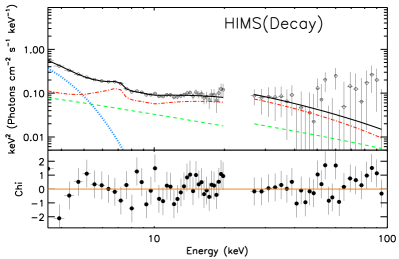
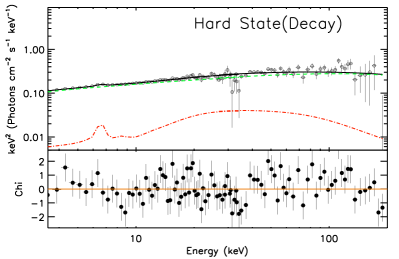
In Figure 8 we display how the X-ray spectrum evolves throughout each spectral state, whilst in Table 4 we calculate the mean parameter value accordingly. In the rising hard state a disc model is never required, whilst the Comptonised emission is hard and clearly the dominant source of emission. The Fe line profile is often narrow and the high-energy cutoff is clearly visible in the plotted spectrum. Transition to the HIMS marks increases in the power-law slope, ionisation parameter and reflection fraction. Thermal emission from the disc is now clearly present, however it remains the weaker of the three spectral components and only dominates below keV.
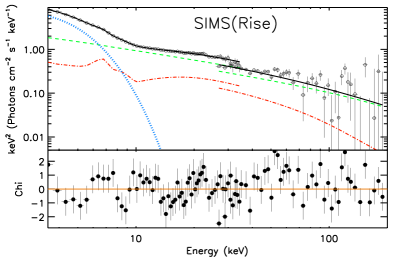
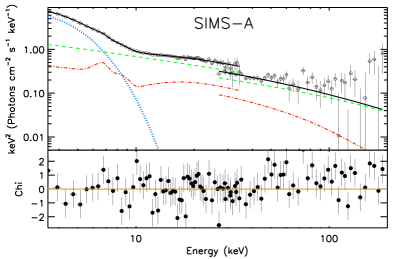
Into the SIMS there is a distinct softening, in part due to a further increase of . The disc is now much stronger, dominating up to 6–7 keV, and is the largest source of emission. A broad Fe line is now regularly observed and the ionisation stage is considerably higher than in the hard state. In addition reflection and Comptonised emission are roughly equal. The SIMS-A is only subtly different from the SIMS, the most marked difference being a slightly softer (see also Figure 5). Typically the total flux is larger, in fact the SIMS-A represents the peak luminosity for two of the three outbursts in this study. Table 4 suggests that this increase is due to greater flux from the power-law and reflection rather than the disc (see also Figure 7d to compare power-law and reflection flux between the SIMS and SIMS-A).
| Mean Parameter Value Per Spectral State | ||||||||
| Parameter | HS(Rise) | HIMS(Rise) | SIMS(Rise) | SIMS-A | HSS | SIMS(Decay) | HIMS(Decay) | HS(Decay) |
| Tin | … | … | ||||||
| ND | … | … | ||||||
| rin (rg)† | ||||||||
| Mean Model Luminosity ( erg s-1) | ||||||||
| Power-law | ||||||||
| Reflection | ||||||||
| Disc | … | … | ||||||
The parameter ND is the normalisation of the diskbb model.
⋆Calculated using only observations requiring a disc model.
‡Calculated from the reflection component.
The soft state represents the relative peak of the thermal disc emission which now dominates the spectrum up to 10 keV. The reflection flux is significantly larger than that of the power-law, which itself decreases substantially as the source decays. Regardless of this, the disc inner radius is often poorly resolved, which we discuss in the next section. As the source decays through the intermediate states the spectral characteristics are similar to the rise, albeit at a lower luminosity. The cooler disc does however contribute a much larger portion to the overall flux, and the reflection fraction is typically larger. The ionisation stage remains relatively unchanged, and the inner radius is once again well resolved. Finally the decay phase of the hard state is much like the rise, described by a hard spectrum and a return to a low reflection fraction and ionisation.
4.4 The disc inner radius and the ISCO
4.4.1 The inner radius from reflection
The disc inner radius is poorly determined (a larger error) in the hard state, which is likely due to the reduced signal of Fe line in low reflection fractions. At this stage of the outburst the line is also expected to be narrow (Plant et al. 2013; Kolehmainen et al. 2014; but see also Reis et al. 2010), hence making limits on the relativistic broadening difficult with the energy resolution of the PCA ( keV at keV).
The inner radius is also poorly resolved in the soft state, which is likely to be due to a combination of factors. Firstly, whilst the soft state has a high reflection fraction this only describes the ratio of the reflected and Comptonised emission, and hence does not necessarily mean the reflection is dominating the spectrum. In Figure 8 is can be seen that even at 6 keV the disc flux is significantly larger than the reflection flux, and simply saturates the signal of the Fe emission. Furthermore, since the disc is likely to be at the ISCO in the soft state the Fe profile will be very broad and hence smeared into the continuum. In addition, since the three spectral components are at similar flux levels in the soft state, subtle changes can easily broaden or narrow a weak Fe profile, resulting in the large scatter of inner radii recorded. Recently Kolehmainen et al. (2011) showed that even with the spectral-resolution of XMM-Newton the width of the Fe can be strongly affected by the continuum, and urge caution in measuring the inner disc radius in the soft state. Our ability to resolve the inner radius is certainly hampered by the resolution of RXTE and susceptible to model degeneracy. Despite this, we note that the reflection spectrum is still well constrained because of the large bandpass above 7 keV.
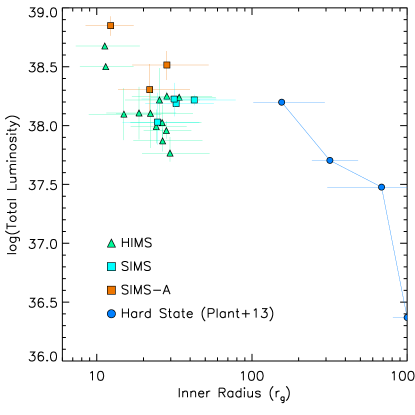
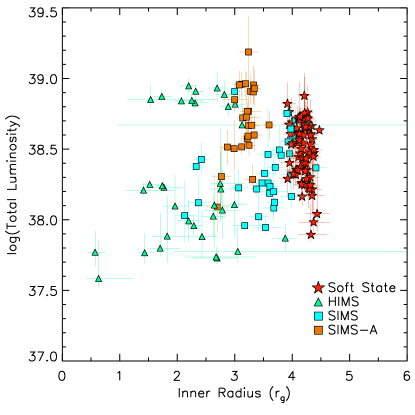
There is much less scatter in the inner radius fitted during the HIMS and SIMS(-A), both in rise and decay, suggesting that the parameter is being well resolved. Furthermore the mean value is similar throughout (30–50 ; Table 4) which would indicate that there is no significant change in the disc through these states. The inner radius is known to be very degenerate with the inclination, which is unknown for GX 3394, thus we can not rule out that the inner radius is smaller and represents the ISCO. However, the assumed inclination is very similar to that fitted by Plant et al. (2013) in a study of the hard state of GX 3394 with XMM-Newton and Suzaku allowing a direct comparison. In Figure 9 we plot the fitted inner radius against source luminosity using only well constrained values (limits less than the parameter value) and include the values found in Plant et al. (2013). Clearly the HIMS and SIMS(-A) are associated with a inner disc closer to the black hole during the intermediate states, while this figure again indicates the consistent radii recorded throughout this stage. To compare, the inner radius derived from the normalisation of the diskbb model is in the soft state for the same inclination (§4.4.3).
4.4.2 The luminosity-temperature relation
The soft thermal component is associated with a geometrically thin, optically thick accretion disc (Shakura & Sunyaev, 1973). Under the assumption that the energy released by the disc thermalises, and is emitted locally, the component can be fit as a sum of blackbody spectra from each radius, R. Towards smaller radii the emitting area decreases, whilst the luminosity increases, thus leading to an increase in the characteristic temperature (R). The peak temperature occurs close to the ISCO.
The model we use to fit the thermal component is diskbb (Mitsuda et al., 1984), which is parameterised by the apparent inner radius of the disc and the peak temperature . The bolometric disc luminosity is thus defined as , where is the Stefan-Boltzmann constant (Done et al., 2007). However, there are a number of corrections required to determine the effective peak temperature, two being the boundary condition (Gierliński et al., 1999) and relativistic corrections (Zhang et al., 1997), although for a stable inner radius both should remain constant. The spectrum will also be modified by the opacity of this disc, which requires a colour-correction factor of 1.6–2.0 (Shimura & Takahara, 1995; Merloni et al., 2000; Davis et al., 2005). Assuming there is no variation in we can therefore test whether the inner radius is constant by assessing whether the expected relation is satisfied.
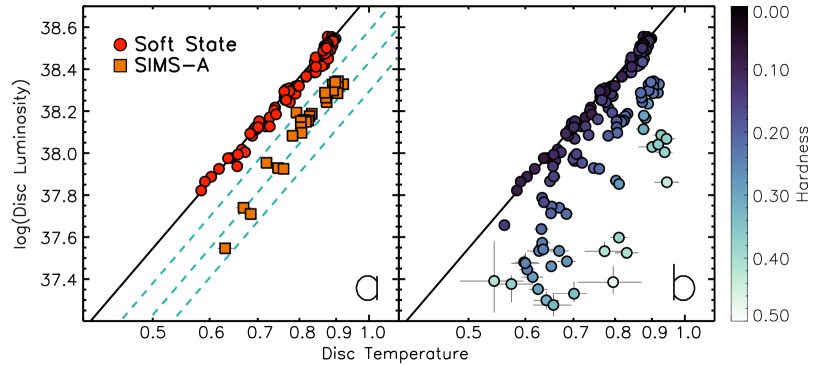
In Figure 10 we plot the observed bolometric disc luminosity versus the inner disc temperature for observations with an X-ray colour () less than 0.5. Throughout all the states this corresponds to of the observations used in this study. Figure 10a plots the soft state and SIMS-A observations (red and orange respectively) with the solid line representing the expected relation and normalised to coincide with the soft state points, displaying a good match (fitted relation: ). The SIMS-A observations also appear to follow a similar, albeit marginally steeper, slope (fitted relation: ), however they lie on a different plane corresponding to a higher temperature or lower luminosity. The standard SIMS observations fit and even steeper slope of 5.640.19
We investigated the observations coeval to the SIMS-A and found that generally a combination of both factors led to the change. Since this would in either case require a reduction in the inner radius of the disc, a process that is unlikely given that the soft state is expected to represent the innermost stable circular orbit being reached (see also Dunn et al. 2011). Furthermore Figure 10b displays each observation by X-ray colour indicating that there is a trend with spectral hardness which continues even into the hard state. A more likely scenario is an increasing hence the dotted lines in Figure 10a represent factors 1.1, 1.2 and 1.3 times larger, making the SIMS-A consistent with a moderate modification (see also Dunn et al. 2011). Curiously however we note that the power-law emission is consistently larger and the reflection fraction generally weaker than the soft state (Figure 7), even though the SIMS-A observations are distributed fairly evenly among the range of luminosity the soft state exhibits (Figure 2). We examine the SIMS-A further in the discussion (§5.2).
4.4.3 The inner radius from the disc normalisation
The disc inner radius can also be calculated from the normalisation of the diskbb model (ND):
| (1) |
In Figure 11 we plot the inferred disc inner radius versus the total source luminosity. In the soft state the inner radius is very stable (), however, much like the L–T4 relation, the inner radius appears to be smaller in the intermediate states (see also Dunn et al. 2011). The SIMS-A points are also consistent with a stable radius, the mean of which is a factor of 1.3 smaller than the soft state, similar to the difference seen in the L–T4 relation (Figure 10). Again, assuming the soft state represents the ISCO, we expect this is due to an increase in the spectral hardening factor rather than the SIMS-A representing a decrease of the inner disc radius. The smaller inner radius may also be an effect of strong Comptonisation not being accounted for (e.g. Kubota & Makishima 2004) and we discuss this further in §5.2.
At face value the inner disc radii calculated from the reflection and the disc normalisation disagree, the latter recorded as being considerably smaller. However there are a number of factors that need to be considered. The disc inner radius linearly depends on both the mass of and distance to GX 3394, both of which are highly uncertain. The cosine of the inclination, which is a root term in the equation, is also unknown. The inclination is also required to model the reflection spectrum and the relativistic effects used to measure , which it can be very degenerate with (Tomsick et al., 2009; Plant et al., 2013). If anything this underlines the current difficulties in precisely measuring the inner radius of the disc and it is hence not surprising that the disc and reflection methods often yield contrasting measurements of black hole spin (see e.g. Russell et al. 2013 for a recent compilation).
4.5 The ionisation parameter
Given the large variation in luminosity as the source progresses through each outburst it is expected that the ionisation of the disc surface layers should vary too, since by definition the ionisation parameter is a function of the flux illuminating the disc. In Figure 12 we plot how the ionisation parameter evolves throughout the outburst using darker colours to represent increased ionisation. There is a large degree of scatter, however this is not surprising given that this is determined from the soft bandpass and the PCA is limited to 3 keV and in spectral resolution (but see §5.3). Nevertheless it is easily distinguishable that the soft state generally corresponds to a higher level of ionisation than the hard state.
This is initially quite surprising as the hard state is typically deemed to represent the prime of the Comptonised emission, however as we have shown in Figure 7 the power-law flux remains significant in the soft state. While this can account for the consistently high level of ionisation throughout the outburst it still fails to account for soft state recording higher values. We discuss two explanations for this in §5.4: the affect of thermal emission and inner disc truncation. The high level of ionisation maintained throughout the outburst will mean that the reflection albedo is always high and will not vary much (Ross & Fabian, 1993; Zycki et al., 1994).
We also note that at the onset of the hard state during the soft to hard transition the ionisation parameter appears to be at its weakest. This is however the region where our routine can no longer suitably constrain the emission from the accretion disc thus removes the diskbb model. There is however a sufficient amount of thermal emission remaining above 3 keV at this stage, hence reflection model may be accounting for this excess by reducing the ionisation parameter. We therefore disregard any conclusion we can make from the ionisation parameter during this phase. Once the standard hard track is reached the ionisation returns to a higher level coincident with the rising phase.
4.6 Links to compact jets
In the hard state sources always display steady jet emission at GHz frequencies. Furthermore the X-ray and Radio luminosities appear to be inherently linked, following a non-linear correlation of , where (Corbel et al. 2003; Gallo et al. 2003; Corbel et al. 2013a; but see also Coriat et al. 2011; Gallo et al. 2012). Recently Corbel et al. (2013a) reported a long campaign of quasi-simulatenous X-ray and Radio observations with RXTE and the Australia Telescope Compact Array (ATCA). This represents the largest sample for a stellar mass black hole, and 32 of these radio observations are coincident (less than 2 days separation) with the data analysed in this study. We therefore investigate how the 8.6 GHz ATCA observations correlate with the results of our investigation.
Both the power-law and reflection are well correlated (positively) with the radio luminosity. The power-law correlation coefficient is 0.771, with a false probability of 2.5 and best fit slope of , agreeing excellently with Corbel et al. (2013a). Since the power-law dominates the total flux in the hard state this agreement is not surprising. The reflection is similarly correlated with a coefficient of 0.664 and a 3.5 chance of a false probability. Reflection also reflects a similar relation with the radio luminosity, fitting a slope of . Correlations between the Radio luminosity and other interesting parameters are listed in Table 5.
| Parameter 1 | Parameter 2 | -value | |
|---|---|---|---|
| 0.765 | 3.38 | ||
| 0.770 | 2.54 | ||
| 0.664 | 3.47 | ||
| Fractional RMS | 0.315 | 0.0793 | |
| 0.279 | 0.122 | ||
| 0.201 | 0.270 | ||
| 0.013 | 0.946 |
5 Discussion
In this work we have utilised three outbursts of GX 3394 to systematically uncover the spectral evolution of black hole binaries. In particular we focus upon the reprocessed reflection spectrum revealing marked changes in the reflection, often not in tandem with the Comptonised emission. As we will discuss now, the most likely explanation for this is distinct evolution of the accretion geometry.
5.1 The overall picture
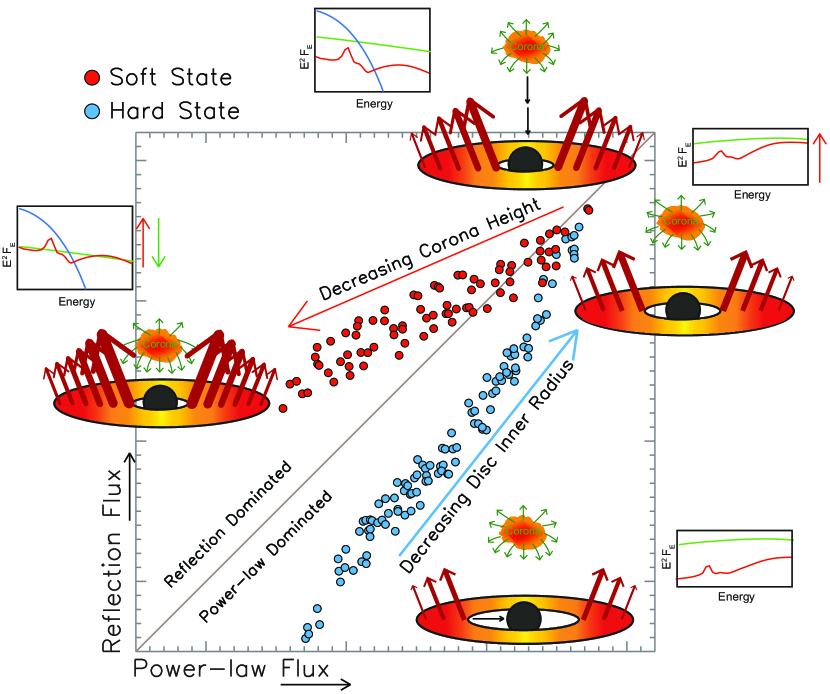
In Figure 7 we display how the Comptonised and reflection emission co-evolve as the outburst progresses. In the hard state (1) the power-law is typically responsible for 5 times more flux than the reflection (), however as the source rises the reflection fraction increases yet always remains below . On the other hand, the soft state lies in the main above unity, thus signifying larger levels of reflection than power-law. Furthermore, as the source decays the reflection fraction appears to continue increasing. What makes this interesting is that for a stable geometry the two should vary in tandem as the Comptonised emission feeds the reprocessing observed as the reflection spectrum. Therefore evolution is a signal of changes in the accretion geometry.
Figure 13 illustrates two such transformations that can lead to the observed cycle portrayed in Figure 7. The truncated disc model has become a popular means to describe the observed characteristics of the hard state, such as the hard spectrum and low reflection fraction (see Done et al. 2007 for a review and references therein). As the inner radius of the accretion decreases the solid angle it subtends beneath the illuminating corona increases. More photons are thus intercepted leading to increased reprocessing and reflected flux. In turn the amount of soft photons entering the corona will increase as the disc moves further towards the black hole leading to cooling of the hot electrons, which is observed through a softer photon index and high energy cut-off (Figures 5 and 6).
Beloborodov (1999) proposes an alternative explanation for these trends through a ‘dynamic corona’, whereby bulk motion of the emitting plasma reduces the irradiation of the disc. Even with a disc at the ISCO this regime can yield the small reflection fractions observed in the hard state, whilst the beaming will also suppress the soft seed photons, hence retaining a hard spectrum (). We however observe that both and increase as the source rises through the hard and into the intermediate states (see §4.1 and §4.2), which would thus require a decreasing bulk motion. This would appear at odds with the favoured internal shocks model outlined in Fender et al. (2004), whereby the jet velocity increases with luminosity/state. Given that there is no deviation from the observed trends in and would suggest that the illuminating medium remains consistent as well. Furthermore the same process ruling and is present in the decay of the hard state whereby they both decrease as the source fades ( fitted slope ), thus in the dynamic corona regime the jet velocity should systematically increase leading to bright radio flares. The reality however is that such flares have only been observed in the rise (Fender et al. 2004, see also Corbel et al. 2013b), thus we therefore propose the truncated disc model as our favoured interpretation. High resolution observations with XMM-Newton and Suzaku have also confirmed that the inner disc radius is truncated and decreases with increasing luminosity in the hard state (Plant et al. 2013; Kolehmainen et al. 2014; see also Petrucci et al. 2014). The lower values for the ionisation parameter recorded in the hard state also agree with a truncated inner disc (see §5.4). Furthermore, the reflection component correlates better with the reflection fraction than the Comptonised one (Table 3), hence this would suggest the changes are driven by the geometry of the disc changing, rather than the corona. The reflection fraction is also almost identical both in magnitude and evolution during the rise and decay (stages 1 and 4) of the hard state (compare Figures 7b–c) which argues strongly for an identical dynamic in and out of quiescence.
In contrast, the reflection dominates the Comptonised emission in almost all of the soft state observations (). Furthermore, as the decay progresses the reflection fraction appears to increase. The scatter in flux due to the reduced hard band signal in the soft state makes fitting the trend difficult, however if the 2002 outburst is excluded a slope of is resolved (where ). In addition, fitting the SIMS and SIMS-A observations, which track the decay quite well (Figure 2), reveals a similar relationship (). The decay of the disc luminosity fits the expected relation well, hence the inner disc radius is without any reasonable doubt stable in the soft state (see §4.4.2 and also Gierliński & Done 2004; Steiner et al. 2010; Dunn et al. 2011), thus we can rule out the same mechanism as the hard state. Instead, this acts as a strong indication that the underlying changes modifying the reflection fraction are occurring in the corona. The Comptonsied component correlates better with the reflection fraction than the reflection in the soft and soft-intermediate states, and hence acts as further evidence for this dynamic.
In Figure 13 we illustrate the relationship between the coronal height and the amount of reflection and Comptonised flux observed. A reduction in height increases the portion of Comptonised photons intercepted by the accretion disc, leading to increased reprocessing and thus reflection flux observed at infinity. In addition the lower height will lead to stronger relativistic effects upon each Comptonised photon, ultimately focusing more onto the disc, and in particular the inner regions (Miniutti & Fabian, 2004; Wilkins & Fabian, 2012). This will firstly heighten the reflection flux further due to the increased irradiation. Secondly the Comptonised flux observed will decrease as a result of the increased anisotropy (and tolerance towards the black hole) of the Comptonised emission with lowering height. It is clear to see then how the coronal height can significantly vary the reflection fraction by coupling enhanced reflection with a diminished power-law and we therefore favour this solution as the process behind the increasing reflection fraction in the soft state. While we have showcased the corona as a compact ‘lamp-post’ for illustration purposes, the effect of the coronal height may manifest itself in a different form, such as by varying in extension or collapsing, however the interpretation is still very much alike: the coronal geometry is expected to be evolving as the source decays in the soft state.
By using the evolving to constrain the accretion geometry we have assumed that the albedo remains constant. This however may not be true since the surface layers of the disc are subjected to a large range of illumination during the different phases of the outburst. The albedo itself is strongly dependant upon the ionisation of the surface layers, hence it must be considered how this may influence our results. Above 10 keV the scattering cross-section exceeds the absorption cross-section, hence there the albedo of the reflection is close to unity and constant. However, below 10 keV the albedo is strongly influenced by the ionisation stage: as the layers become more ionised the absorptive opacity decreases, leading to more effective reflection (Ross & Fabian, 1993; Matt et al., 1993; Zycki et al., 1994). Ultimately a fully ionised layer should act like mirror, corresponding to an albedo of unity.
In the case of BHXRBs the surface layers are expected to be kept highly ionised by the hot thermal emission emerging from the disc itself (Ross & Fabian, 1993), which is evident by the high ionisation parameter values we record throughout this study (see §4.5). Furthermore, the ionisation values we record are large enough that the albedo should remain consistently high, and not far from unity (Zycki et al., 1994). We do see some evolution in the ionisation parameter, which particularly contrasting between the hard and soft states (Figure 12), but this is not enough to change the albedo by more than a factor of 2 (Zycki et al., 1994). As we have described previously, the reflection fraction varies over a much broader range than this in outburst.
5.2 On the nature of the SIMS-A observations
When classifying spectral states it became apparent that there was two distinct clusters of points with low variability (RMS) isolated by their X-ray colour (6–10/3–6 keV flux; Figure 4). We associate the softer points (X-ray colour ) with the canonical soft state, whilst the harder points are described by spectra very similar to the SIMS. Additionally, of the 7 observations containing a type-A QPO listed in Motta et al. (2011), 6 are in this group. The seventh observation covered what appears to be part of a transition, hence only a portion of the time-series was used by Motta et al. (2011) meaning a RMS of was reported. In our study we utilised the entire observation which raised the RMS to . As a result of this association we labelled these points as SIMS-A. The majority of the SIMS-A observations displaying a type-A QPO are close to the top branch of the HID (Figure 2), and given that the feature is weak and broad (Motta et al., 2011) it is likely that many SIMS-A observations where a QPO was not detected simply lack the signal to do so.
As stated before the SIMS-A has a very similar spectrum to the SIMS (Table 4). In the HID (Figure 2) the SIMS-A appear to be distributed at a slightly higher luminosity than the SIMS, however this distinction becomes more clear in Figure 7d. The SIMS-A is therefore probably associated with an increase in the Comptonised and reflection components, and is the likely explanation for the hardened X-ray colour. It is also interesting that the SIMS-A remains on the ‘soft’ slope of (Figure 7d) describing the general decay of the source, even when there is an apparent increase in power-law and reflection flux each time the source transitions to it.
The spectrum of the SIMS-A is dominated by the power-law and reflection, whereas the disc flux is relatively weak (Table 4). In comparison, the disc generally accounts for the majority of flux in the SIMS, as is of course standard for the soft state as well. In Figure 14 we plot the fraction of the total source flux from each component which also emphasises how the disc and Comptonised flux are decreased and increased respectively in the SIMS-A.
In total there are 13 instances of transitions to the SIMS-A recorded in our study (i.e. excluding observations already in the SIMS-A). Six of these transitioned from the SIMS, of which 5 lead to an increase in reflection flux and 4 in power-law flux. In 4 of these the disc flux also decreased. Another six observations transitioned from the soft state, all of which are characterised by increases in power-law and reflection flux in addition to a reduced disc flux. Furthermore, in each case the photon index softened and all but one of these transitions lead to a net increase in flux. In the remaining observation the source transitioned directly from the HIMS. It is also interesting that the Comptonised and disc fractions plotted in Figure 14 isolate the SIMS-A observations quite well, whereas the SIMS appears more to be an extension of the soft state. This is typically true for SIMS observations with RMS in the 5–7 % range, whilst most of the type-B QPOs reported in Motta et al. (2011) correspond to observations with a RMS above this level. We note that the choice of the 5 % RMS line separating the SIMS and soft state is rather arbitrary and the true value could be slightly higher. This region is also prone to fast transitions shorter than the typical exposure time of the PCA (Muñoz-Darias et al., 2011).
Interestingly, the SIMS-A tend to roughly follow the LT4 relation (fitted relation: ) commonly attributed to the soft state, but at a lower luminosity (or higher disc temperature), consistent with an spectral hardening factor 1.1–1.3 times larger (Figure 4.4.2). An alternative explanation is a reduced disc inner radius, however this is unlikely given that the soft state is well regarded to harbour a disc extending all the way to the ISCO. The inner radius derived from the disc normalisation is also fairly stable and less than that of the soft state. The position on the L–T plot and smaller inner radii are both consistent with the anomalous regime of GRO J165540 (Kubota et al., 2001) and XTE J1550564 (Kubota & Makishima, 2004).
In relation to the soft state it is quite easy to explain the harder X-ray colour in the SIMS-A, simply since there is a decrease in the soft (disc) contribution whilst the hard (power-law/reflection) increases. However this fails to explain the consistently low level of variability usually associated with emission from the disc (or lack of Comptonised emission). The SIMS-A do appear to show a similar relationship between the Comptonised fraction and RMS as seen for the SIMS and soft state observations, but offset to a higher fraction. It may be that an additional non-variable component is also present but compensated for by the cutoffpl model. Curiously, in the anomalous regime reported by Kubota et al. (2001) and Kubota & Makishima (2004) an extra component is required, which is harder than the disc but softer than the power-law, and when accounted for returns the regime to the soft state L–T4 track. This may account for the disparity between the inner radii derived from the reflection and the disc. The same process giving rise to the type-A QPO may be behind the increased hardening of the thermal emission or Comptonised flux as well. We note that the SIMS-A are nevertheless well fitted (Figure 15).
5.3 The accuracy of this study and comparisons to other works
In using RXTE our approach is quantitative more than qualitative, hence it is important to examine the accuracy of our study. To do this we can examine how well investigations with high-resolution missions like XMM-Newton and Suzaku agree with our results. Such studies of the hard state (Reis et al., 2010; Done & Diaz Trigo, 2010; Plant et al., 2013; Kolehmainen et al., 2014) reveal moderate ionisation () and a low reflection fraction akin to our results. Studies of the HIMS are sparse due to the short duration of this state, but observations analysed by Hiemstra et al. (2011) and Reis et al. (2011, 2012) agree with the evolution outlined in §4.3, in particular an increased level of ionisation () and reflection fraction (the equivalent width is now 250–450 keV vs. 50–150 keV in the hard state). Kolehmainen et al. (2011) investigated the SIMS and soft state of GX 3394, confirming consistently high ionisation and increased reflection fraction habitual to the soft state in this study. Furthermore, they discuss difficulties in fitting the Fe line profile in the soft state, which is hampered since the disc is providing most of the flux and additional curvature in the continuum at 6 keV. This is most likely reason for the large scatter in during the soft state (Table 4).
We can also compare our results to previous works with RXTE. Recently Reis et al. (2013) performed a similar analysis with one outburst of the black hole XTE J1650500 finding similar results. For example, they also plot reflection versus power-law flux displaying similar evolution throughout the states (Figure 7). Dunn et al. (2008) also studied reflection in GX 3394, instead fitting the Fe line with a Gaussian. Remarkably, even with this simpler approach, very similar evolution is revealed. In their Figure 8 Dunn et al. (2008) plot Fe line flux against 7–20 keV flux (essentially reflection versus power-law flux) finding the same looped evolution and an increased fraction of reflection to power-law in the softer states. Furthermore, the fitted slopes to their ‘hard’ and ‘soft’ observations are almost identical to those in this study (Figure 7b–d), whilst the evolution of the equivalent width in their Figure 7 is very similar to the trend of its analogous parameter analysed in this investigation (Figure 7).
It is also possible that the three components (disc, power-law and reflection) exclusively assumed are not the full description of the X-ray spectra from BHXRBs. For example, in the AGN community much controversy exists due to the potential effect of absorption, and in particular the level, even in some cases presence, of reflection (Miller et al., 2008). No strong indicator of absorption, such as dips, eclipses or narrow lines has been observed from this source (Ponti et al., 2012), although this does not necessarily rule out that absorption is present or influences our results. It should be noted though that the reflection spectrum will also be influenced by photons emitted in the disc (Ross & Fabian, 1993, 2007), and this is not currently accounted for by xillver-a and is most likely to have an effect in the soft state where the disc is very strong.
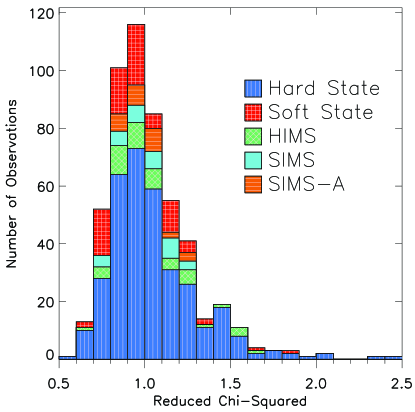
The convolution model rfxconv, which combines the ionised reflection of reflionx (Ross & Fabian, 2005) and the angle-dependant Compton reflection of pexrav (Magdziarz & Zdziarski, 1995), can accept any input continuum, such as that from a disc. Kolehmainen et al. (2011) applied rfxconv to soft and soft-intermediate state XMM-Newton observations of GX 3394, which through the soft bandpass could directly infer the disc contribution to the reflection spectrum. The results of Kolehmainen et al. (2011) are very similar to ours (see e.g. their Table 3), hence we believe our analysis using xillver-a should be robust to the effects of the disc contribution. However, we do note that self-consistent ionised reflection from illumination by the Comptonised and disc emission is needed to confirm our results. Finally the chi-square distribution is excellent, with 95% of observations having a reduced– of (Figure 15).
5.4 Why is the reflection spectrum more ionised in the soft state?
In §4.5 we analyse the ionisation parameter, defined as the ratio of the illuminating flux and the gas density, where it emerges that the parameter is significant larger in the soft state. This would appear at odds with the state of the illuminating flux, which typically peaks in the brighter stages of the hard state and subsequent transition into the HIMS (Figure 7). To explain this one important aspect to consider is the increased disc emission in the soft state, which will undoubtedly have an ionising affect on the surface layers in addition to the illumination from the corona above. To this end Ross & Fabian (2007) investigated the impact of the disc, finding that increased thermal radiation and peak temperature will ultimately result in a more ionised spectrum. In particular the Fe profile is strongly affected as a result of higher ionisation stages and greater Compton-broadening. Our chosen reflection model (xillver-a) does not account for change in the thermal emission throughout the outburst and thus is likely to react to changes in the disc by varying the ionisation parameter, in particular with an increase in softer states.
Another explanation for the apparent change in illumination could result from varying the area of the disc and thus the solid angle it subtends below the corona. If the inner accretion disc is truncated then the amount of Comptonised photons intercepted by the disc will decrease rapidly. Furthermore, assuming a lamppost geometry, the illumination pattern should roughly go as R-3, thus the reprocessed spectrum will be dominated by emission from the most central region, which in turn likely represents the most ionised zone of the disc because of the peaked illumination there. Even with a small level of truncation the inferred ionisation level will probably diminish significantly, and this contrast may also be heightened if light-bending is at play (see Figure 13). This argument works well since, as discussed in §5.3, high-resolution spectroscopy resolves the inner disc to be truncated and of a lower ionisation stage in the hard state (e.g. Plant et al. 2013).
6 Summary
In this study we have performed a comprehensive and systematic investigation of X-ray reflection from GX 3394. In total we analysed 528 observations made by RXTE, covering the three full outbursts between 2002 and 2007. This represents the largest study of X-ray reflection applying a self-consistent treatment to date, and in particular such excellent monitoring has allowed a thorough investigation of state transitions, in addition to the canonical hard and soft states (Figure 2). Each observation was well described by a combination of thermal disc emission (diskbb), a cut-off power-law (cutoffpl) and relativistically blurred reflection (relconvxillver-a). All hard state and some HIMS observations did not require a disc due to the 3 keV lower limit to the PCA bandpass, while the bright stages of the hard state display a decreasing high-energy cut-off as the source luminosity rises (Figure 6). X-ray reflection is required for the entire duration of the study.
We pay particular detail to how the power-law and reflection co-evolve throughout the outburst which display a very strong positive correlation throughout each state (Table 3). Since the reflection arises as a consequence of the power-law irradiating the disc, contrasting evolution acts a strong indicator of geometrical changes. The hard state is distinctly reflection weak with a typical reflection fraction (the ratio of reflection and power-law flux) of 0.2. The reflection fraction does however increase as the source luminosity rises fitted by a slope of 1.2 and 1.7 in the fainter and brighter stages of the hard state rise respectively (Figures 7a and 7b). The latter indicates a change in the dynamic behind the increasing reflection fraction and occurs during the phase where the high-energy cut-off in the Comptonised emission decreases (Figure 6). In stark contrast the soft state represents a period of strong reflection whereby the reflection fraction exceeds unity for almost the entire state. Furthermore, while there is some scatter, the fitted slope to the 2004 and 2007 outbursts is , signifying a furthering of the reflection dominance over the power-law emission. As the source decays into the hard state the reflection fraction returns to the same magnitude and slope as in the rise, hence whether the source heading towards or out of quiescence the accretion geometry is likely to be the same.
We discuss what is driving the contrast between the reflection and power-law in §5.1. The favoured interpretation is a truncated inner disc radius and decreasing illuminating source height for the hard and soft states respectively (see Figure 13 for an illustration). The hard state inner accretion disc of GX 3394 was recently found to be truncated and decrease in radius with increasing luminosity (Plant et al., 2013), which explains qualitatively how the low reflection fraction can be achieved whilst gradually promoting its increase. Softening of the power-law photon index (§4.1), a decreasing high-energy cut-off, and a low ionisation parameter (§4.5 and §5.4) all add strength to the truncated disc interpretation. The decay in disc flux and temperature should directly follow that of a black-body for a constant disc area (). The soft state tracks a very similar relation of ; Figure 10) implying that the inner disc radius is constant and at the ISCO. This immediately explains how the reflection fraction is able to reach unity (essentially a solid angle of ) and confines geometrical changes to the corona. We interpret the increase in reflection fraction as the source decays through a decreasing corona height strengthening the disc illumination and the effects of light-bending.
Acknowledgements
The authors would like to thank Mari Kolehmainen for helpful discussions. DSP acknowledges financial support from the STFC. GP acknowledges support via an EU Marie Curie Intra-European Fellowship under contract no. FP-PEOPLE-2012-IEF-331095. TMD acknowledges funding via an EU Marie Curie Intra-European Fellowship under contract no. 2011-301355. Part of this work was supported by the COST Action MP0905 “Black Holes in a Violent Universe” and DSP also thanks the Max Planck Institute fur Extraterrestriche Physik for their hospitality during a short visit. Many figures in this work have made use of the cubehelix color-scheme (Green, 2011).
References
- Baldwin (1977) Baldwin J. A., 1977, ApJ, 214, 679
- Ballantyne et al. (2001) Ballantyne D. R., Ross R. R., Fabian A. C., 2001, MNRAS, 327, 10
- Belloni et al. (2005) Belloni T., Homan J., Casella P., van der Klis M., Nespoli E., Lewin W. H. G., Miller J. M., Méndez M., 2005, A&A, 440, 207
- Belloni et al. (2011) Belloni T. M., Motta S. E., Muñoz-Darias T., 2011, Bulletin of the Astronomical Society of India, 39, 409
- Beloborodov (1999) Beloborodov A. M., 1999, ApJL, 510, L123
- Brocksopp et al. (2013) Brocksopp C., Corbel S., Tzioumis A., Broderick J. W., Rodriguez J., Yang J., Fender R. P., Paragi Z., 2013, MNRAS, 432, 931
- Corbel et al. (2013a) Corbel S. et al., 2013a, MNRAS, 431, L107
- Corbel et al. (2013b) Corbel S. et al., 2013b, MNRAS, 431, L107
- Corbel et al. (2003) Corbel S., Nowak M. A., Fender R. P., Tzioumis A. K., Markoff S., 2003, A&A, 400, 1007
- Coriat et al. (2011) Coriat M. et al., 2011, MNRAS, 414, 677
- Dauser et al. (2010) Dauser T., Wilms J., Reynolds C. S., Brenneman L. W., 2010, MNRAS, 409, 1534
- Davis et al. (2005) Davis S. W., Blaes O. M., Hubeny I., Turner N. J., 2005, ApJ, 621, 372
- Di Salvo et al. (2001) Di Salvo T., Done C., Życki P. T., Burderi L., Robba N. R., 2001, ApJ, 547, 1024
- Done & Diaz Trigo (2010) Done C., Diaz Trigo M., 2010, MNRAS, 407, 2287
- Done & Gierliński (2006) Done C., Gierliński M., 2006, MNRAS, 367, 659
- Done et al. (2007) Done C., Gierliński M., Kubota A., 2007, A&AR, 15, 1
- Dunn et al. (2010) Dunn R. J. H., Fender R. P., Körding E. G., Belloni T., Cabanac C., 2010, MNRAS, 403, 61
- Dunn et al. (2011) Dunn R. J. H., Fender R. P., Körding E. G., Belloni T., Merloni A., 2011, MNRAS, 411, 337
- Dunn et al. (2008) Dunn R. J. H., Fender R. P., Körding E. G., Cabanac C., Belloni T., 2008, MNRAS, 387, 545
- Ebisawa et al. (1994) Ebisawa K. et al., 1994, PASJ, 46, 375
- Fabian & Ross (2010) Fabian A. C., Ross R. R., 2010, Space Sci. Rev., 157, 167
- Fender & Belloni (2012) Fender R., Belloni T., 2012, Science, 337, 540
- Fender et al. (2004) Fender R. P., Belloni T. M., Gallo E., 2004, MNRAS, 355, 1105
- Gallo et al. (2003) Gallo E., Fender R. P., Pooley G. G., 2003, MNRAS, 344, 60
- Gallo et al. (2012) Gallo E., Miller B. P., Fender R., 2012, MNRAS, 423, 590
- García et al. (2014) García J. et al., 2014, ApJ, 782, 76
- García et al. (2013) García J., Dauser T., Reynolds C. S., Kallman T. R., McClintock J. E., Wilms J., Eikmann W., 2013, ApJ, 768, 146
- García & Kallman (2010) García J., Kallman T. R., 2010, ApJ, 718, 695
- García et al. (2011) García J., Kallman T. R., Mushotzky R. F., 2011, ApJ, 731, 131
- George & Fabian (1991) George I. M., Fabian A. C., 1991, MNRAS, 249, 352
- Gierliński & Done (2004) Gierliński M., Done C., 2004, MNRAS, 347, 885
- Gierliński et al. (1999) Gierliński M., Zdziarski A. A., Poutanen J., Coppi P. S., Ebisawa K., Johnson W. N., 1999, MNRAS, 309, 496
- Green (2011) Green D. A., 2011, Bulletin of the Astronomical Society of India, 39, 289
- Hiemstra et al. (2011) Hiemstra B., Méndez M., Done C., Díaz Trigo M., Altamirano D., Casella P., 2011, MNRAS, 411, 137
- Hynes et al. (2003) Hynes R. I., Steeghs D., Casares J., Charles P. A., O’Brien K., 2003, ApJL, 583, L95
- Jahoda et al. (2006) Jahoda K., Markwardt C. B., Radeva Y., Rots A. H., Stark M. J., Swank J. H., Strohmayer T. E., Zhang W., 2006, ApJS, 163, 401
- Kolehmainen et al. (2011) Kolehmainen M., Done C., Díaz Trigo M., 2011, MNRAS, 416, 311
- Kolehmainen et al. (2014) Kolehmainen M., Done C., Díaz Trigo M., 2014, MNRAS, 437, 316
- Kong et al. (2000) Kong A. K. H., Kuulkers E., Charles P. A., Homer L., 2000, MNRAS, 312, L49
- Kubota & Makishima (2004) Kubota A., Makishima K., 2004, ApJ, 601, 428
- Kubota et al. (2001) Kubota A., Makishima K., Ebisawa K., 2001, ApJL, 560, L147
- Laor (1991) Laor A., 1991, ApJ, 376, 90
- Maccarone (2003) Maccarone T. J., 2003, A&A, 409, 697
- Magdziarz & Zdziarski (1995) Magdziarz P., Zdziarski A. A., 1995, MNRAS, 273, 837
- Markert et al. (1973) Markert T. H., Canizares C. R., Clark G. W., Lewin W. H. G., Schnopper H. W., Sprott G. F., 1973, ApJL, 184, L67
- Markoff et al. (2005) Markoff S., Nowak M. A., Wilms J., 2005, ApJ, 635, 1203
- Matt et al. (1993) Matt G., Fabian A. C., Ross R. R., 1993, MNRAS, 262, 179
- Matt et al. (1996) Matt G., Fabian A. C., Ross R. R., 1996, MNRAS, 278, 1111
- Matt et al. (1991) Matt G., Perola G. C., Piro L., 1991, A&A, 247, 25
- McClintock et al. (2001) McClintock J. E. et al., 2001, ApJ, 555, 477
- Merloni et al. (2000) Merloni A., Fabian A. C., Ross R. R., 2000, MNRAS, 313, 193
- Miller et al. (2006) Miller J. M., Homan J., Miniutti G., 2006, ApJL, 652, L113
- Miller et al. (2008) Miller L., Turner T. J., Reeves J. N., 2008, A&A, 483, 437
- Miller-Jones et al. (2012) Miller-Jones J. C. A. et al., 2012, MNRAS, 421, 468
- Miniutti & Fabian (2004) Miniutti G., Fabian A. C., 2004, MNRAS, 349, 1435
- Mitsuda et al. (1984) Mitsuda K. et al., 1984, PASJ, 36, 741
- Motta et al. (2009) Motta S., Belloni T., Homan J., 2009, MNRAS, 400, 1603
- Motta et al. (2011) Motta S., Muñoz-Darias T., Casella P., Belloni T., Homan J., 2011, MNRAS, 418, 2292
- Muñoz-Darias et al. (2008) Muñoz-Darias T., Casares J., Martínez-Pais I. G., 2008, MNRAS, 385, 2205
- Muñoz-Darias et al. (2013) Muñoz-Darias T., Coriat M., Plant D. S., Ponti G., Fender R. P., Dunn R. J. H., 2013, MNRAS, 432, 1330
- Muñoz-Darias et al. (2011) Muñoz-Darias T., Motta S., Belloni T. M., 2011, MNRAS, 410, 679
- Nayakshin & Kallman (2001) Nayakshin S., Kallman T. R., 2001, ApJ, 546, 406
- Nayakshin et al. (2000) Nayakshin S., Kazanas D., Kallman T. R., 2000, ApJ, 537, 833
- Petrucci et al. (2014) Petrucci P.-O., Cabanac C., Corbel S., Koerding E., Fender R., 2014, A&A, 564, A37
- Plant et al. (2013) Plant D. S., Fender R. P., Ponti G., Munoz-Darias T., Coriat M., 2013, MNRAS, submitted arXiv:1309.4781
- Ponti et al. (2012) Ponti G., Fender R. P., Begelman M. C., Dunn R. J. H., Neilsen J., Coriat M., 2012, MNRAS, 422, L11
- Reis et al. (2010) Reis R. C., Fabian A. C., Miller J. M., 2010, MNRAS, 402, 836
- Reis et al. (2011) Reis R. C. et al., 2011, MNRAS, 410, 2497
- Reis et al. (2012) Reis R. C., Miller J. M., Reynolds M. T., Fabian A. C., Walton D. J., 2012, ApJ, 751, 34
- Reis et al. (2013) Reis R. C., Miller J. M., Reynolds M. T., Fabian A. C., Walton D. J., Cackett E., Steiner J. F., 2013, ApJ, 763, 48
- Remillard & McClintock (2006) Remillard R. A., McClintock J. E., 2006, ARAA, 44, 49
- Ross & Fabian (1993) Ross R. R., Fabian A. C., 1993, MNRAS, 261, 74
- Ross & Fabian (2005) Ross R. R., Fabian A. C., 2005, MNRAS, 358, 211
- Ross & Fabian (2007) Ross R. R., Fabian A. C., 2007, MNRAS, 381, 1697
- Ross et al. (1999) Ross R. R., Fabian A. C., Young A. J., 1999, MNRAS, 306, 461
- Rossi et al. (2005) Rossi S., Homan J., Miller J. M., Belloni T., 2005, MNRAS, 360, 763
- Rothschild et al. (1998) Rothschild R. E. et al., 1998, ApJ, 496, 538
- Russell et al. (2013) Russell D. M., Gallo E., Fender R. P., 2013, MNRAS, 431, 405
- Russell et al. (2011) Russell D. M., Miller-Jones J. C. A., Maccarone T. J., Yang Y. J., Fender R. P., Lewis F., 2011, ApJL, 739, L19
- Shakura & Sunyaev (1973) Shakura N. I., Sunyaev R. A., 1973, A&A, 24, 337
- Shimura & Takahara (1995) Shimura T., Takahara F., 1995, ApJ, 445, 780
- Steiner et al. (2010) Steiner J. F., McClintock J. E., Remillard R. A., Gou L., Yamada S., Narayan R., 2010, ApJL, 718, L117
- Stiele et al. (2011) Stiele H., Motta S., Muñoz-Darias T., Belloni T. M., 2011, MNRAS, 418, 1746
- Tarter et al. (1969) Tarter C. B., Tucker W. H., Salpeter E. E., 1969, ApJ, 156, 943
- Tomsick et al. (2009) Tomsick J. A., Yamaoka K., Corbel S., Kaaret P., Kalemci E., Migliari S., 2009, ApJL, 707, L87
- van der Klis (2006) van der Klis M., 2006, Rapid X-ray Variability, Lewin W. H. G., van der Klis M., eds., Cambridge Univ. Press, Cambridge, pp. 39–112
- Wilkins & Fabian (2012) Wilkins D. R., Fabian A. C., 2012, MNRAS, 424, 1284
- Zhang et al. (1997) Zhang S. N., Cui W., Chen W., 1997, ApJL, 482, L155
- Zycki et al. (1994) Zycki P. T., Krolik J. H., Zdziarski A. A., Kallman T. R., 1994, ApJ, 437, 597