Department of Geotechnical Engineering, Tongji University, Shanghai 200092, P. R. China
Department of Physical Chemistry and Colloid Science, Wageningen University, Wageningen, The Netherlands
Department of Physics & Center for Nonlinear and Complex Systems, Duke University, Durham, NC 27708, USA
Shear Jamming in Granular Experiments without Basal Friction
Abstract
Jammed states of frictional granular systems can be induced by shear strain at densities below the isostatic jamming density (). It remains unclear, however, how much friction affects this so-called shear-jamming. Friction appears in two ways in this type of experiment: friction between particles, and friction between particles and the base on which they rest. Here, we study how particle-bottom friction, or basal friction, affects shear jamming in quasi-two dimensional experiments. In order to study this issue experimentally, we apply simple shear to a disordered packing of photoelastic disks. We can tune the basal friction of the particles by immersing the particles in a density matched liquid, thus removing the normal force, hence the friction, between the particles and base. We record the overall shear stress, and particle motion, and the photoelastic response of the particles. We compare the shear response of dry and immersed samples, which enables us to determine how basal friction affects shear jamming. Our findings indicate that changing the basal friction shifts the point of shear jamming, but it does not change the basic phenomenon of shear jamming.
pacs:
47.57.Gcpacs:
81.05.Rmpacs:
78.20.FmGranular flow Porous materials; granular materials Birefringence
Granular materials, which exhibit a great number of intriguing properties, have attracted much scientific attention in recent years [1, 3, 2]. For example, granular materials can turn from a loose fluid-like state into a stress-supporting solid upon increasing the density of particles per unit volume, a phenomenon called jamming [4, 5]. Liu et al [4, 6] proposed a jamming phase diagram to capture the various state variables that determine whether a material is jammed or not. The diagram was hypothesized to describe not just the behavior of granular materials, but a whole range of disordered materials, among which are colloids, foams and emulsion. Granular materials in particular live on the zero-temperature plane of the Liu-Nagel jamming diagram, since thermal fluctuations do not affect the macroscopic behavior of the particles. Recently [7] it was shown that in this plane, the phase behavior of granular materials is richer than the original phase diagram suggested. Granular materials exhibit a property called shear jamming, in which the simple shear deformation of a disordered stress-free packing can turn it into a rigid structure, without significantly changing the structure, an aspect not covered by the work of Liu and Nagel.
This shear jamming phenomenon is apparent in studies of quasi two dimensional (2D) photoelastic disk packings [7, 8]. In these systems, inter-particle forces were visualized with photoelasticity [9, 10], a technique that shows clear force chain structures [11, 12]. In these systems friction appears in two ways: friction between particles, and friction between particles and the base on which the particles rest, i.e. basal friction.Interparticle friction plays an important role in facilitating shear jamming. But, in a typical 2D photoelastic experiment one tries to reduce basal friction by using powder-based lubricants. Still, it is impossible to totally remove basal friction with lubricants. Usually, the basal friction is assumed too small to substantially affect the results of the 2D experiments [11, 12]. The ratio between fully mobilized basal friction and mean contact force between particles at shear jamming state is , indicating that basal friction should have little effect in determining the stresses near or above jamming [7]. Floating particle systems have been made before with airflow [13] and with water [14]. However, we are not aware of experimental studies probing directly the role of basal friction on shear jamming, and choose a water based system for its experimental simplicity.
Here, we describe a novel apparatus that allows us to eliminate static basal friction for the shear of quasi-2D photoelastic disk packings, while effectively keeping all other experimental settings the same. We use this apparatus to compare shear jamming for a basal-friction-free particle packing, to a packing with basal friction. We find that shear jamming persists in the absence of basal friction. Eliminating the basal friction reveals two distinct responses of the particle packing, which we associate with fragile and shear jammed states [7]. We discuss the difference of their responses via their change in shear stress, and their different response visible in the deformation field of the packing. We also compare the response of the basal friction free system to results obtained earlier in a shear setup with an articulated base, and find very similar phenomenology.
1 Setup
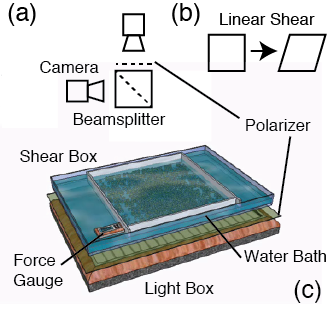
The apparatus consists of a 2 cm3 shallow water-tight tank, in which we have mounted an aluminum shear cell (Fig. 1a). One wall of the shear cell is driven by a linear stage; bearings on the walls are constructed in such a way that wall movement results in shear at constant volume (here, area) (40 cm cm) (Fig. 1c). The walls all are rough on a particle lengthscale. We image the packing with two cameras via a beam splitter to record both position and photelastic response of the particles – see Fig. 1b. We rely on the system-averaged squared intensity gradient to serve as a proxy for the stresses present in the system. Additionally, a force sensor is positioned between the stage and the moving walls to record the shear force, , exerted on the particles during the imposed deformation. The stage is driven by a stepper motor at a speed of approximately 0.33mm/s in all experiments unless otherwise stated. At this speed, viscous stresses between the floating particles are most likely negligible given the surface roughness of the particles and other imperfections in the line contacts the particles make. Rate-dependence of the dry-frictional interactions between them are also weak [10]. The particles are photoelastic, custom made from polyurethane sheets (Vishay PSM-4). In all our experiments, there are about 3000 particles in the system. The particles are all of uniform thickness ( 6 mm), with three different diameters: , and . The number ratio of the large, medium and small (L:M:S) particles is 5:22:4. The force sensor measurement necessarily measures both the ensemble force of the packing and stray frictional forces (0.5-2 N) from the sliders and bearings used to guide the motion of the walls; the latter is very reproducible [16] and is subtracted with a calibration run. Particles float in a solution of KCl in demineralised water; the particles are just lighter than the salt water and do not stick out of the liquid surface. They are thus not affected by surface tension. The particles are also always millimeters separated from the base, making viscous forces between the particles and the base during particle motion much smaller than the experimental force resolution. In both wet and dry experiments, we start all experiments in a stress free state. The dry system is prepared stress free by gently “massaging” the particle positions to remove as much photo-elastic signal as possible. This massaging will naturally induce frictional base loading in the arbitrary directions in which this massaging was necessary. This technique applied here is identical to the one used earlier [8]; we have never been able to detect any bias introduced by this method. Further details of the experimental setup can be found elsewhere [16].
2 Shear Without Basal Friction
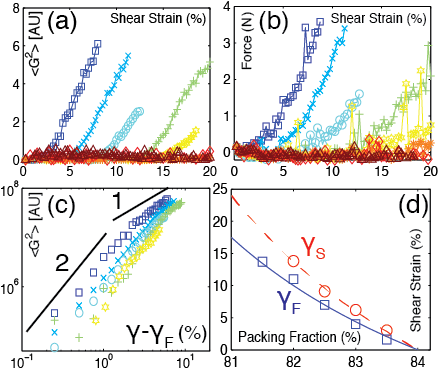
To measure shear jamming in a basal friction free system, we apply quasi-static isochoric shear to a floating layer of disks, which we refer to as a wet packing. We record the photoelastic signal and shear force of the wet packing as a function of strain at a range of packing fractions . Photoelastic pressure signal – Due to residual stresses inside the particles, illumination inhomogeneities and light refraction/scattering from particle edges, any image will have a small offset , even in the stress free initial state. Since this background does not change during a given run, we probe the photoelastic response by measuring . , as shown in Fig. 2a. For all that the photoelastic response emerges after a finite amount of strain ; the response is initially super-linear with ; after some larger finite amount of strain, , it evolves to linear behavior. The shear force data measured from the force sensor shows the same trends as the photoelastic response, as in Fig. 2b. To extract the exponent and the strain amplitude signifying the emergence of a force response, we plot vs. on double-logarithmic scales in Fig. 2c. We subtract from each data set the which produces the best straight line on a log-log plot. This method is very sensitive to small errors and hence is sufficiently accurate to extract a value for . For small strains beyond the noise plateau in the data we observe . We extract the nonlinear to linear crossover point by extrapolating the linear response regime to on the linear scale from Fig. 2a, which yields results for accurate to less than a percentage point strain. There are two obvious limits for the functional behavior of and with : at lower , no amount of shear can shear-jam the packing. Below some threshold packing fraction we therefore expect . At the isotropic jamming point , we expect . A simple function [15] with these properties is:
| (1) |
We plot and in Fig. 2 d, and show that they delineate two phase boundaries which merge at the isotropic jamming point . We then fit the data for , drawn from the data, to Eq. 1, where we use , based on the present experiments, and from Ref. [7]. The amplitudes are different fit parameters for the two cases. The fits are shown as lines in Fig. 2d, and are good representations of the data. We find that and . We also extract from the shear force data [17] by extrapolating the linear response regime to . The results for (not shown) is consistent with corresponding data obtained from .
3 Comparison to Shear with Basal Friction
Above, we have characterized shear jamming and relaxation in a wet
packing. We next determine the role of basal friction. By not having
liquid in our setup, we “turn on” friction with the base, while
keeping all other experimental settings the same. We perform the same
shear experiments as in the wet case, but with particles resting
directly on the acrylic base plate of the tank, which we call the
dry packing. We normalize the photoelastic response data in the
same way as the wet system [18].
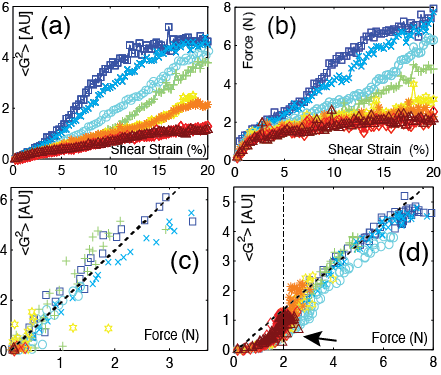
We summarize the response under dry conditions in Fig. 3a,b. In part a, we show the photoelastic response, which first increases linearly, even for the lowest packing fraction considered here (). For higher densities, we observe a sharp increase in the slope, , similar to the basal-friction-free system, followed by saturation in . In Fig. 3b, we show the force sensor data obtained during the same runs. For large and intermediate strains we observe similar trends to the photoelastic response (although the force saturation does not happen for ). For lower , we see that the force sensor data deviates from the photoelastic response: at , the shear force increases substantially for small strains, and then saturates.
Comparing Fig. 2a,b with Fig. 3a,b, there are three characteristics in the dry packing dynamics that are absent from the wet packing dynamics: (i) increases slowly with strain, even for the lowest packing fraction ; (ii) for , increases relatively quickly, but for these low ’s, saturates at to about ; (iii) for our largest exhibit a plateau at large strain.
We gain insight into the physical origin of observations i – iii by looking first at the correlation between for both the wet and dry system – Fig. 3c, d respectively. Fig. 3c shows that the photoelastic response and the shear force in the wet packing are linearly correlated. However, for the dry system, this linear correlation is not as good, as shown in Fig. 3d. At small , where also the applied strains are small, the photoelastic response in the dry packing increases much less than expected based on a best linear fit (dashed line). We attribute this excess of shear force to increased mobilization of frictional contacts with the base, with the following reasoning. For the dry case, the applied force, , is balanced by three other types of forces. One of these is friction in the apparatus, which is subtracted. The second is due to inter-particle contact forces which are ultimately balanced by forces at the boundaries. The third is due to friction between the particles and the base. Before strain is applied, basal friction forces are mobilized in arbitrary directions. With each successive strain step, basal friction forces, which have minimal effect on the photoelastic response, become mobilized so as to resist the applied force, which is applied through interparticle contacts, hence the roughly linear increase in , explaining observation i. This mobilization effect saturates at a maximum force of , because maximum mobilization of the basal contact forces is reached; beyond this point static friction fails, contact forces cannot grow anymore, and particles start to move.
To support this view, we quantify the basal friction effect, by measuring the maximum friction to move the whole system on the Plexiglas . Here, is the coefficient of friction between particle and Plexiglas, g is the gravitational acceleration, is the disk height and is the systems’s cross sectional area. The maximum force, when friction is fully mobilized, for is , which yields a , which is low but not unreasonable for the powder-lubricated particles resting on the plexiglas base — it appears that for , the system does not actually jam. This phenomenon explains observation(ii). For observation (iii), the situation is more complicated. One possible explanation of the saturation of is that the photoelastic response saturates at large pressure. However, this does not account for the essentially identical saturation in . In this regard, we note two possible sources of saturation: a) shear bands develop, which limit the maximum attainable shear stress; and b) even when shear bands do not form, as in the experiments of Ren et al.[8], for large enough strains, well above shear jamming, the system simply becomes for isotropic. We are currently carrying out additional shear experiments on particles with much lower friction coefficients to test these ideas. Note also that the proportionality between and is different for the dry and wet case. This calibration factor depends on several experimental details, such as light intensity and camera aperture, which may have been different in the two experiments.
3.1 Particle Tracking
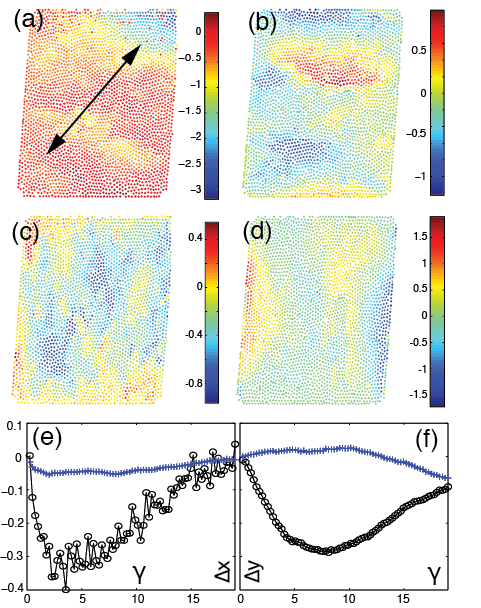
We obtain additional evidence for the physical picture put forward above, by probing the packing deformation and the displacement of individual particles. In Fig. 4 we show the non-affine [19] horizontal particle displacements for both a dry (a) and a wet (b) packing at 82 % and strain amplitude of . In the dry packing, the top right part of the packing is lagging the lower left: particles in the packing remain static until the interparticle force overcomes basal friction. A particle moves when it experiences a force which can overcome the resistance from its neighbor particles and the basal friction which it is experiencing; this leads to a local compaction of the packing. The horizontal non-affine response is indeed much more homogeneous, although large spatially coherent inhomogeneities can be observed. The part of the box that is mobilized last is the corner in the expansion direction of the shear, furthest away from any pushing wall. The system-averaged mean non-affine horizontal displacements for the wet and dry system, shown in Fig. 4e supports this view: it is evident in the dry case that the non-affine particle displacements have an extreme value at a strain amplitude of . A similar lag, but with an extremum at occurs in the system-averaged mean non-affine vertical displacement, Fig. 4f. The peak lag moment in Fig. 4e corresponds to the point where the shear force saturates in Fig. 3b, where interparticle forces have grown to overcome basal friction. Once all basal contacts are mobilized, the shear force saturates because most of the packing is moving in a basically unjammed state for the lowest ’s, and the non-affine motion becomes random. In contrast, in the wet packing, the non-affine displacements are almost equally positive and negative, i.e. random, and the system-averaged mean non-affine motion is only a fraction of that of the dry system. The source of this small amount of non-affine motion is elucidated by looking at the vertical particle displacement field, shown in Fig. 4c,d for both the wet and dry system in the same frame as panel (a,b). For the wet system, they indicate a small amount of mass transport at the boundaries; the small inbalance in non-affine transport is thus a boundary effect, where perhaps density inhomogeneities drive this flow.
4 Reynolds Pressure and Relaxation Effects
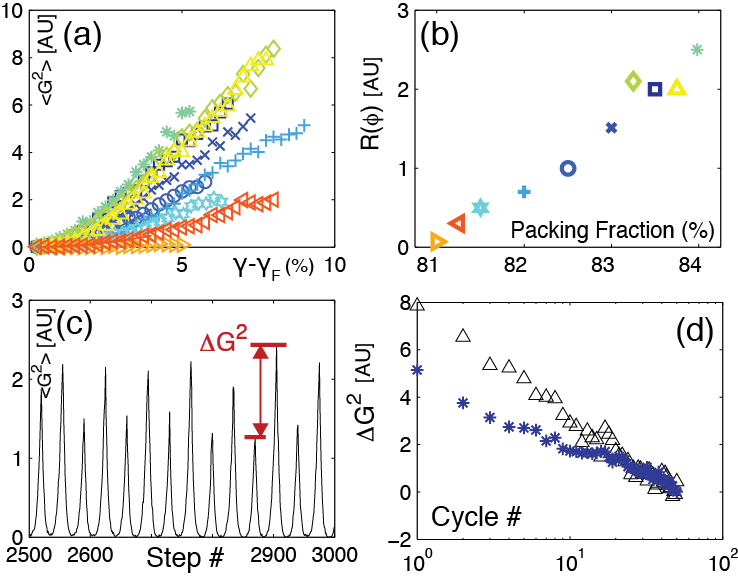
In previous work [8], we quantified Reynolds dilatancy and relaxation effects in a 2D packing driven by a Galilean invariant deformation through an articulated base. However, the interaction between the base and the particles was still frictional. Here we test if the observations from [8] reproduce also in the absence of basal friction. Although the experimental conditions of the two experiments are substantially different, we expect two key effects to be qualitatively similar: (i) The prefactor for the quadratic rise in the pressure with strain should increase with the packing fraction. (ii) The force response of the packing to asymmetric shear should logarithmically decay to a symmetric response. In this section, we demonstrate that these two key observations are indeed also observed in the absence of basal friction. In Fig. 5a, we show the quadratic increase of the pressure after for different packing fractions. Indeed, the prefactor increases with the packing fraction, as shown by Fig. 5b, where we show the prefactor from that we have called the Reynolds coefficient [8]. The divergence of the coefficient towards is not as strong as observed in previous work, but it does rise strongly with .
Next, we compare the response of the wet system to cyclic shear. Before addressing this, we briefly review some details of the
protocol and response. One cycle of the protocol involves shear strain in the ’forward’ direction in small steps to a maximum strain,
, followed by a reversal of the shear to the original system configuration, i.e. to . The pressure, measured in reached a maximum at in the first cycle. Associated with the growth of the pressure
is the evolution of an anisotropic strong force network, where the compressive direction of shear strain corresponded to the principal
direction of network. During reversal of the strain, we have seen before that and the original force network diminish, and a new strong network formed perpendicular to the first network, and associated with the fact that the compressive and dilational directions switch under shear strain
reversal. When the system returned to the unstrained configuration, a strong force network associated with the reverse
strain persisted at . Associated with the network is a non-zero pressure. In subsequent cycles of forward and reverse shear,
the pressure at decreased monotonically with cycle number, and the pressure at grew correspondingly. The
difference decreased logarithmically with cycle number , suggesting an activated process in the stress ensemble, enabled through fluctuations in the interparticle forces during shear. These observations reproduce very well in the basal friction free setup. In Fig. 5c we show for an experiment at and after about 35 cycles. Clearly the force response has become almost symmetrical in this experiment. The decay of the asymmetry is also logarithmic, as in the articulated base experiment. We measure the asymmetry through indicated in Fig. 5c. The decay of is clearly logarithmic as indicated in Fig. 5d. We can thus conclude that even more subtle features of shear jamming, such as Reynolds dilatancy and pressure relaxation, are robust in the absence of basal friction [20].
5 Conclusions
We have studied the role of basal friction on the stress and flow dynamics of a sheared two dimensional packings of frictional disks. Our main finding from the photoelastic response of the packing is that shear jamming and many associated subtle features also occur in the absence of basal friction. This observation is supported by two independent stress measurements and a comparison of the packing force response with that from an entirely different driving mechanism. We identify the onset of fragile and shear jammed states. Our findings have interesting repercussions: We demonstrate that a wall-driven floating particle system is superior to a similar system where the particles rest on a static frictional base. In particular, a floating system removes any effect due to gravity, making it ideal for micro-gravity granular studies. The emergence of rigidity in our slowly sheared packing also hints that a simple frictional mechanism can be the sole source of the viscosity divergence of dense athermal suspensions [21, 22]. Interestingly, the flow fields observed in the dry and wet experiments are very different, despite their force response being very similar. This suggests a surprising disconnect between the applied stresses and resulting strains, which is of interest for constitutive modeling attempts. The analysis of these flow fields will be the subject of future work.
6 Acknowledgements
We thank Richard Nappi for help in the machine shop, Abe Clark, Junyao Tang and Jie Ren for help with image analysis, and Kim Clark for baking cookies. IGUS generously provided a linear stage under the Young Engineers Support Program. This project was funded by NASA grant NXX10AU01G, NSF grants NSF0835742, NSF-DMR12-06351, and ARO grant W911NF-1-11-0110. HZ was supported by the Chinese Scholarship Council and a travel grant from Tongji University.
References
- [1] J.F. Geng and R. P. Behringer, Phys. Rev. Lett 93, 238002 (2004).
- [2] J. Zhang, T. S. Majmudar, A. Tordesillas and R. P. Behringer, Granular Matter 12, 159–172 (2010).
- [3] M. van Hecke, J. Phys: Condens. Matter 22, 033101 (2010).
- [4] A. J. Liu and S. R. Nagel, Nature (London). 396, 21 (1998). b
- [5] C. S. O’Hern, L. E. Silbert, A. J. Liu, and S. R. Nagel, Phys. Rev. E. 68, 011306 (2003).
- [6] A. J. Liu and S. R. Nagel,Soft Matter. 6, 2869-2870 (2010).
- [7] Dapeng Bi, Jie Zhang, Bulbul Chakraborty, and R. P. Behringer, Nature 480 355–358 (2011).
- [8] Jie Ren, Joshua A. Dijksman, and R. P. Behringer, Phys. Rev. Lett 110, 018302 (2013).
- [9] D. Howell, C. Veje, and R. P. Behringer, Phys. Rev. Lett 82, 5241–5244 (1999).
- [10] R. R. Hartley and R. P. Behringer, Nature 421, 928–930 (2003).
- [11] T. S. Majmudar and R. P. Behringer, Nature, 435, 1079–1082 (2005).
- [12] T. S. Majmudar, M.Sperl, S. Luding and R. P. Behringer, Phys. Rev. Lett, 98, 058001 (2007).
- [13] J. Puckett and K. Daniels, Phys. Rev. Lett 110, 058001 (2013).
- [14] Ling Zhang, Jie Zheng, Jie Zhang, private communication (2013).
- [15] The exponent to which the -dependent numerator and denominator are raised, in Eq. 1, can be of any order; one is the simplest that works. The equation is only assumed to be valid between and .
- [16] Hu Zheng, Joshua A. Dijksman, and R. P. Behringer, AIP Conf. Proc. 1542, 465 (2013)
- [17] The static friction correction for the shear force is not accurate enough for the shear force data from the force gauge to aid in determining .
- [18] To normalize the photoelastic response measured at , we use the measured at , because at , the initial state cannot be prepared stress free. This issue does not arise in the floating particle system.
- [19] By non-affine we refer here to the displacements that remain after subtracting the mean shear strain, that is, the linear shear profile, interpolated to a given particle position.
- [20] We do not observe a finite in the experiments by Ren et al.; we attribute this to the subtle difference in driving (wall versus base) that is more isotropic in the articulated base setup than in the wet system.
- [21] F. Boyer, E. Guazzelli, O. Pouliquen, Phys. Rev. Lett. 107, 188301 (2011)
- [22] R. Seto, R. Mari, J. F. Morris, M. M. Denn, Phys. Rev. Lett. 111, 218301 (2013)