11email: andrea.melandri@brera.inaf.it
2 Scuola Normale Superiore, Piazza dei Cavalieri 7, I-56126 Pisa, Italy
3 INAF - Istituto di Astrofisica Spaziale e Fisica Cosmica, Via P. Gobetti 101, I-40129 Bologna, Italy
4 INFN, Sezione di Pisa, Largo Pontecorvo 3, I-56127 Pisa, Italy
5 ASI, Science Data Centre, Via del Politecnico snc, I-00133 Roma, Italy
6 INAF - Osservatorio Astronomico di Roma, Via Frascati 33, I-00040, Monte Porzio Catone (RM), Italy
7 INAF - Osservatorio Astronomico di Capodimonte, Salita Moiariello 16, I-80131 Napoli, Italy
8 ICRANET, Piazza della Repubblica 10, I-65122 Pescara, Italy
9 ARI, Liverpool John Moores University, IC2 Liverpool Science Park 146 Brownlow Hill, Liverpool, L3 5RF, UK
10 INAF - Osservatorio Astronomico di Padova, Vicolo dell’Osservatorio 5, I-35122 Padova, Italy
11 Max-Planck Institute for Astrophysics, Garching, Karl-Schwarzschild-Str. 1, Postfach 1317, D-85741 Garching, Germany
12 Centre of Astrophysics and Cosmology, Science Institute, University of Iceland, Dunhagi 5, IS-107, Reykjavik, Iceland
13 Department of Physics, University of Warwick, Coventry, CV4 7AL, UK
14 European Southern Observatory, Karl-Schwarzschildstrasse 2, D-85748 Garching bei München, Germany
15 Departamento de Ciencias Fisicas, Universidad Andres Bello, Avda. Republica 252, Santiago, Chile
16 Instituto de Astrofísica de Andalucía, Glorieta de la Astronomía s/n, 18008, Granada, Spain
17 University of California, Berkeley, Space Sciences Laboratory, 7 Gauss Way, Berkeley, CA 94720-7450, USA
18 Dark Cosmology Centre, Niels Bohr Institute, University of Copenhagen, Juliane Maries Vej 30, 2100, Copenhagen, Denmark
19 Thüringer Landessternwarte Tautenburg, Sternwarte 5, 07778, Tautenburg, Germany
20 INAF - Istituto di Astrofisica Spaziale e Fisica Cosmica Milano, via E. Bassini 15, I-20133 Milano, Italy
21 Department of Physics and Astronomy, University of Leicester, University Road, Leicester LE1 7RH, UK
22 National Astronomical Observatory of Japan, Mitaka, Tokyo 181-8588, Japan
23 GEPI, Observatoire de Paris, CNRS, Univ. Paris Diderot, 5 Place Jules Jannsen, F-92195, Meudon, France
Diversity of GRB energetics vs. SN homogeneity: supernova 2013cq associated with the gamma-ray burst 130427A††thanks: Based on observations made with the VLT, operated on the mountain of Cerro Paranal in Chile under program 091.D-0291(A) and with the TNG, operated on the island of La Palma by the Fundación Galileo Galilei of the INAF (Instituto Nazionale di Astrofisica) at the Spanish Observatorio del Roque de los Muchachos of the Instituto de Astrofísica de Canarias under program A27TAC5.
Abstract
Aims. Long-duration gamma-ray bursts (GRBs) have been found to be associated with broad-lined type-Ic supernovae (SNe), but only a handful of cases have been studied in detail. Prompted by the discovery of the exceptionally bright, nearby GRB 130427A (redshift = 0.3399), we aim at characterising the properties of its associated SN 2013cq. This is the first opportunity to test directly the progenitors of high-luminosity GRBs.
Methods. We monitored the field of the Swift long duration GRB 130427A using the 3.6-m TNG and the 8.2-m VLT during the time interval between 3.6 and 51.6 days after the burst. Photometric and spectroscopic observations revealed the presence of the type Ic SN 2013cq.
Results. Spectroscopic analysis suggests that SN 2013cq resembles two previous GRB-SNe, SN 1998bw and SN 2010bh associated with GRB 980425 and XRF 100316D, respectively. The bolometric light curve of SN 2013cq, which is significantly affected by the host galaxy contribution, is systematically more luminous than that of SN 2010bh (2 mag at peak), but is consistent with SN 1998bw. The comparison with the light curve model of another GRB-connected SN 2003dh, indicates that SN 2013cq is consistent with the model when brightened by 20%. This suggests a synthesised radioactive 56Ni mass of . GRB 130427A/SN 2013cq is the first case of low- GRB-SN connection where the GRB energetics are extreme ( erg). We show that the maximum luminosities attained by SNe associated with GRBs span a very narrow range, but those associated with XRFs are significantly less luminous. On the other hand the isotropic energies of the accompanying GRBs span 6 orders of magnitude (1048 erg 1054 erg), although this range is reduced when corrected for jet collimation. The GRB total radiated energy is in fact a small fraction of the SN energy budget.
Key Words.:
Gamma-ray burst: general - supernovae: individual: SN 2013cq1 Introduction
The majority of nearby under-energetic long duration gamma-ray bursts and X-ray flashes (GRBs and XRFs111XRFs are a softer version of GRBs, having integrated spectra peaking around 5-10 keV instead of 100-1000 keV. with total isotropic energy 1051 erg) are associated with with highly energetic SNe (Mazzali et al. 2006a ; Mazzali et al. 2006b ). The study of the supernova in these cases is facilitated by the weakness of the GRB afterglow and the relatively small distance.
For 0.3 the accuracy of optical photometric and spectroscopic monitoring is satisfactory and individual atomic species can be identified in the SN spectrum (Galama et al. (1998); Patat et al. (2001); Hjorth et al. (2003); Stanek et al. (2003); Soderberg et al. (2004); Malesani et al. (2004); Ferrero et al. (2006); Pian et al. (2006); Sollerman et al. (2006); Mirabal et al. (2006); Bersier et al. (2006); Cano et al. 2011a ; Bufano et al. (2012); Melandri et al. (2012); Schulze et al. (2014)). At higher redshifts, up to 1, the presence of an associated SN is inferred from the detection of a “rebrightening” in the late afterglow light curve due to the emerging SN component (Bloom et al. (1999); Castro-Tirado Gorosabel (1999); Galama et al. (2000); Castro-Tirado et al. (2001); Lazzati et al. (2001); Masetti et al. (2003); Zeh et al. (2004); Gorosabel et al. (2005); Bersier et al. (2006); Cobb et al. (2006); Soderberg et al. (2006); Tanvir et al. (2010); Cano et al. 2011b ). In a few cases, single epoch spectra obtained close to the peak of this rebrightening show SN features similar to those exhibited by GRB-accompanying SNe at lower redshifts (Della Valle et al. (2003); Garnavich et al. (2003); Greiner et al. (2004); Soderberg et al. (2005); Berger et al. (2011); Della Valle et al. 2006a ; Sparre et al. (2011); Jin et al. (2013)) then confirming the association of the GRB with a SN event.
All GRBs associated with SNe at 0.3 so far discovered show low isotropic energy, typically less than erg, with GRB 030329/SN 2003dh (Hjorth et al. (2003); Stanek et al. (2003); Matheson et al. (2003)) being the only exception. This is a relatively nearby GRB ( = 0.168) with an isotropic energy of erg (Vanderspek et al. (2004)) which falls in the faint tail of the “cosmological” GRBs energy distribution (e.g. Amati et al. (2002); Amati et al. (2008)). The long nearby GRB 130427A is exceptional and outstanding. It showed a huge isotropic energy ( erg; Maselli et al. (2014); Amati et al. 2013a ) and at the same time the association with a SN was clear (SN 2013cq; de Ugarte Postigo et al. (2013)). GRB 130427A follows the well-known Amati (-, Amati et al. (2002)) and Yonetoku (-, Yonetoku et al. (2004)) correlations (Maselli et al. (2014)). This made the study of the properties and evolution of SN 2013cq particularly interesting, since no very energetic GRB has ever been detected at relatively low redshift, so that this is the first occurrence of connection between a SN and a GRB that has all the characteristics of a cosmological event.
In this paper we present the results of our photometric and spectroscopic campaign, covering 1.5 months, carried out with the VLT and the TNG. Throughout the paper we assume a standard cosmology with = 72 km s-1 Mpc-1, = 0.27, and = 0.73.
2 GRB 130427A / SN 2013cq
GRB 130427A was a long and extremely bright GRB ( s; Barthelmy et al. (2013)) that triggered independently the Fermi satellite at 07h 47m 06s.42 UT (von Kienlin (2013); Zhu et al. (2013)) and the Swift satellite at 07h 47m 57s.5 UT (Maselli et al. (2013)), and attained the highest fluences observed in the -ray band for both satellites ( (15-150 keV) erg cm-2 and (0.01-20 MeV) erg cm-2). The high-energy emission of GRB 130427A was also detected by several orbiting observatory, i.e. MAXI (Kawamuro et al. (2013)), INTEGRAL (Pozanenko et al. (2013)), Konus-Wind (Golenetskii et al. (2013)), AGILE (Verrecchia et al. (2013)), Suzaku (Akiyama et al. (2013)), RHESSI (Smith et al. (2013)) and Mars Odyssey222http://www.ssl.berkeley.edu/ipn3/masterli.txt. This event has been the focus of several recently published studies (Ackermann et al. (2014); Preece et al. (2014); Maselli et al. (2014); Vestrand et al. (2014); Kouveliotou et al. (2013); Laskar et al. (2013); Perley et al. (2013); Panaitescu et al. (2013); Bernardini et al. (2014)). The redshift was measured to be = 0.3399 0.0002 (Levan et al. 2013a ; Xu et al. 2013a ; Flores et al. (2013)).
In the optical band a bright flash, probably due to a reverse shock component, was observed simultaneously with the high energy emission ( MeV) at very early times. Subsequently, the GRB afterglow emission can be described by the contribution of both reverse and forward shocks (Vestrand et al. (2014); Panaitescu et al. (2013); Maselli et al. (2014); Perley et al. (2013); Levan et al. 2013b ).
GRB 130427A exploded in a relatively bright, extended host galaxy, catalogued in the Sloan Digital Sky Survey (SDSS J113232.84+274155.4), that showed the typical properties of the nearby GRB host population (Savaglio et al. (2009)). Its stellar mass ( ) and mean population age ( Myr) indicate a blue, young and low-mass galaxy (Perley et al. (2013)). The afterglow of GRB 130427A is slightly offset from the centroid of its host galaxy (, corresponding to kpc in projection at the redshift of the GRB) and apparently there is no highly star forming region underlying the GRB (Levan et al. 2013b ).
Despite its relatively low redshift, which favoured the detection and follow-up of the associated SN 2013cq in the -band (Xu et al. 2013b ), GRB 130427A displayed all properties of more commonly observed high-redshift bursts. The extraordinarily high observed energetics of GRB 130427A and its closeness motivated our optical multi-band search and intensive follow-up of its associated supernova.
3 Observations and data reduction
We observed the field of SN 2013cq with the ESO 8.2-m Very Large Telescope (VLT) at Paranal Observatory equipped with FORS2 (imaging in the filters and spectroscopy) and with the Italian 3.6-m Telescopio Nazionale Galileo (TNG) equipped with DOLORES (imaging in the filters) from 3.6 to 51.6 days after the burst. Tables 1 and LABEL:logmag summarise our observations.
3.1 Imaging
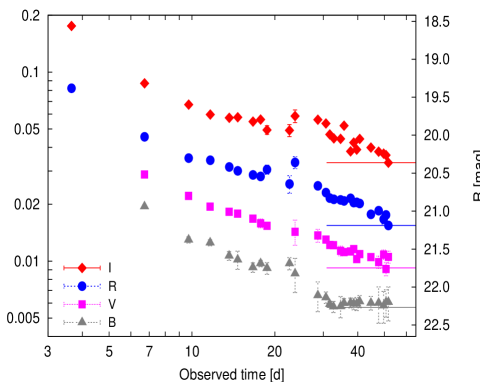
Image reduction, including de-biasing and flat-fielding, was carried out following standard procedures. Images were calibrated using a set of SDSS catalogued stars acquired with SDSS filters (TNG observations) and with respect to standard fields in the filters (VLT observations). We performed differential photometry at the position of the optical afterglow, using an aperture of 2 FWHM of individual frames, large enough to include also the contribution of the underlying host galaxy. Observed light curves are shown in Fig. 1.
During our campaign it was not possible to acquire a deep image of the host galaxy alone because the GRB optical counterpart dominates the emission at early epochs and may still contribute significantly at late epochs. Moreover the offset of the SN with respect to the host galaxy is only ″(Levan et al. 2013b ), always comparable with the seeing of our images (see Table 3). Therefore, we used the SDSS magnitudes of the host galaxy that are , , , , . We converted these magnitudes into Johnson/Cousins magnitudes using the transformation equations in Jester et al. (2005), obtaining the final values , , , . These values are consistent with Perley et al. (2013) and shown in Fig. 1 as horizontal lines.
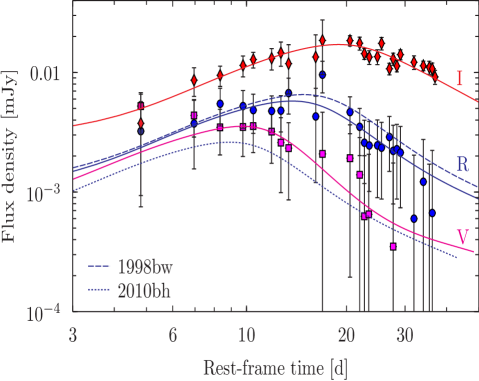
We subtracted the estimated values for the host galaxy from our data, corrected for Galactic extinction (using the catalogued value of = 0.02 mag; Schlegel et al. (1998); Schlafly Finkbeiner (2011)), applied k-corrections using our spectra (only and filters, because the spectra do not cover the redshifted and filters central wavelengths) and then subtracted the afterglow component. The temporal behaviour of the afterglow in each filter, where the early light curves were modelled with a forward relativistic shock into the circumstellar medium, can be described with a steepening power-law having decay indices of 0.8 and 1.5 before and after a break located at days (Laskar et al. (2013); Maselli et al. (2014); Perley et al. (2013); Xu et al. 2013b ). Our data cover the phase after this temporal break, and are consistent with the above time decay until a week after explosion, when the contribution from SN 2013cq becomes increasingly important. The afterglow model was then subtracted from the host-subtracted light curves and the residual, which is attributed to SN 2013cq only, was corrected for intrinsic absorption following Xu et al. (2013b). These authors estimated the value E = 0.05 mag from the detection of Na I D 5890 5896 absorption lines. The final corrected light curves are reported in Fig. 2. The -band light curve is heavily contaminated by the host galaxy and therefore not meaningful and not shown. The de-reddened magnitudes have been transformed into monochromatic fluxes using the zeropoints in Fukugita et al. (1995).
3.2 Spectroscopy
| Date | S/N | Grism | |||
|---|---|---|---|---|---|
| (days) | (s) | (days) | |||
| 2013 May 4 | 6.737 | 1900 | 13-28 | 300V | +5.02 |
| 2013 May 4 | 6.756 | 1900 | 2-6 | 300I | +5.04 |
| 2013 May 7 | 9.735 | 1900 | 4-10 | 300V | +7.26 |
| 2013 May 10 | 13.669 | 1900 | 6-10 | 300I | +10.20 |
| 2013 May 12 | 15.660 | 2900 | 5-12 | 300V | +11.68 |
| 2013 May 14 | 16.680 | 21800 | 10-20 | 300V | +12.44 |
| 2013 May 16 | 18.696 | 2900 | 3-9 | 300V | +13.95 |
| 2013 May 25 | 28.676 | 2900 | 3-5 | 300V | +21.40 |
| 2013 May 27 | 30.663 | 21800 | 7-13 | 300V | +22.88 |
| 2013 May 28 | 31.665 | 21800 | 10-15 | 300V | +23.63 |
VLT/FORS2 spectroscopy was carried out using the 300V grism, covering the range 4450–9500 Å (corresponding to 3320–7090 Å in the GRB rest-frame). For two epochs we also used the 300I grism, covering the range 6000–11000 Å (4478–8210 Å rest-frame). We used in all cases a slit, resulting in an effective resolution at the central wavelengths and , respectively. The spectra were extracted using standard procedures within the packages ESO-MIDAS333http://www.eso.org/projects/esomidas/ and IRAF444http://iraf.noao.edu/. A He-Ar lamp and spectrophotometric stars were used to calibrate the spectra in wavelength and flux, respectively. We accounted for slit losses by matching the flux-calibrated spectra to our simultaneous multi-band photometry.
After subtracting the contribution of the host galaxy using a spline interpolation to the SDSS magnitudes, we corrected the residual for Galactic extinction (with the extinction curve of Cardelli et al. (1989)). We also applied the correction for the intrinsic reddening following Xu et al. (2013b) as in section 3.1. We model the afterglow spectrum with a single power-law as
| (1) |
where we fixed to the rest-frame flux at 6588 (corresponding to the -band), is the power-law normalisation and the spectral index = 1.5 (Maselli et al. (2014), Perley et al. (2013)). Telluric absorption features and the noisier parts of the spectra ( 3400 and 6800 for the 300V grism and 4600 for the 300I grism) have been omitted. A clearly spurious feature has been deleted from the spectrum acquired at rest-frame days.
4 Results
4.1 Optical light curves
Inspection of Fig. 1 shows the presence of a rebrightening at 20 days, more pronounced in the redder filters, that is the tell-tale signature of an underlying SN, first identified by Xu et al. (2013a) and named SN 2013cq (de Ugarte Postigo et al. (2013)). In Fig. 2 we show the final light curves of SN 2013cq.
Also plotted in Fig. 2 are the k-corrected, -band light curves of SN 1998bw and SN 2010bh, which were associated with GRB 980425 (Galama et al. (1998)) and XRF 100316D (Starling et al. (2011); Cano et al. 2011a ; Bufano et al. (2012); Olivares et al. (2011)), respectively, as they would appear if they occurred at a redshift of = 0.3399. In order to determine the rest-frame peak times in each filter, we adopted the formalism of Cano (2013), by which the optical light curves of the well observed type Ic SN 1998bw are used as templates to describe SNe with less well sampled light curves. The solid lines in Fig. 2 are the k-corrected light curves of SN 1998bw in the relevant bands, stretched in time and flux to match SN 2013cq. The scaling factors were obtained with a best-fit to the data of SN 2013cq, following Cano (2013). The peaks of these template light curves represent our best estimates of the light maxima of SN 2013cq: , and days after the burst. We note that the errors are formal uncertainties returned by the fit and are likely to underestimate the real uncertainties by about a factor of 2. Our best-fit -band maximum flux and time agree with those determined by Xu et al. (2013b) within the error bars. The SN 2013cq flux maximum in the -band is found to be slightly fainter ( mag) than SN 1998bw.
It is commonly observed in SNe of all types, including nearby Ic SNe and GRB/XRF SNe (Richmond et al. (1996); Foley et al. (2003); Mazzali et al. (2002); Mazzali et al. (2007); Valenti et al. (2008); Galama et al. (1998); Soderberg et al. (2004); Soderberg et al. (2006); Bufano et al. (2012)), that the light maximum is reached later in redder bands. In SN 2013cq this temporal evolution is particularly fast, so that the rise in the band is rapid and resembles the one of XRF SNe (Pian et al. (2006); Ferrero et al. (2006); Mirabal et al. (2006); Bufano et al. (2012); Olivares et al. (2011)), while in and bands the rise is more similar to that of SNe associated with low- under-luminous GRBs and classical GRBs at higher redshifts (Galama et al. (1998); Patat et al. (2001); Garnavich et al. (2003); Malesani et al. (2004); Della Valle et al. 2006b ; Clocchiatti et al. (2011); Melandri et al. (2012)).
4.2 Optical spectra
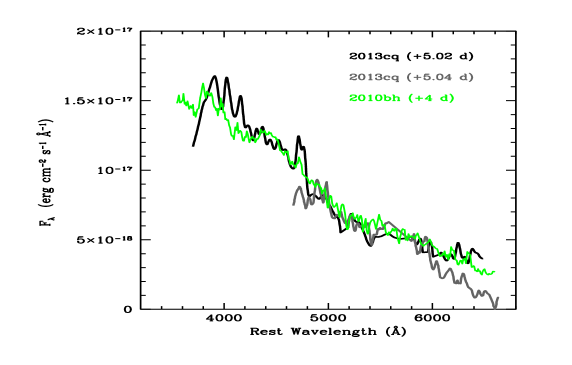
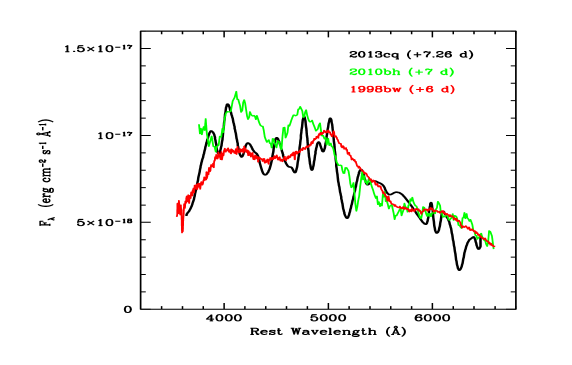
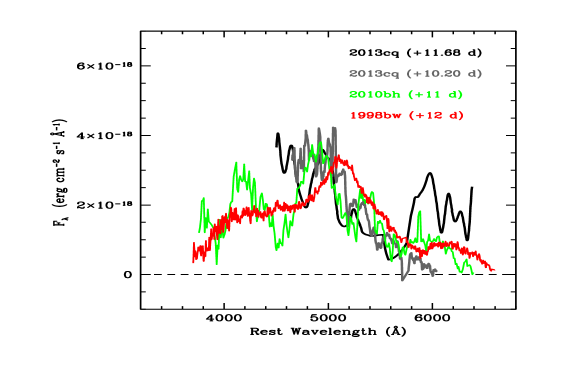
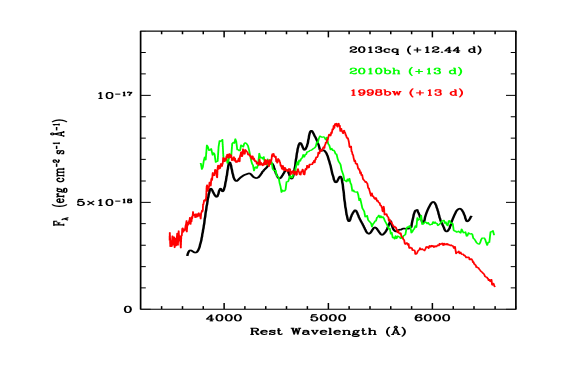
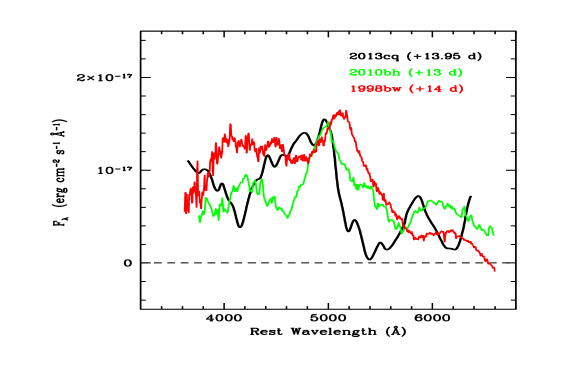
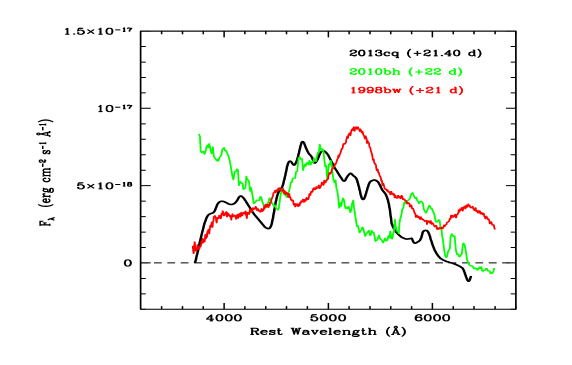
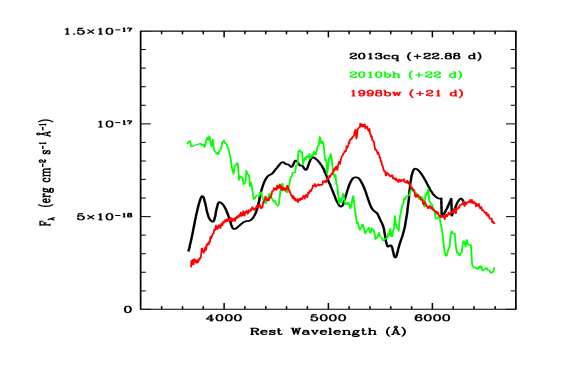
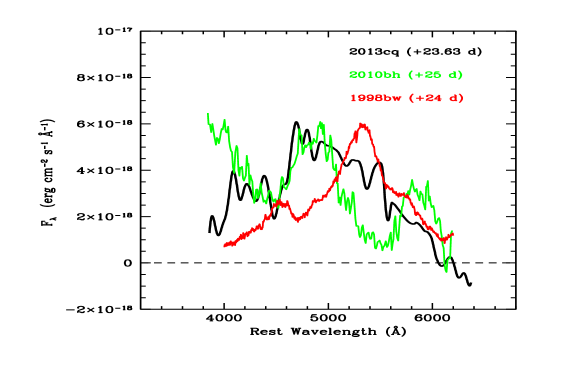
In Fig. 3 we show the FORS2 spectra acquired between 5.0 and 23.6 rest-frame days after the burst event.
The quality of our spectra is not sufficient for the accurate measurement of individual absorption features and for the estimate of photospheric velocities, but only for a general comparison with the spectra of high kinetic energy Type Ic SNe. Among these we have selected some with good S/N and/or spectral coverage: the GRB SNe 1998bw (Patat et al. (2001)) and 2003dh (Hjorth et al. (2003); Mazzali et al. (2002)), XRF SNe 2006aj (Pian et al. (2006)) and 2010bh (Bufano et al. (2012)) and the broad-lined Ic SN2010ah (Mazzali et al. (2013)). A similarity is found with SN 2010bh (see also Xu et al. 2013b ) and with SN 1998bw and for clarity we show only the comparison with these two SNe in Fig. 3. The spectra of SN 2010bh are a good match of those of SN 2013cq, although those of SN 1998bw are a better representation in the blue, especially at phases +12.44, +21.40, +22.88 days, suggesting strong line-blocking from high velocity material.
4.3 Bolometric light curve
We have constructed a bolometric light curve in the range 3000-10000 using the available photometry. For each epoch we followed the reduction procedure described in section 3.
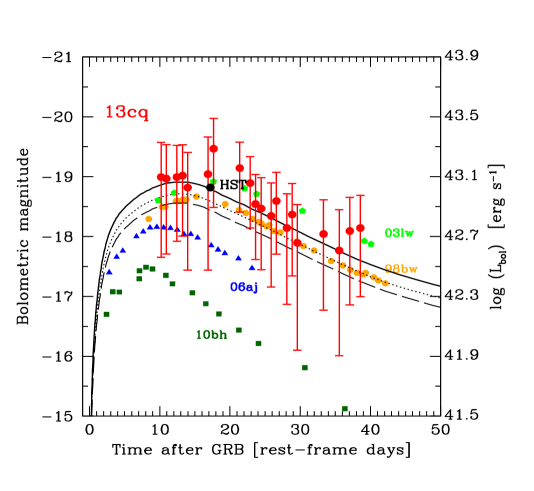
Then we fitted with a spline function the residual monochromatic light curves, which represent the supernova component, and integrated the broad-band flux at each photometric observation epoch. The flux was linearly extrapolated blueward of the -band flux down to 3000 and redward of the -band flux to 10000 . The result is reported in Fig. 4. The errors associated with our photometry, galaxy measurement, afterglow fit and intrinsic absorption were propagated and summed in quadrature. These are extremely large at the earlier epochs, so that the points have been omitted in the figure. For comparison, and as a consistency check, we report the bolometric point obtained from the HST measurements of May 20, 2013 (Levan et al. 2013b ). We also compare the bolometric light curve of SN 2013cq with those of SN 1998bw (Patat et al. (2001)), SN 2006aj (Pian et al. (2006)) and with the models for SN 2003dh (Mazzali et al. (2003)) and SN 2012bz (Melandri et al. (2012)). The bolometric light curve of SN 1998bw was constructed in the same rest-frame band (3000-10000 ) and using a Galactic extinction of = 0.052 mag as recently reported by Schlafly Finkbeiner (2011). It does not differ significantly from that reported in Pian et al. (2006) which was corrected for a lower estimate of Galactic extinction and included a 15% flux correction for NIR contribution. The model of the light curve of SN 2003dh (Mazzali et al. (2003)) was rescaled by 20% to match the HST point, which is very accurate. The rescaled model also fits well the rest of the light curve, within the large errors. This suggests that the 56Ni mass synthesized by SN 2013cq is 20% higher than that of SN 2003dh, which leads to an estimate of (Mazzali et al. 2006a ).
| GRB - SN | Refs. | |||
| ( erg) | ||||
| 980425 - 1998bw | 0.0085 | 0.00010 0.00002 | -18.65 0.20 | 1,2 |
| 030329 - 2003dh | 0.1687 | 1.5 0.3 | -18.71 0.15 | 3,4 |
| 031203 - 2003lw | 0.1055 | 0.010 0.004 | -18.92 0.20 | 5,1 |
| 060218 - 2006aj | 0.0334 | 0.0053 0.0003 | -18.16 0.20 | 4,6,7 |
| 100316D - 2010bh | 0.0591 | 0.007 0.003 | -17.50 0.25 | 8,9 |
| 120422A - 2012bz | 0.283 | 0.024 0.008 | -18.56 0.15 | 10 |
| 130427A - 2013cq | 0.3399 | 81.0 8.0 | -18.91 0.20 | 11,2 |
| 130702A - 2013dx | 0.145 | 0.065 0.010 | -18.51 0.15 | 12,13 |
| Refs: 1-Amati et al. (2006); 2-This work; 3-Deng et al. (2005); 4-Amati et al. (2008); | ||||
| 5-Mazzali et al. (2006a); 6-Pian et al. (2006); 7-Ferrero et al. (2006); | ||||
| 8-Bufano et al. (2012); 9-Starling et al. (2011); 10-Melandri et al. (2012); | ||||
| 11-Maselli et al. 2014; 12-D’Elia et al. (2014, in preparation); | ||||
| 13-Amati et al. (2013b; note that uncertainty on is amended here). | ||||
4.4 GRBs-SNe properties and correlations
GRB 130427A is the brightest GRB detected by Swift/BAT, one of the most energetic ever ( erg, keV), and the most energetic GeV emitting GRB ( 125 GeV in rest-frame; Ackermann et al. (2014)). GRB 130427A is located in a yet unexplored region of the - plane for low- GRBs associated with SNe, yet it follows very well the Amati and Yonetoku correlations (see Fig. S6 in Maselli et al. (2014)). Prior to SN 2013cq only one nearby supernova was associated with a GRB having energetics similar to cosmological gamma-ray bursts, i.e. GRB 030329 ( erg, keV; Vanderspek et al. (2004)). However, the properties of the GRB 030329 were less extreme than those observed for GRB 130427A.
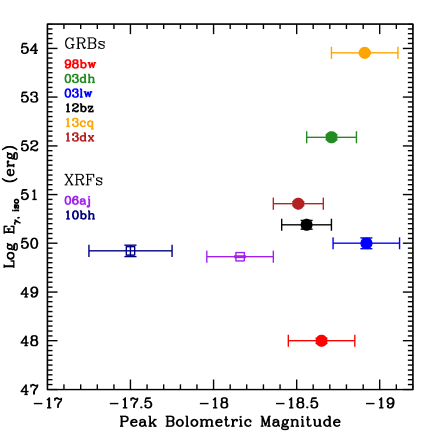
A striking result when comparing GRB and SN properties (see Table 2) is that, while the values of Eiso of the GRB span nearly 6 orders of magnitude (3 after correcting for collimation effects) the SNe maximum luminosities (), that trace the mass of radioactive 56Ni and correlate, like the SN kinetic energies, with the progenitor masses (Mazzali et al. (2013)), are distributed in a narrow range ( mag) and can virtually be considered roughly constant. On the other hand, nearby XRFs have total isotropic-equivalent energies similar to those of the less energetic GRBs, but their SNe have lower luminosities (Fig. 5).
5 Conclusion
The -band light curve reported by Xu et al. (2013b, see also Perley et al. (2013)) is 0.2 mag fainter than that of SN 1998bw at maximum (Patat et al. (2001)). Our analysis seems to confirm this (Fig. 2). However, the bolometric light curve (Fig. 4), and especially the accurate HST measurement (Levan et al. 2013b ), suggest that SN 2013cq is marginally brighter than SN 1998bw and significantly more luminous ( mag) than SN 2010bh. This points to the need of referring to bolometric rather than monochromatic information in the comparison of SN physical quantities.
Although the S/N of the spectra is very limited, we note some similarity with SN 2010bh (see also Xu et al. 2013b ) and with SN 1998bw. In either case, this fact points to a classification of SN 2013cq as a broad line type Ic SN, as seen so far for all GRB/XRF SNe, and in turn to a massive, highly envelope-stripped progenitor.
This is in line with the finding that SNe associated with GRBs – both underluminous and highly energetic – have all comparable luminosities and are more luminous than the two known low- spectroscopically identified XRF/SNe 2006aj and 2010bh (Melandri et al. (2012)). The extended host galaxy of GRB 130427A/SN 2013cq is similar to the host galaxies of GRB 100316D/SN 2010bh and GRB 980425/SN 1998bw. The other ones known at low redshift are instead associated with smaller galaxies (Starling et al. (2011)). However there is no apparent correlation between the brightness of the GRB, the associated SNe and their host galaxies (Levesque et al (2010)).
Owing to the limited S/N of the spectra of SN 2013cq, it is difficult to evaluate the photospheric velocity evolution of this SN and therefore its kinetic energy. Xu et al. (2013b) estimate erg, i.e. similar to SN 1998bw, which is plausible, considering the similarity of spectra and bolometric light curve. The data reported by Maselli et al. (2013b, their Fig. 2) show the presence of a break in the afterglow light curve, which they interpret as a jet break. If this is the case (jet collimation-correction can be complex, Campana et al. (2007); Perley et al. (2013)), after correcting for the corresponding jet opening angle of about 3°, the total energy of GRB 130427A decreases to 3 erg, which is less than 1 of the kinetic energy associated with its SN. A similar finding has been reported for other GRB-SN associations (Woosley Bloom (2006), Amati et al. (2007)). Therefore it is very plausible that the SN may drive the GRB jet. The monitoring of nearby energetic GRBs is a critical test-bed for confirming SN-driven GRB models or opening more exotic (and more energetic) scenarios based on black hole formation.
Acknowledgements.
We thank the anonymous referee for valuable comments and suggestions that improved the paper. We thank the TNG staff, in particular G. Andreuzzi, L. Di Fabrizio, and M. Pedani, for their valuable support with TNG observations, and the Paranal Science Operations Team, in particular H. Boffin, S. Brillant, C. Cid, O. Gonzales, V. D. Ivanov, D. Jones, J. Pritchard, M. Rodrigues, L. Schmidtobreick, F. J. Selman, J. Smoker and S. Vega. The Dark Cosmology Centre is funded by the Danish National Research Foundation. F.B. acknowledges support from FONDECYT through Postdoctoral grant 3120227 and from Project IC120009 ”Millennium Institute of Astrophysics (MAS)” of the Iniciativa Cient fica Milenio del Ministerio de Economía, Fomento y Turismo de Chile. A.J.C.T. thanks the Spanish Ministry’s Research Project AYA 2012-39727-C03-01. R.L.C.S. is supported by a Royal Society fellowship. D.M. acknowledges the Instrument Center for Danish Astrophysics (IDA) for support. This research was partially supported by contracts ASI INAF I/004/11/1, ASI INAF I/088/06/0, INAF PRIN 2011 and PRIN MIUR 2010/2011.References
- Ackermann et al. (2014) Ackermann, M., Ajello, M., Asano, K, et al. 2014, Science, 343, 42
- Amati et al. (2002) Amati, L., Frontera, F., Tavani, M., et al. 2002, AA, 390, 81
- Amati et al. (2006) Amati, L. 2006, MNRAS, 372, 233
- Amati et al. (2007) Amati, L., Della Valle, M., Frontera, F., et al. 2007, AA, 463, 913
- (5) Amati, L., et al. 2013a, GCN Circ. 14503
- (6) Amati, L., et al. 2013b, GCN Circ. 15025
- Amati et al. (2008) Amati, L., Guidorzi, C, Frontera, F., et el. 2008, MNRAS, 391, 577
- Akiyama et al. (2013) Akiyama, M., et al. 2013, GCN Circ. 14524
- Barthelmy et al. (2013) Barthelmy, S., et al. 2013, GCN Circ. 14470
- Berger et al. (2011) Berger, E., Chornock, R., Holmes, T. R., et al. 2011, ApJ, 743, 204
- Bernardini et al. (2014) Bernardini, M. G., Campana, S., Ghisellini, G., et al. 2014, MNRAS, 439, 80
- Bersier et al. (2006) Bersier, D., Fruchter, A. S., Strolger, L.-G., et al. 2006, ApJ, 643, 284
- Bloom et al. (1999) Bloom, J. S., Kulkarni, S. R., Djorgovski, S. G., et al. 1999, Nature, 401, 453
- Bufano et al. (2012) Bufano, F., Pian, E., Sollerman, J., et al. 2012, ApJ, 753, 67
- Campana et al. (2007) Campana, S., et al. 2007, AA, 472, 395
- (16) Cano, Z., Bersier, D., Guidorzi, C., et al. 2011a, ApJ, 740, 41
- (17) Cano, Z., Bersier, D., Guidorzi, C., et al. 2011b, MNRAS, 413, 669
- Cano (2013) Cano, Z. 2013, MNRAS, 434, 1098
- Cardelli et al. (1989) Cardelli, J. A., Clayton, G. C., Mathis, J. 1989, ApJ 345, 245
- Castro-Tirado Gorosabel (1999) Castro-Tirado, A. J., Gorosabel, J. 1999, AASS, 138, 449
- Castro-Tirado et al. (2001) Castro-Tirado, A. J., Sokolov, V. V., Gorosabel, J., et al. 2001, AA, 370, 398
- Clocchiatti et al. (2011) Clocchiatti, A., Suntzeff, N. B., Covarrubias, R., Candia, P., 2011, AJ, 141, 163
- Cobb et al. (2006) Cobb, B. E., Bailyn, C. D., van Dokkum, P. G., Natarajan, P., 2006, ApJ, 645, 113
- de Ugarte Postigo et al. (2013) de Ugarte Postigo, A., Xu, D., Leloudas, G., et al. 2013, CBET 3529
- Della Valle et al. (2003) Della Valle, M., Malesani, D., Benetti, S., et al. 2003, AA, 406, L33
- (26) Della Valle, M., Chincarini, G., Panagia, N., et al. 2006a, Nature, 444, 1050
- (27) Della Valle, M., Malesani, D., Bloom, J. S., et al. 2006b, ApJ, 642, 103
- Deng et al. (2005) Deng, J, Tominaga, N., Mazzali, P. A., Maeda, K., Nomoto, K. 2005, ApJ, 624, 898
- Ferrero et al. (2006) Ferrero, P., Kann, D. A., Zeh, A., et al. 2006, AA, 457, 857
- Flores et al. (2013) Flores, H., et al. 2013, GCN Circ. 14491
- Foley et al. (2003) Foley, R. J., et al. 2003, PASP, 115, 1220
- Fukugita et al. (1995) Fukugita, M., Shimasaku, K., Ichikawa, T. 1995, PASP, 107, 945
- Galama et al. (1998) Galama, T. J., Vreeswijk, P. M., van Paradijs, J., et al. 1998, Nature, 395, 670
- Galama et al. (2000) Galama, T. J., Tanvir, N., Vreeswijk, P. M., et al. 2000, ApJ, 536, 185
- Garnavich et al. (2003) Garnavich, P. M., Stanek, K. Z., Wyrzykowski, L., et al. 2003, ApJ, 582, 924
- Golenetskii et al. (2013) Golenetskii, S., et al. 2013, GCN Circ. 14487
- Gorosabel et al. (2005) Gorosabel, J., Fynbo, J. P. U., Fruchter, A., et al. 2005, AA, 437, 411
- Greiner et al. (2004) Greiner, J., Klose, S., Salvato, M., et al. 2003, ApJ 599, 1223
- Hjorth et al. (2003) Hjorth, J., Sollerman, J., Moller, P., et al. 2003, Nature, 423, 847
- Jester et al. (2005) Jester, S., Schneider, D. P., Richards, G. T., et al. 2005, AJ, 130, 873
- Jin et al. (2013) Jin, Z.-P., Covino, S., Della Valle, M., et al. 2013, ApJ, 774, 114
- Kawamuro et al. (2013) Kawamuro, T., et al. 2013, GCN Circ. 14462
- Kouveliotou et al. (2013) Kouveliotou, C. Granot, J. Racusin, J. L., et al. 2013, ApJ, 779, 1
- Laskar et al. (2013) Laskar, T., Berger, E., Zauderer, B. A., et al. 2013, ApJ, 776, 119
- Lazzati et al. (2001) Lazzati, D., Covino, S., Ghisellini, G., et al. 2001, AA, 378, 996
- (46) Levan, A. J., et al. 2013a, GCN Circ. 14455
- (47) Levan, A. J., Tanvir, N. R., Fruchter, A. S., et al. 2013b, ApJL (submitted) [arXiv:1307.5338]
- Levesque et al (2010) Levesque, E. M., Soderberg, A. M., Kewley, L. J., Berger, E. 2010, ApJ, 725, 1337
- Malesani et al. (2004) Malesani, D., Tagliaferri, G., Chincarini, G., et al. 2004, ApJ, 609, 5
- Maselli et al. (2013) Maselli, A., et al. 2013, GCN Circ. 14448
- Maselli et al. (2014) Maselli, A., Melandri, A., Nava, L., et al. 2014, Science, 343, 48
- Masetti et al. (2003) Masetti, N., Palazzi, E., Pian, E., et al. 2003, AA, 404, 465
- Matheson et al. (2003) Matheson, T., Garnavich, P. M., Stanek, K. Z., et al. 2003, ApJ, 599, 394
- Mazzali et al. (2002) Mazzali, P. A., Deng, J., Maeda, K., et al. 2002, ApJ, 572, 61
- Mazzali et al. (2003) Mazzali, P. A., Deng, J., Tominaga, N., et al. 2003, ApJ, 599, 95
- (56) Mazzali, P. A., Deng, J., Pian, E., et al. 2006a, ApJ, 645, 1323
- (57) Mazzali, P. A., Deng, J., Nomoto, K., et al. 2006b, Nature, 442, 1018
- Mazzali et al. (2007) Mazzali, P. A., Kawabata, K. S., Maeda, K., et al. 2007, ApJ, 670, 592
- Mazzali et al. (2013) Mazzali, P. A., Walker, E. S., Pian, E., et al. 2013, MNRAS, 432, 2463
- Melandri et al. (2012) Melandri, A., Pian, E., Ferrero, P., et al. 2012, AA, 547, 82
- Mirabal et al. (2006) Mirabal, N., Halpern, J. P., An, D., Thorstensen, J. R, Terndrup, D. M., 2006, ApJ, 643, 99
- Olivares et al. (2011) Olivares, E. F., Greiner, J., Schady, P., et al. 2011, PIAU, 7, 375
- Panaitescu et al. (2013) Panaitescu, A., Vestrand, W. T., Woźniak, P., 2013, MNRAS, 436, 3106
- Patat et al. (2001) Patat, F., Cappellaro, E., Danziger, J., et al. 2001, ApJ, 555, 900
- Perley et al. (2013) Perley, D. A., Cenko, S. B., Corsi, A., et al. 2013, ApJ, 781, 37
- Pian et al. (2006) Pian, E., Mazzali, P. A., Masetti, N., et al. 2006, Nature, 442, 1011
- Pozanenko et al. (2013) Pozanenko, A., et al. 2013, GCN Circ. 14484
- Preece et al. (2014) Preece, R., Burgess, J. M., von Kienlin, A., et al. 2014, Science, 343, 51
- Richmond et al. (1996) Richmond, M. W., van Dyk, S. D., Ho, W., et al. 1996, AJ, 111, 327
- Savaglio et al. (2009) Savaglio, S, Glazebrook, K., Le Borgne, D. 2009, ApJ, 691, 182
- Schlafly Finkbeiner (2011) Schlafly, E. F., Finkbeiner, D. P. 2011, ApJ, 737, 103
- Schlegel et al. (1998) Schlegel, D. J., Finkbeiner, D. P., Davis, M. 1998, ApJ, 500, 525
- Schulze et al. (2014) Schulze, S., Malesani, D., Cucchiara, A., et al. 2014, arXiv:1401.3774
- Smith et al. (2013) Smith, D. M., et al. 2013, GCN Circ. 14590
- Soderberg et al. (2004) Soderberg, A. M., Kulkarni, S. R., Berger, E., et al. 2004, ApJ, 606, 994
- Soderberg et al. (2005) Soderberg, A. M., Kulkarni, S. R., Fox, D. B., et al. 2005, ApJ, 627, 877
- Soderberg et al. (2006) Soderberg, A. M., Kulkarni, S. R., Price, P. A., et al. 2006, ApJ, 636, 391
- Sollerman et al. (2006) Sollerman, J., Jaunsen, A. O., Fynbo, J. P. U., et al. 2006, A, 454, 503
- Sparre et al. (2011) Sparre, M., Sollerman, J., Fynbo, J. P. U., et al. 2011, ApJ, 735, 24
- Stanek et al. (2003) Stanek, K. Z., Matheson, T., Garnavich, P. M., et al. 2003, ApJ, 591, 17
- Starling et al. (2011) Starling, R. L. C., Wiersema, K., Levan, A. J., et al. 2011, MNRAS, 411, 2792
- Tanvir et al. (2010) Tanvir, N. R., Rol, E., Levan, A. J., et al. 2010, ApJ, 725, 625
- Valenti et al. (2008) Valenti, S., Benetti, S., Cappellaro, E., et al. 2008, MNRAS, 383, 1485
- Vanderspek et al. (2004) Vanderspek, R., Sakamoto, T., Barraud, C., et al. 2004, ApJ, 617, 1251
- Verrecchia et al. (2013) Verrecchia, F., et al. 2013, GCN Circ. 14515
- Vestrand et al. (2014) Vestrand, W. T., Wren, J., Panaitescu, A., et al. 2014, Science, 343, 38
- von Kienlin (2013) von Kienlin, A. 2013, GCN Circ. 14473
- Woosley Bloom (2006) Woosley, S. E., Bloom, J. S. 2006, ARAA, 44, 507
- (89) Xu, D., et al. 2013a, GCN Circ. 14478
- (90) Xu, D., de Ugarte Postigo, A., Leloudas, G., et al. 2013b, ApJ, 776, 98
- Yonetoku et al. (2004) Yonetoku D., Murakami T., Nakamura T., et al. 2004, ApJ, 609, 935
- Zeh et al. (2004) Zeh, A., Klose, S., Hartmann, D. H. 2004, ApJ, 609, 952
- Zhu et al. (2013) Zhu, S., et al. 2013, GCN Circ. 14471
| Date | Magnitude | Flux density | Ref. | Seeing | ||
| (days) | (min) | (Jy) | (″) | |||
| 2013 May 3 | 6.722 | 1.0 | 20.93 0.02 | 19.4 0.4 | VLT- | 0.96 |
| 2013 May 6 | 9.723 | 1.0 | 21.37 0.04 | 12.9 0.5 | VLT- | 1.18 |
| 2013 May 8 | 11.645 | 1.0 | 21.40 0.04 | 12.5 0.5 | VLT- | 0.77 |
| 2013 May 10 | 13.648 | 1.0 | 21.58 0.06 | 10.7 0.6 | VLT- | 1.20 |
| 2013 May 11 | 14.648 | 1.0 | 21.63 0.12 | 10.2 1.1 | VLT- | 1.57 |
| 2013 May 13 | 16.644 | 1.5 | 21.74 0.06 | 9.3 0.5 | VLT- | 1.49 |
| 2013 May 14 | 17.748 | 1.5 | 21.68 0.04 | 9.7 0.4 | VLT- | 0.80 |
| 2013 May 15 | 18.720 | 1.5 | 21.75 0.08 | 9.2 0.7 | VLT- | 1.34 |
| 2013 May 19 | 22.597 | 2.5 | 21.68 0.08 | 9.7 0.7 | TNG- | 1.25 |
| 2013 May 20 | 23.674 | 3.0 | 21.82 0.22 | 8.6 1.8 | VLT- | 1.00 |
| 2013 May 25 | 28.657 | 1.5 | 22.11 0.19 | 6.6 1.2 | VLT- | 1.11 |
| 2013 May 27 | 30.643 | 1.5 | 22.13 0.07 | 6.4 0.5 | VLT- | 1.38 |
| 2013 May 28 | 31.647 | 1.5 | 22.22 0.04 | 5.9 0.2 | VLT- | 0.70 |
| 2013 May 29 | 32.637 | 1.5 | 22.26 0.07 | 5.7 0.4 | VLT- | 0.96 |
| 2013 June 1 | 34.649 | 1.5 | 22.25 0.14 | 5.7 0.7 | VLT- | 0.75 |
| 2013 June 2 | 35.649 | 1.5 | 22.21 0.06 | 6.0 0.3 | VLT- | 0.97 |
| 2013 June 3 | 37.649 | 1.5 | 22.20 0.06 | 6.0 0.4 | VLT- | 0.76 |
| 2013 June 4 | 38.655 | 1.5 | 22.22 0.08 | 5.9 0.4 | VLT- | 0.72 |
| 2013 June 5 | 39.649 | 1.5 | 22.22 0.09 | 5.9 0.5 | VLT- | 0.93 |
| 2013 June 6 | 40.639 | 2.5 | 22.19 0.08 | 6.1 0.5 | VLT- | 0.81 |
| 2013 June 10 | 44.639 | 1.5 | 22.21 0.09 | 6.0 0.5 | VLT- | 0.98 |
| 2013 June 13 | 47.626 | 3.0 | 22.21 0.23 | 6.0 1.3 | VLT- | 1.29 |
| 2013 June 15 | 49.649 | 1.5 | 22.24 0.21 | 5.8 1.1 | VLT- | 1.57 |
| 2013 June 16 | 50.671 | 1.5 | 22.20 0.18 | 6.1 1.0 | VLT- | 1.25 |
| 2013 June 17 | 51.670 | 1.5 | 22.19 0.22 | 6.1 1.2 | VLT- | 0.96 |
| 2013 May 3 | 6.724 | 1.0 | 20.31 0.02 | 28.7 0.6 | VLT- | 1.16 |
| 2013 May 6 | 9.724 | 1.0 | 20.60 0.03 | 22.2 0.6 | VLT- | 1.20 |
| 2013 May 8 | 11.647 | 1.0 | 20.74 0.02 | 19.4 0.5 | VLT- | 0.85 |
| 2013 May 10 | 13.650 | 1.0 | 20.81 0.04 | 18.2 0.7 | VLT- | 1.37 |
| 2013 May 11 | 14.649 | 1.0 | 20.84 0.03 | 17.8 0.4 | VLT- | 1.15 |
| 2013 May 13 | 16.646 | 1.5 | 20.90 0.03 | 16.8 0.5 | VLT- | 1.30 |
| 2013 May 14 | 17.751 | 1.5 | 20.96 0.06 | 15.9 0.8 | VLT- | 0.89 |
| 2013 May 15 | 18.723 | 1.5 | 20.99 0.04 | 15.4 0.6 | VLT- | 1.34 |
| 2013 May 20 | 23.677 | 3.0 | 20.85 0.13 | 17.7 2.2 | VLT- | 1.17 |
| 2013 May 25 | 28.657 | 1.5 | 21.05 0.08 | 14.7 1.1 | VLT- | 1.07 |
| 2013 May 27 | 30.645 | 1.5 | 21.18 0.05 | 13.0 0.5 | VLT- | 1.25 |
| 2013 May 28 | 31.649 | 1.5 | 21.25 0.03 | 12.2 0.3 | VLT- | 0.68 |
| 2013 May 29 | 32.639 | 1.5 | 21.25 0.04 | 12.2 0.4 | VLT- | 1.03 |
| 2013 June 1 | 34.651 | 1.5 | 21.33 0.06 | 11.3 0.7 | VLT- | 0.76 |
| 2013 June 2 | 35.652 | 1.5 | 21.34 0.04 | 11.2 0.4 | VLT- | 1.33 |
| 2013 June 3 | 37.651 | 1.5 | 21.33 0.03 | 11.3 0.3 | VLT- | 0.75 |
| 2013 June 4 | 38.657 | 1.5 | 21.31 0.03 | 11.6 0.4 | VLT- | 0.91 |
| 2013 June 5 | 39.652 | 1.5 | 21.44 0.04 | 10.3 0.4 | VLT- | 0.80 |
| 2013 June 6 | 40.643 | 2.5 | 21.37 0.03 | 10.9 0.3 | VLT- | 0.86 |
| 2013 June 10 | 44.641 | 1.5 | 21.41 0.04 | 10.5 0.4 | VLT- | 0.92 |
| 2013 June 13 | 47.628 | 3.0 | 21.48 0.08 | 9.9 0.7 | VLT- | 1.62 |
| 2013 June 15 | 49.652 | 1.5 | 21.38 0.06 | 10.8 0.6 | VLT- | 1.62 |
| 2013 June 16 | 50.673 | 1.5 | 21.57 0.08 | 9.1 0.7 | VLT- | 0.85 |
| 2013 June 17 | 51.660 | 1.5 | 21.41 0.08 | 10.5 0.8 | VLT- | 0.87 |
| 2013 April 30 | 3.651 | 1.0 | 19.43 0.06 | 54.8 3.3 | TNG- | 1.56 |
| 2013 May 4 | 6.726 | 1.0 | 20.07 0.05 | 30.3 1.4 | VLT- | 0.88 |
| 2013 May 7 | 9.727 | 1.0 | 20.35 0.03 | 23.4 0.6 | VLT- | 1.30 |
| 2013 May 8 | 11.649 | 1.0 | 20.38 0.03 | 22.8 0.6 | VLT- | 1.03 |
| 2013 May 10 | 13.652 | 1.0 | 20.47 0.04 | 21.0 0.8 | VLT- | 1.40 |
| 2013 May 11 | 14.657 | 1.0 | 20.52 0.04 | 20.0 0.7 | VLT- | 1.21 |
| 2013 May 13 | 16.650 | 1.5 | 20.57 0.03 | 19.1 0.5 | VLT- | 1.12 |
| 2013 May 14 | 17.755 | 1.5 | 20.59 0.04 | 18.7 0.6 | VLT- | 0.86 |
| 2013 May 15 | 18.726 | 1.5 | 20.50 0.09 | 20.4 1.7 | VLT- | 1.34 |
| 2013 May 19 | 22.607 | 1.0 | 20.69 0.16 | 17.1 2.7 | TNG- | 1.40 |
| 2013 May 20 | 23.680 | 3.0 | 20.41 0.12 | 22.2 2.5 | VLT- | 1.17 |
| 2013 May 25 | 28.660 | 1.5 | 20.72 0.05 | 16.7 0.8 | VLT- | 0.90 |
| 2013 May 27 | 30.648 | 1.5 | 20.81 0.04 | 15.4 0.6 | VLT- | 1.22 |
| 2013 May 28 | 31.654 | 1.5 | 20.88 0.02 | 14.4 0.3 | VLT- | 0.77 |
| 2013 May 29 | 32.757 | 1.5 | 20.20 0.03 | 14.2 0.4 | VLT- | 0.97 |
| 2013 June 1 | 34.655 | 1.5 | 20.91 0.06 | 14.0 0.7 | VLT- | 0.77 |
| 2013 June 2 | 35.656 | 1.5 | 20.92 0.04 | 13.9 0.6 | VLT- | 1.18 |
| 2013 June 3 | 37.654 | 1.5 | 20.88 0.02 | 14.3 0.3 | VLT- | 0.70 |
| 2013 June 4 | 38.660 | 1.5 | 20.94 0.03 | 13.6 0.4 | VLT- | 0.87 |
| 2013 June 5 | 39.651 | 1.5 | 20.94 0.03 | 13.6 0.3 | VLT- | 0.79 |
| 2013 June 6 | 40.642 | 2.5 | 20.95 0.02 | 13.5 0.3 | VLT- | 0.89 |
| 2013 June 10 | 44.640 | 1.5 | 21.09 0.04 | 11.8 0.5 | VLT- | 1.00 |
| 2013 June 13 | 47.627 | 3.0 | 21.05 0.06 | 12.3 0.7 | VLT- | 1.34 |
| 2013 June 15 | 49.651 | 1.5 | 21.16 0.09 | 11.1 0.9 | VLT- | 1.56 |
| 2013 June 16 | 50.672 | 1.5 | 21.10 0.07 | 11.7 0.8 | VLT- | 1.24 |
| 2013 June 17 | 51.659 | 1.5 | 21.24 0.05 | 10.3 0.5 | VLT- | 0.90 |
| 2013 April 30 | 3.652 | 1.0 | 18.95 0.06 | 65.7 3.9 | TNG- | 1.34 |
| 2013 May 3 | 6.727 | 1.0 | 19.40 0.02 | 43.6 0.9 | VLT- | 0.91 |
| 2013 May 6 | 9.728 | 1.0 | 19.68 0.03 | 33.7 1.0 | VLT- | 1.14 |
| 2013 May 8 | 11.650 | 1.0 | 19.85 0.03 | 28.8 0.8 | VLT- | 0.79 |
| 2013 May 10 | 13.653 | 1.0 | 19.85 0.04 | 28.7 1.1 | VLT- | 1.40 |
| 2013 May 11 | 14.658 | 1.0 | 19.85 0.03 | 28.9 0.9 | VLT- | 0.73 |
| 2013 May 13 | 16.651 | 1.5 | 19.90 0.05 | 27.4 1.3 | VLT- | 0.89 |
| 2013 May 14 | 17.756 | 1.5 | 19.88 0.06 | 28.0 1.7 | VLT- | 0.94 |
| 2013 May 15 | 18.727 | 1.5 | 20.07 0.13 | 24.7 2.6 | VLT- | 1.34 |
| 2013 May 19 | 22.593 | 1.0 | 20.02 0.16 | 24.6 3.6 | TNG- | 1.16 |
| 2013 May 20 | 23.681 | 3.0 | 19.83 0.16 | 29.3 4.5 | VLT- | 1.17 |
| 2013 May 25 | 28.661 | 1.5 | 19.88 0.03 | 28.0 0.9 | VLT- | 0.92 |
| 2013 May 27 | 30.649 | 1.5 | 19.93 0.04 | 26.7 1.1 | VLT- | 1.46 |
| 2013 May 28 | 31.655 | 1.5 | 20.07 0.03 | 23.4 0.7 | VLT- | 0.86 |
| 2013 May 29 | 32.758 | 1.5 | 20.13 0.04 | 22.3 0.9 | VLT- | 1.00 |
| 2013 June 1 | 34.656 | 1.5 | 20.13 0.05 | 22.2 0.9 | VLT- | 0.71 |
| 2013 June 2 | 35.657 | 1.5 | 19.96 0.04 | 26.0 1.1 | VLT- | 1.25 |
| 2013 June 3 | 37.655 | 1.5 | 20.30 0.03 | 19.1 0.6 | VLT- | 0.69 |
| 2013 June 4 | 38.661 | 1.5 | 20.18 0.04 | 21.2 0.8 | VLT- | 0.96 |
| 2013 June 5 | 39.652 | 1.5 | 20.27 0.03 | 19.5 0.6 | VLT- | 0.76 |
| 2013 June 6 | 40.643 | 2.5 | 20.13 0.03 | 22.2 0.7 | VLT- | 0.91 |
| 2013 June 10 | 44.641 | 1.5 | 20.25 0.04 | 19.9 0.8 | VLT- | 0.88 |
| 2013 June 13 | 47.628 | 3.0 | 20.30 0.03 | 18.9 0.5 | VLT- | 1.34 |
| 2013 June 15 | 49.652 | 1.5 | 20.33 0.04 | 18.5 0.7 | VLT- | 1.49 |
| 2013 June 16 | 50.673 | 1.5 | 20.35 0.04 | 18.2 0.6 | VLT- | 0.94 |
| 2013 June 17 | 51.660 | 1.5 | 20.27 0.03 | 19.5 0.6 | VLT- | 1.09 |