Verifying the mass-metallicity relation in damped Lyman- selected galaxies at
Abstract
A scaling relation has recently been suggested to combine the galaxy mass-metallicity (MZ) relation with metallicities of damped Lyman- systems (DLAs) in quasar spectra. Based on this relation the stellar masses of the absorbing galaxies can be predicted. We test this prediction by measuring the stellar masses of 12 galaxies in confirmed DLA absorber - galaxy pairs in the redshift range 0.1 3.2. We find an excellent agreement between the predicted and measured stellar masses over three orders of magnitude, and we determine the average offset between absorption and emission metallicities. We further test if could depend on the impact parameter and find a correlation at the level. The impact parameter dependence of the metallicity corresponds to an average metallicity difference of dex kpc-1. By including this metallicity vs. impact parameter correlation in the prescription instead of , the scatter reduces to dex in log . We provide a prescription how to calculate the stellar mass () of the galaxy when both the DLA metallicity and DLA galaxy impact parameter is known. We demonstrate that DLA galaxies follow the MZ relation for luminosity-selected galaxies at and when we include a correction for the correlation between impact parameter and metallicity.
keywords:
galaxies: abundances – galaxies: formation – galaxies: evolution – galaxies: high-redshift – galaxies: fundamental parameters – ISM: abundances – quasars: absorption lines1 Introduction
During the last decade, large galaxy surveys have provided a wealth of information on the average properties of galaxies. Scaling relations of various physical properties are useful for our understanding of what is the driving parameter behind galaxy evolution. A well-established scaling relation between the galaxy stellar mass and the gas phase metallicity was cemented by investigations of 53,000 local galaxies in the Sloan Digital Sky Survey (SDSS; Tremonti et al., 2004) suggesting that a primary parameter that drives galaxy evolution is the stellar mass. The simple interpretation for the mass-dependence is a metal loss via galactic winds, where galaxies with shallow potential well have more efficient outflows. Deeper targeted surveys have extended the mass-metallicity (MZ) relation to redshifts of 1 (Savaglio et al., 2005), 2 (Erb et al., 2006), and 3 (Maiolino et al., 2008), and show that for a given stellar mass, galaxies have lower metallicities at increasing redshifts. Other scaling relations that also evolve with redshift involve galaxy stellar masses and star formation rates (Noeske et al., 2007). The three observables (star-formation rate, metallicity and stellar mass), have been shown to form a fundamental relation that does not evolve with redshift (Lara-López et al., 2010), although Mannucci et al. (2010) hint that the relation might change at . Further analysis on the redshift evolution requires detailed spectroscopic data for individual high-redshift galaxies.
While the luminosity selected galaxies are well studied, long integration times on near-IR spectrographs are necessary to measure metallicities based on rest-frame optical emission lines from high-redshift galaxies. Because of observational limitations, preferentially the most massive and luminous galaxies are targeted and thereby also relatively high-metallicity galaxies are investigated. Metallicities below 10% solar are rarely inferred for galaxies at because of this selection effect. By observing intrinsically fainter, low-mass galaxies, such as gravitationally lensed galaxies, detailed analyses of galaxies at with metallicities about 5–10% solar are feasible (Yuan & Kewley, 2009; Wuyts et al., 2012; Christensen et al., 2012; Belli et al., 2013).
From quasar absorption line studies on the other hand, we know that galaxies with much lower metallicities exist at . In particular, damped Lyman- systems (DLAs), that have neutral hydrogen column densities of log (H i) cm-2, reveal metallicities that are typically 1–10% solar (e.g. Pettini et al., 1994; Ledoux et al., 2002; Prochaska et al., 2003). At these redshifts, even cases of extremely low DLA metallicities between 0.1–1% solar are known (Cooke et al., 2011).
DLAs have a corresponding relation analogous to the MZ relation for luminosity selected galaxies. Ledoux et al. (2006) show that the velocity widths of DLA metal lines and their metallicities are correlated. As the velocity-metallicity relation has the same slope as the galaxy MZ relation, it is appealing to use the width of the absorption lines as a proxy for the stellar mass of the galaxies. This scaling relation demonstrates that low-metallicity DLAs trace low-mass galaxies that have lower luminosities than galaxies targeted in spectroscopic surveys. The velocity-metallicity relation of DLAs evolves with redshift (Ledoux et al., 2006; Møller et al., 2013; Neeleman et al., 2013) again demonstrating a lower metallicity for a given velocity (or equivalently mass) at progressively higher redshifts.
The hypothesis that low-metallicity DLAs trace galaxies at the low-mass end of the mass distribution is supported by models that include the galaxy luminosity, extension of a gas disc, metallicities and gradients (Fynbo et al., 2008) and numerical simulations are able to reproduce the low DLA metallicities (Pontzen et al., 2008). Models suggest that metal-rich DLAs can be found at larger projected distances between the quasi-stellar object (QSO) and the absorbing galaxy, the so-called impact parameter, and this hypothesis is supported by observations (Krogager et al., 2012). In the remainder of this paper, we will call the galaxy which is responsible for the damped absorption in the QSO spectrum the ‘DLA galaxy’.
The origin of DLA clouds relative to the DLA galaxies has been widely debated. Studies of the C ii* fine structure line showed that some DLAs might arise in-situ in star-forming galaxies (Wolfe et al., 2004) while others do not appear to be heated by very nearby star-forming regions (Wolfe et al., 2003). Observations have suggested that DLA clouds can be expelled through galactic winds (Noterdaeme et al., 2012), while another proposition is that the low-metallicity of DLAs is indicative of aggregates of pristine gas rather than gas processed by stars (Bouché et al., 2013; Fukugita & Ménard, 2014). In this paper, we will not make any assumptions regarding the structure of the stellar- and gas distribution within DLA galaxies. The morphology of low-redshift DLA galaxies comprise a wide selection of types: irregular, bulge-dominated, low-surface brightness galaxies while others are genuine galaxy spiral discs (Chen & Lanzetta, 2003). In this paper, we simply refer to DLA clouds as belonging to halos or extended outskirts of DLA galaxies irrespectively of their origin.
Whereas the success rate of identifying DLA galaxies at low redshift () is close to 50% (Chen & Lanzetta, 2003; Rao et al., 2003; Chen et al., 2005; Rao et al., 2011), only few spectroscopically confirmed DLA galaxies at have been reported. As the galaxies are expected to have faint continuum emission, several searches have aimed at discovering the Ly emission line from the DLA galaxies. However, there are more failed attempts to discover the DLA galaxies as the Lyman- emission line is resonantly scattered and easily absorbed by dust (e.g. Kulkarni et al., 2006; Christensen et al., 2007). Instead, searches for the H emission line would not be as hampered by dust absorption, but observations have only revealed a few detections at and , while more upper detection limits are reported (Péroux et al., 2012; Bouché et al., 2012). Even though the majority of DLA galaxies are low-mass and hence low-luminosity galaxies, Møller et al. (2004) suggested that targeting the more metal-rich DLAs would imply a higher chance of discovering the DLA galaxy. Indeed, this is confirmed by recent observations (Fynbo et al., 2010, 2011; Noterdaeme et al., 2012; Krogager et al., 2013; Fynbo et al., 2013).
Since we now have a growing sample of DLA galaxies, the next step is to understand the relations between DLAs and the galaxies detected in emission. Such a correlation is predicted by simulations of DLA galaxies (Pontzen et al., 2008). Combining the observed velocity-metallicity relation of DLAs with the MZ scaling relation from luminosity selected galaxies (Maiolino et al., 2008), Møller et al. (2013, hereafter M13) derive an equation to compute stellar masses, , of DLA galaxies:
| (1) |
where [M/H] is the measured DLA absorption metallicity and is the redshift. The remaining coefficient, is a parameter required to make the absorption- and emission-line metallicities consistent with each other. M13 report an intrinsic scatter of 0.38 dex in [M/H] in this relation for DLAs at .
The aim of this paper is to carry out a critical test of this statistically derived mass-redshift-metallicity relation (MzZ relation hereafter) via comparison to individual direct measurements. To do this, we derive stellar masses from conventional spectral energy distribution (SED) fits to multi-band photometry of the DLA galaxies.
The structure of the paper is as follows. In Section 2 we describe the sample of confirmed DLA galaxies included in this investigation and present the photometry for these objects. Based on the photometry we fit SED models in Section 3. In Section 4 we compare the measured stellar masses with predictions. We discuss the results in Section 5 and present our conclusions in Section 6.
2 Sample selection
Only three DLA galaxies have measured stellar masses reported in the literature: Q0302–223 (Péroux et al., 2011b), Q0918+1636 (Fynbo et al., 2011), and Q2222–0946 (Fynbo et al., 2010; Krogager et al., 2013). To build a sample of DLA galaxies with measured stellar masses we included those three and searched the literature for objects for which the following criteria were fulfilled:
-
1.
We select absorbers at cosmological redshifts (), and exclude local galaxy discs that are intersected by QSOs (e.g. Schulte-Ladbeck et al., 2005).
-
2.
Absorber-galaxy pair must have a spectroscopically confirmed DLA galaxy at an impact parameter smaller than 50 kpc. Choosing a larger distance would imply an increasing fraction of interlopers. Note that while this means that we could include DLA galaxies detected at zero impact parameter (e.g. Noterdaeme et al., 2012), they are unlikely to pass condition (iii) because their stellar continuum emission is impossible to disentangle from the much brighter QSO emission.
-
3.
DLA galaxy must have multi-band photometric measurements in a sufficient number of bands to allow conventional SED fitting accurate enough to determine the stellar mass of the galaxy. Although more DLA galaxies are confirmed than included here (e.g. Bouché et al., 2012; Péroux et al., 2014), the lack of continuum flux measurements prevent the derivation of the stellar masses.
-
4.
DLAs must have measured absorption line metallicities, preferably from an element that is not depleted onto dust grains. Effectively we apply the same criteria which were defined in Ledoux et al. (2006). Also this requirement de-selects many confirmed DLA galaxies at because their corresponding DLA metal abundances have not been measured (e.g. Chun et al., 2010).
-
5.
DLA H i column density must be high enough that the obtained metallicity is reliable, i.e. that a potential ionisation correction is not so large as to introduce a dominating systematic error. For this we set the following requirement: (H i) 19.5 cm-2. Initially we do not make any strict distinction between DLAs and sub-DLAs ((H i)).
Based on these selection criteria we have collected the sample of DLA galaxies presented in Table 1.
| QSO name | log N(H i) | [Zn/H]abs | [M/H]em | references | ||
| [cm-2] | [kpc] | |||||
| (1) | (2) | (3) | (4) | (5) | (6) | (7) |
| Q0235+164 ID2 | 0.5243 | 21.70 | 13.2 | –0.600.41 | –0.190.15b | [1,2,5] |
| Q0302–223 | 1.009 | 20.360.11 | 25.0 | –0.510.12 | 0.22a | [1,3,4] |
| Q0439–433b | 0.101 | 19.850.10 | 7.2 | –0.200.30 | 0.330.14a | [1,5] |
| Q0738+313 | 0.2212 | 20.900.07 | 20.3 | –0.700.16 | … | [21,22] |
| Q0827+243 | 0.5247 | 20.300.04 | 38.4 | –0.490.30 | 0.01b | [1,5,6,21,22] |
| Q1009–0026 | 0.887 | 19.480.05 | 39.0 | 0.250.06 | 0.310.20a | [7] |
| Q1127–145 | 0.3127 | 21.710.07 | 17.5 | –0.900.11 | … | [2,8,9] |
| Q0528-250 | 2.811 | 21.35 | 9.20.2 | –0.910.07 | … | [10,11,20,23] |
| Q0918+1636 | 2.5832 | 20.960.05 | 16.20.2 | –0.120.05 | 0.010.20b | [12,13,14] |
| Q2206–1958 (total) | 1.921 | 20.65 | 12.70.6 | –0.540.05 | … | [15,16,23] |
| Q2222–0946 | 2.354 | 20.650.05 | 6.30.8 | –0.460.07 | –0.440.19a | [17,18] |
| Q2233+131 | 3.1501 | 20.00 | 17.9 | –0.800.24 | … | [16,19,20] |
2.1 Individual DLAs
To derive total stellar masses for the galaxies, the magnitudes have to be extracted from within the same aperture sizes. This is complex when compiling values from various papers by different authors, in particular as aperture choices may be very different in HST and ground-based images.
In this section we describe the individual DLAs and their associated galaxies included in this project. When relevant we apply aperture corrections appropriate for the given filters. All reported magnitudes are in the AB system, and when the original magnitudes were given in the Vega system we included an offset between the two. In three cases (Q0235+164, Q0302–223, and Q0738+313) the reported magnitudes included a correction for Galactic extinction. For the remaining galaxies, we included the extinction correction as a part of the SED fitting procedure described in Section 3.
| Object | Redshift | Filter | Magnitude | Reference |
| DLA 0235+164 | 0.5243 | 21.060.03 | [1]a | |
| ID2 | 20.840.01 | [1]a | ||
| 20.610.01 | [1]a | |||
| 20.420.01 | [1]a | |||
| 20.220.02 | [1]a | |||
| DLA 0302–223 | 1.009 | WFPC2/F450W | 24.010.34 | [1]a |
| WFPC2/F702W | 23.250.06 | [1]a | ||
| 22.670.04 | [1]a | |||
| 22.620.17 | [1]a | |||
| 22.680.25 | [1]a | |||
| DLA 0439–433 | 0.101 | 19.310.01 | [1]a | |
| 18.370.01 | [1]a | |||
| 17.720.01 | [1]a | |||
| 17.120.01 | [1]a | |||
| 16.550.01 | [1]a | |||
| 16.660.01 | [1]a | |||
| DLA 0528–250 | 2.811 | STIS/m50 | 25.430.11 | [2] |
| WFPC2/F450W | 25.510.10 | [3]b | ||
| WFPC2/F467M | 25.470.13 | [3]b | ||
| WFPC2/F814W | 24.850.15 | [3] | ||
| NIC2/F160W | 25.180.22 | [2] | ||
| DLA 0738+313 | 0.2212 | 23.430.16 | [4]a | |
| 22.010.05 | [4]a | |||
| 21.090.05 | [4]a | |||
| 20.850.1 | [4]a | |||
| 19.840.1 | [4]a | |||
| 20.090.1 | [4]a | |||
| 19.700.1 | [4]a | |||
| DLA 0827+243 | 0.5247 | 23.520.16 | [5] | |
| 22.690.04 | [5] | |||
| 21.030.05 | [5] | |||
| 20.790.05 | [5] | |||
| 18.990.05 | [5] |
| Object | Redshift | Filter | Magnitude | Reference |
| DLA 0918+1636 | 2.583 | NOT/ALFOSC/ | 26.5 | [14] |
| NOT/ALFOSC/ | 25.90.3 | [14] | ||
| WFC3/F606W | 25.460.13 | [14] | ||
| WFC3/F105W | 24.610.09 | [14] | ||
| WFC3/F160W | 23.630.06 | [14] | ||
| NOT/NOTCam/Ks | 23.3 | [14] | ||
| DLA 1009–0026 | 0.8870 | SDSS/ | 24.050.79 | [6] |
| SDSS/ | 22.950.19 | [6] | ||
| SDSS/ | 22.280.15 | [6] | ||
| SDSS/ | 21.150.08 | [6] | ||
| SDSS/ | 20.890.24 | [6] | ||
| 20.000.04 | [7] | |||
| 19.780.04 | [7] | |||
| 19.320.03 | [7] | |||
| DLA 1127–145 | 0.3127 | 23.810.19 | [5] | |
| 24.020.15 | [5] | |||
| 21.790.08 | [5] | |||
| WFPC2/F814W | 22.000.37 | [8] | ||
| 22.810.13 | [5] | |||
| 22.540.15 | [5] | |||
| DLA 2206–1958 | 1.9210 | STIS/m50 | 24.100.03 | [2] |
| (source ID2) | NIC2/F160W | 23.87 | [12] | |
| DLA 2206-1958 | 1.9210 | STIS/m50 | 23.48 | [13] |
| (total) | WFC3/F160W | 23.14 | [13] | |
| DLA 2222–0946 | 2.3535 | WFC3/F606W | 24.290.04 | [15] |
| WFC3/F105W | 24.510.21 | [15] | ||
| WFC3/F160W | 23.530.13 | [15] | ||
| DLA 2233+131 | 3.1501 | 27.12 | [9] | |
| 25.79 | [9] | |||
| STIS/m50 | 25.090.2 | [2]c | ||
| Cousins | 25.100.2 | [10] | ||
| 25.15 | [9] | |||
| Cousins | 24.800.2 | [10] | ||
| WFPC2/F702W | 24.800.1 | [11] | ||
| NIC2/F160W | 24.390.2 | [12]c |
2.1.1 Q0235+164
Multiple galaxies are detected within close projected distance from the QSO line of sight (Guillemin & Bergeron, 1997; Chen & Lanzetta, 2003; Rao et al., 2011). Three galaxies within 65 corresponding to 40 kpc, are found to have the same redshift as the DLA (Yanny et al., 1989). The object at the closest impact parameter of 11 is not resolved in ground based images (ID1 in Chen & Lanzetta, 2003). Due to blending with the background QSO Chen & Lanzetta (2003) report an upper limit for the galaxy magnitude WFPC2/F702W 21.36. This galaxy is 1 mag fainter than the neighbour galaxy at an impact parameter of 21 (ID2 in Chen & Lanzetta, 2003) which is presumably the dominant component in an interacting galaxy pair. As in Chen & Lanzetta (2003) we adopt this dominant galaxy as the primary absorber and reproduce the photometry in Table 2.
2.1.2 Q0302–223
Candidate DLA galaxies nearby in projection to the QSO were detected by Le Brun et al. (1997), and multi-band photometry of these galaxies reported by Chen & Lanzetta (2003). Objects named 3+4 by these authors were spectroscopically confirmed to be at the DLA redshift by Péroux et al. (2011b). The photometry of the sum of the two galaxy components is listed in Table 2.
2.1.3 Q0439–433
2.1.4 PKS 0528–250
Extensive HST data exist for this QSO, and the DLA galaxy magnitudes are adopted from Møller & Warren (1998); Warren et al. (2001); Møller et al. (2002). The STIS magnitude is based on the best fit Sérsic model profile extrapolated to infinite radius, while the WFPC2 magnitudes are found within a 1″ diameter aperture, which should provide the total magnitudes of the galaxy given the zero-point adopted by Møller & Warren (1998). Two of the filters (WFPC2/F467M and WFPC2/F450W) are contaminated by Ly emission from the DLA galaxy. The extended Ly emitting region has a flux of erg cm-2 s-1 (Warren & Møller, 1996). However, compared to the extension of the Ly emission, the continuum emission from the galaxy is considerably more compact. We estimate that the contamination from the Ly emission line in the two bands amounts to erg cm-2 s-1 by assuming that the total flux in each band is the sum of the continuum flux density multiplied by the filter width plus the Ly flux. We correct the broad band magnitudes by subtracting the contributions of the Ly line flux. Since the filter width of the STIS/m50 is very large, the Ly emission does not contribute significantly to its magnitude in this band (0.04 mag), whereas the correction for the intermediate-width filter F467M data is 0.31 mag.
2.1.5 Q0738+313
The galaxy responsible for the DLA towards Q0738+313 was identified by Turnshek et al. (2001). The photometry of the galaxy is reproduced in Table 2, here converted to AB magnitudes by adding the offsets between Vega and AB magnitudes of , and to the magnitudes measured in the and filters, respectively.
2.1.6 Q0827+243
2.1.7 Q0918+1636
2.1.8 Q1009–0026
2.1.9 PKS 1127–145
The field around PKS 1127–145 is crowded, and a galaxy at an impact parameter of 96 (corresponding to 44 kpc) at the same redshift as the DLA was originally identified by Bergeron & Boissé (1991). Later observations showed that also galaxies closer to the QSO line of sight lie at the DLA redshift (Rao et al., 2003; Chen & Lanzetta, 2003). At least five galaxies within 17–240 kpc in projection have been identified at the DLA redshift (Kacprzak et al., 2010), revealing the origin of the DLA in a group environment. The photometry of the galaxy detected at the smallest impact parameter is reproduced in Table 2.
2.1.10 Q2206–1958
The morphology of the DLA galaxy is very complex with 3 compact sources and extended emission covering a size of roughly 2″1″ (Møller et al., 2002). The NICMOS data presented in Warren et al. (2001) show no extended emission because of its insufficient depth. We know from spectroscopic measurements that the compact knots arise at the same redshifts (Møller et al., 2002; Weatherley et al., 2005), and therefore the whole region has a complex morphology, which makes it likely that the DLA arises in a compact, merging galaxy group.
Photometry of source ID1 (named N-14-1C in Warren et al., 2001) is STIS/m within a 09 diameter aperture (Møller et al., 2002). Within a 045 diameter aperture Warren et al. (2001) report NIC2/F160W = 25.11. An aperture correction to a 09 diameter of 0.66 mag gives NIC2/F160W mag. For the source ID2 (named N-14-2C in Warren et al., 2001) the corresponding numbers is NIC2/F160W mag within a 09 diameter aperture. To verify the NICMOS photometry, we use archive HST/WFC3 F160W data (proposal ID: 11694, PI: Law). With a total integration time of 8093 s the data is substantially deeper than the NICMOS data. Due to the depth of the WFC3 data, we confirm that the extended emission visible in the STIS data is also present in the observed near-IR wavelengths. Due to PSF subtraction residuals we do not recover the emission from the compact source ID1. For the compact source ID2,we derive WFC3/F160W = 24.22 mag within an aperture size of 09.
Because the morphology of the DLA galaxy is complex, we present both the flux from object ID2, plus the total integrated flux from the entire complex region in Table 2. Re-examining the STIS data of the DLA host from Møller et al. (2002) we derive an integrated magnitude of STIS/50CCD = 23.48 mag while the WFC3/F160W data in the same aperture gives 23.14 mag.
From the measured flux and impact parameters for the various sources reported in Warren et al. (2001), we calculate a flux-weighted mean impact parameter of 148, corresponding to kpc at the DLA redshift. In the remainder of the paper, we adopt these values and the total integrated flux for the analysis of the DLA galaxy.
2.1.11 Q2222–0946
The DLA galaxy was discovered by Fynbo et al. (2010), and deeper data including HST images of the stellar light of the host galaxy was presented in Krogager et al. (2013). The DLA galaxy abundances and kinematics are further investigated from integral field spectra (Péroux et al., 2012; Jorgenson & Wolfe, 2014). The photometry of the galaxy is reproduced in Table 2.
2.1.12 Q2233+131
The DLA galaxy was discovered in Steidel et al. (1995). Within a 09 diameter aperture the measured magnitudes are STIS/m50 = 25.75 mag (Møller et al., 2002) and NIC2/F160W = 25.05 (Warren et al., 2001). These values are faint compared to ground based and band data. The aperture correction to total magnitudes for compact objects in NIC2/F160W imaging data is 0.66 mag (Warren et al., 2001). Assuming that the colour of the galaxy is constant with radius this aperture correction is also added to the STIS/m50 magnitude. This gives the photometry data listed in Table 2.
While Ly emission is also detected for the DLA galaxy towards Q2233+131, the emission falls at a wavelength at the edges of the band filters where the transmission is low. We therefore do not correct the measured magnitudes for contamination by Ly.
3 SED fitting
In this paper we are primarily interested in deriving the stellar masses for the galaxies, and adopt a standard method of fitting spectral energy distribution models to the measured photometry provided in Section 2.1. We use the release version 12.2 of HyperZ (Bolzonella et al., 2000) fixing the redshift to that of the absorber. Luminosity distances and impact parameters in kpc are calculated assuming a flat cosmology with km s-1 Mpc-1 and (Komatsu et al., 2011).
We retrieve the relevant filter transmission curves from the various observatories and instruments used to measure the original galaxy magnitudes. We assume a 0.1 magnitude uncertainty when those are not stated directly in the literature. Three of the galaxies listed in Table 2 have already had their magnitudes corrected for Galactic extinction, while the remaining galaxy magnitudes are corrected for Galactic extinction from the maps calibrated by Schlafly & Finkbeiner (2011) as part of the SED fitting procedure. Intrinsic reddening is included as a free parameter to the SED fits and allowed to vary between magnitude.
Input spectral templates are extracted from Bruzual & Charlot (2003) models, derived with Padova 1994 stellar evolutionary tracks with a Chabrier (2003) IMF, and metallicities of 0.2, 0.4 and 1.0 times solar. Various star formation histories are assumed including a single instantaneous burst, a constant star formation rate, and exponentially decreasing SFRs with time scales, between 10 Myr and 1 Gyr as well as exponentially increasing SFRs with between 10 Myr and 500 Myr. At high redshifts, absorption by neutral hydrogen in the Lyman alpha forest is taken into account using the description of the opacity in Madau (1995), see also Møller & Jakobsen (1990).
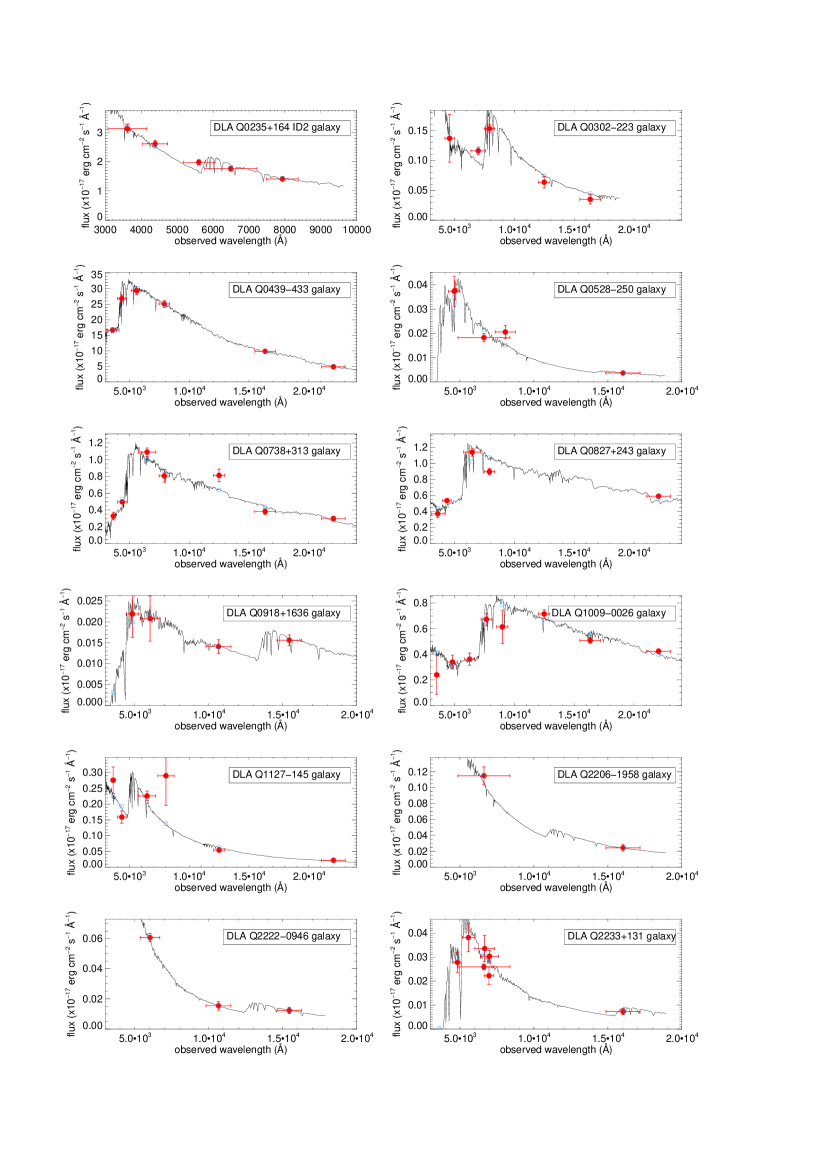
The stellar masses of the galaxies are estimated from the best fit template from HyperZ. The best fit model templates are in all cases instantaneous burst models or exponentially decreasing models with =10–100 Myr. The data and the best fit template spectra are illustrated in Fig. 1. To propagate the magnitude errors and obtain uncertainties on the stellar masses we assume a Gaussian error distribution, and then perform SED fits to random realisations for each galaxy. While we derive the stellar masses based on the best fit template spectrum, other star formation histories can also yield acceptable SED fits. We examine the differences for the various star formation histories, and determine that for acceptable fits the stellar masses are consistent to within 0.2 dex.
The Bruzual & Charlot (2003) spectral templates do not include nebular emission lines, and SED fits for galaxies with very strong emission lines relative to their continuum emission reveal much lower masses and high specific star formation rates (Schaerer & de Barros, 2009; Watson et al., 2011). However, since DLA galaxies with extremely high specific star formation rates are not yet discovered, we do not expect a significant effect. Nevertheless, we examine the effect emission lines would have for the derived stellar masses. Since HyperZ does not include emission lines in the template spectra, we use another photometric redshift code, Le Phare (Ilbert et al., 2009) to investigate the effect from nebular emission lines on the best fit spectral templates. Including emission lines, the best fit stellar mass decrease by 0.01–0.05 dex only, with the most extreme case being Q2233+131, where the stellar mass is 0.16 dex smaller.
Stellar masses obtained with a Chabrier IMF have been published for the DLA galaxies towards Q2222–0946, Q0918+1636, and Q0302–223. Because of possible offsets between masses obtained from various SED fitting codes, we derive the stellar masses from HyperZ. A different stellar mass can be explained by the various codes finding different ages, extinctions and star formation histories for the best fits. Besides, the choice of stellar evolutionary tracks for creating the input spectral templates also result in a different stellar mass. As listed in Table 3 we find compared to (Péroux et al., 2011b) for the DLA galaxy towards Q0302–223. For the DLA galaxy towards Q0918+1636 we derive stellar masses of compared to (Fynbo et al., 2013), and for Q2222–0946, we find compared to (Krogager et al., 2013). The masses are all consistent to within about uncertainties. For consistency of the further analysis we use only stellar masses derived using HyperZ.
| QSO name | log ( | log | log | ||||
| [M⊙] | [M⊙] | [M⊙] | [dex kpc-1] | ||||
| (1) | (2) | (3) | (4) | (5) | (6) | (7) | |
| Q0235+164 ID2 | 0.5243 | 8.910.72 | 9.660.01 | 8.650.72 | 0.870.41 | 0.0310.033 | |
| Q0302–223 | 1.009 | 9.370.21 | 9.650.08 | 9.560.21 | 0.600.13 | 0.029 | |
| Q0439–433 | 0.101 | 9.360.53 | 10.010.02 | 8.860.53 | 0.810.30 | 0.0740.046 | |
| Q0738+313 | 0.2212 | 8.550.28 | 9.330.05 | 8.560.28 | 0.880.16 | ||
| Q0827+243 | 0.5247 | 9.110.53 | 10.090.15 | 9.820.53 | 1.000.31 | 0.013 | |
| Q1009–0026 | 0.887 | 10.630.11 | 11.060.03 | 11.370.11 | 0.680.06 | 0.0020.005 | |
| Q1127–145 | 0.3127 | 8.250.19 | 8.290.09 | 8.160.19 | 0.460.12 | ||
| Q0528-250 | 2.811 | 9.640.12 | 8.790.15 | 9.220.13 | –0.050.14 | ||
| Q0918+1636 | 2.5832 | 11.020.09 | 10.330.08 | 10.870.10 | 0.050.07 | 0.0080.013 | |
| Q2206-1958 (total) | 1.921 | 9.880.09 | 9.450.30 | 9.600.13 | 0.200.18 | ||
| Q2222-0946 | 2.354 | 10.290.12 | 9.620.12 | 9.750.14 | 0.060.10 | 0.0030.032 | |
| Q2233+131 | 3.1501 | 9.840.42 | 9.850.14 | 9.760.42 | 0.450.25 |
4 Test of the DLA galaxy mass-redshift-metallicity relation
The primary aim of this paper is to test the statistically derived MzZ relation reproduced in Eq. 1. In the previous section we determined for 12 DLA galaxies from SED fits and we now compare those to the values determined from Eq. 1. This constitutes a critical test.
4.1 Determination of
Eq. 1 contains a term, , which describes the difference between the gas-phase metallicity measured via absorption lines and emission lines. Empirically this difference is expected to be in the range 0 – 0.5 dex (M13). We can therefore for each galaxy subtract the expression for log given in Eq. 1 from the measured log and solve for .
In Table 3 Col. 6, we list the individual values determined this way, as well as corresponding errors propagated from measurement errors on metallicities and log. It is seen that the scatter of the values is larger than the individual errors, which is caused by the intrinsic scatter of the relation in Eq. 1. In order to obtain an empirically determined expectation value for we adopt the minimisation method described in M13, i.e. we describe the total scatter as the square sum of the “natural intrinsic scatter” and measurement errors () where is the propagated error on individual values of . We can now use
| (2) |
to obtain the expectation value which provides the smallest scatter and for which . The degrees of freedom is here (for details on the method see M13). We find and the intrinsic scatter of is .
Using in Eq. 1 we then calculate the values for () listed in Col. 3 in Table 3. In Fig. 2 we plot those values versus the (SED) values determined in Sect. 3. The dotted lines mark the range of the intrinsic scatter converted to stellar mass, dex in log. It is seen that the SED fits are consistent with the computed values to within the internal scatter over 3 decades in stellar mass. We conclude that the MzZ relation in Eq. 1 has been confirmed at stellar masses above M⊙.

4.2 Is a function rather than a constant?
In the previous section we treated as a constant offset between metallicities determined in absorption and emission. We may attempt to go one step further and ask what is the cause of the non-zero value of . An absorption metallicity is sampling the gas in a very narrow beam along the sight-line to the background quasar, and this DLA sight-line is typically offset some distance from the sight-line through the centre of the galaxy. In our sample this distance (commonly referred to as the “impact parameter” ) is in the range 6 – 39 kpc. Emission line metallicities are measured at the slit position chosen by the observer (usually the centre of the galaxy) and it represents the mean metallicity taken across the slit (typically kpc at low redshifts, ; kpc at higher redshifts, ). Any non-zero value of therefore represents a variation of enrichment histories of the gas seen in different sight-lines. The enrichment could be caused by local “in situ” star-formation, but might also be the result of inflow of metal-rich gas from larger distances. In case those enrichment histories are randomly scattered across the galaxy and its halo, we would expect to be zero in the mean.
We have searched the literature and found that for five of the galaxies in our sample strong emission-line metallicities have been reported (Chen et al., 2005; Péroux et al., 2012; Krogager et al., 2013; Fynbo et al., 2013). Historically several different strong-line diagnostics have been used (for a review see Kewley & Ellison, 2008) so we convert all the reported metallicities to the same diagnostics (Kewley & Dopita, 2002) using the equations given in Kewley & Ellison (2008). The choice to use the Kewley & Dopita (2002) diagnostics is crucial because the calibration of Eq. 1 is tied to the MzZ relation in Maiolino et al. (2008) who used exactly this metallicity diagnostics. I.e. we use internally consistent calibrations of the metallicities. Col. 6 in Table 1 lists emission metallicities, [M/H]em, relative to a solar value of 12+log(O/H) = 8.69 (Asplund et al., 2009).
From Cols. 5 and 6 in Table 1 it is seen that the measured difference between the emission and absorption metallicities in all five cases is positive. In Table 1 we also report one lower limit (where the difference is also positive), and an upper limit (where the difference could be either positive or negative). The mean of the five values is .
With the caveat that five objects make up a very small sample, it is nevertheless noteworthy that we consistently find highest metallicities in the centre. If this is a real effect rather than a result of random scatter in a small sample, then it would imply that metallicity, in the mean, could be a function of the impact parameter. In this case the same result should appear in the entire sample. In the following section we shall briefly test if this prediction holds.
4.3 Is a function of the impact parameter?
We now test the hypothesis that can be expressed as a simple linear function of the impact parameter : . First we consider only the five galaxies for which we have both central metallicity measurements and a second measurement obtained at a distance from the centre. The two measurements of [M/H] and the impact parameter allow us to compute directly:
Those values (and propagated errors) are listed in Col. 7 in Table 3. We compute the mean and find .
In order to perform a test on the entire sample we repeat the calculation of from Eq. 2, but now replacing the constant by . We vary and again seek the solution for with the smallest internal scatter. We find , in excellent agreement with the value of determined from emission line and absorption metallicities above. The two determinations are completely independent and they both indicate that can be well approximated as , i.e. that Eq. 1 may be expanded to
| (3) |
Eq. 3 is an alternative way to write Eq. 1, and it contains the same number of fitted parameters (the constant has replaced the constant ). If Eq. 3 now provides a smaller scatter than before, then it means that it provides a better fit. Here we test if this is the case. Using the prescription in Eq. 3 we find an internal scatter of 0.39 in log . Using the corresponding scatter was 0.55 so in terms of improvement of the fit we see that , which means that by introducing the impact parameter dependency in Eq. 3 we may have identified the source of half of the scatter in the original DLA- prescription. Values for are listed in Col. 5 in Table 3, and a visual impression of the smaller scatter is provided in Fig. 3 where we again plot predicted versus measured stellar masses.

M13 report a scatter of dex in [M/H] in Eq. 1 by combining DLA absorption metallicities with the MZ scaling relation used in Maiolino et al. (2008). Converting this to a scatter in stellar mass gives dex in log . With the caveat that the sample used here is only of 12 galaxies with measured impact parameters, we conclude that a significant improvement has been achieved over the prescription in M13.
4.4 DLA galaxy sample tests
Fields around quasars often contain several faint galaxies which may be related to either an absorber, to the quasar, or to neither. Usually redshifts are available for only a small fraction of the galaxies, but it is always a cause to worry if mis-identifications might cause false results. For this reason we have carried out extensive tests as detailed in the Appendix. We demonstrate that the results are robust and that choosing other samples increase the scatter around Eqs. 1 and 3, and conclude that the chosen sample is very likely to represent the majority of correctly identified DLA galaxies.
We test if the range of impact parameters between sub-samples affects the results. By splitting the sample in two with impact parameters less than 15 kpc and and larger than 15 kpc, we find and , respectively, showing that the slope is stable for choice of sub-samples.
We also briefly investigate the outcome if we exclude the three sub-DLAs from the analysis. The resulting internal scatter does not change significantly and we obtain an insignificant change for the slope to dex kpc-1. We conclude that there is no evidence in the current sample that sub-DLAs follow a different MzZ relation from that of DLAs.
4.5 Comparing with galaxy MZ relations
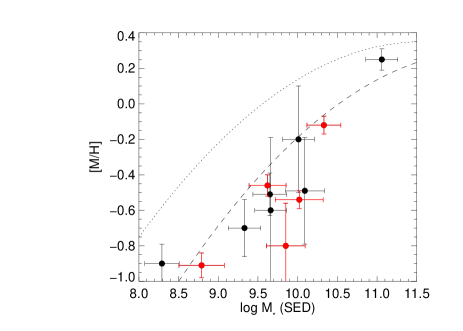
With our sample of measured (SED) stellar masses and absorption metallicities we can now investigate how these values compare to the MZ relation derived from luminosity-selected galaxy samples. Several studies have demonstrated a redshift evolution of the MZ relation (e.g. Tremonti et al., 2004; Savaglio et al., 2005; Erb et al., 2006; Maiolino et al., 2008). However, as discussed above, a comparison between MZ relations at different redshifts is only valid provided metallicities are derived from the same diagnostics. As our mass determination is based on the calibration by Maiolino et al. (2008) we can make a reliable comparison.
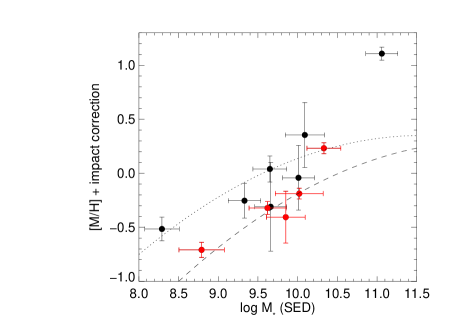
Figure 4 (left panel) shows the location of the 12 DLAs in our sample compared to the and MZ relations from Maiolino et al. (2008). We see immediately that most of the DLAs lie below the MZ relation at either redshift. DLAs at are colour coded red while those at are black. Neither sample follow their respective MZ relation at their given redshift even when including the average correction to the metallicity , and high- and low-redshift DLAs are mixed in the diagram. In the right hand panel of Fig. 4 we show the same plot but here we have added , with , to the absorption metallicity of each galaxy thereby correcting them to the assumed metallicity in the centre. It is striking that not only do the DLA galaxies now occupy the same general part of the plot as the emission selected galaxies, they also separate out to follow the same specific redshift tracks.
5 Discussion
The average impact parameter for the 7 low redshift DLA galaxies is kpc while it is only kpc for the high redshift DLAs (Table 1, Col. 4). This difference may reflect a real evolution, but it may also be a result of selection effects. In either case this anti-correlation between and in our sample means that any correlation with will have a degenerate solution as a correlation with . As a result, when we in Sect. 4.3 find that can be expanded as , it could equally well be written , and this solution would result in a figure very similar to Fig. 3. The correlation is significant so one of them must be true, but can we decide which?
We first note that if we assume that the correlation is with redshift then it almost cancels the redshift dependent term in Eq. 1. This redshift evolution of the MZ relation has been determined from large samples independent of this work, both emission selected samples (Tremonti et al., 2004; Erb et al., 2006; Maiolino et al., 2008) and absorption selected samples (Ledoux et al., 2006; Neeleman et al., 2013; Møller et al., 2013). Therefore, the solution as is ruled out by all those independent results. Second we note that the existence of metallicity offsets between the galaxy and QSO lines of sight. The value for the metallicity offset per kpc is comparable to gradients widely seen in local galaxies (e.g. Zaritsky et al., 1994) as well as at (Swinbank et al., 2012). In addition several metallicity gradients for DLA galaxies have been reported (Chen et al., 2005; Péroux et al., 2011a, 2013; Krogager et al., 2013; Fynbo et al., 2013; Péroux et al., 2014), but what the cause is of these metallicity gradients is not known. It could be variations in local in-situ star formation, but it is possible that large-scale gas flows are also important. In particular at distances larger than 20 kpc in- and outflows of metal-poor, and metal-rich gas, respectively are likely to play a major role in the enrichment history of the gas. E.g. Bouché et al. (2013) argue that the lower metallicity of a DLA towards HE 2243–60 with the DLA galaxy detected at an impact parameter 26 kpc can be explained by dilution of the DLA from pristine material.
By decomposing the term for in Eq. 3 we have shown that it reduces the scatter of the scaling relation. The scatter around the predicted relation (Eq. 3) is 0.39 dex in , which is smaller than the intrinsic scatter if we assume a constant metallicity throughout the galaxy. has the units of dex kpc-1 and in this connection represents a metallicity gradient in the outskirts of the DLA galaxies. Some additional scatter of metallicity gradients is expected because DLA galaxies have mixed morphological types (Rao et al., 2003; Chen et al., 2005; Rao et al., 2011) and random orientations and inclinations with respect to the DLA line of sight. The environment of the DLA galaxy may also play a role, as mergers and interactions between galaxies will change the gradients.
5.1 Group environments
Some low-redshift DLA galaxies are located in crowded regions, where, on average, five separate galaxies are detected within 10″ from the QSO line of sight (Chen & Lanzetta, 2003). An origin in a group environment is consistent with the fact that some of the low-redshift DLA galaxies discussed in this paper are found in spectroscopically confirmed groups. This is the case for Q1127–147 and Q0235+164 (Rao et al., 2003; Kacprzak et al., 2010), while another example of a DLA galaxy known to reside in a group is the DLA towards PKS 0952+179 (Rao et al., 2003). Even though spectroscopic confirmations are missing, several other DLA galaxies reside in over-densities within 50 kpc at (Chen & Lanzetta, 2003; Rao et al., 2011).
For the high-redshift DLA sample, we know that the region around the DLA galaxy towards Q2206-1958 has a complex morphology with several compact clumps at the DLA redshift (Møller et al., 2002; Weatherley et al., 2005). As such, it presents a clear case of a high redshift merger event and the build up of a massive galaxy. In other cases, multiple galaxies are detected within 6″(corresponding to 50 kpc) from the QSO line of sight in high spatial resolution HST images (Warren et al., 2001). However, without spectroscopic observations of all these galaxies, we cannot determine if these also represent galaxies in groups environments at the DLA redshift, lie at the QSO redshifts, or are entirely unrelated to either of these.
DLA sight lines that are found to intersect group environments pose the specific question of how to relate the confirmed DLA galaxy(ies) and the DLA gas metallicity. There is no simple and unique answer to this question since some groups are only loosely bound and may have been formed very recently, while other groups are very compact and show clear signs of interaction and even merging in progress. Interactions between galaxies give rise to more shallow metallicity gradients (Rupke et al., 2010), but observations only refer to strongly interacting spiral galaxies, while here we study the extended outskirts of the galaxies irrespectively on their morphologies. We have therefore taken the view that in open groups where galaxies at the DLA redshift are found at very large projected distances from each other, like in the case of Q1127–145, the DLA gas metallicity is likely to be closely connected to the galaxy at the smallest impact parameter. In compact groups on the other hand, the DLA gas metallicity could reveal properties of the tidally stripped gas in the group, and therefore reflect the total integrated mass of the merging group like in the case of Q2206–1958.
The question of possible mis-identification is addressed in Appendix A, where we demonstrate that the results in Sect. 4 are robust. Our tests support that the strategy to identify the DLA galaxy described above is correct.
5.2 Metallicity gradients in absorption selected galaxies
While we infer metallicity gradients in DLA galaxies indirectly via the stellar mass prediction, metallicity gradients can be measured directly by comparing the DLA absorption metallicities with oxygen abundances derived from strong emission-line diagnostics as discussed in Sect. 4.2. We showed that the two methods both reveal gradients around –0.02 dex kpc-1. A few other DLAs have measured metallicity gradients consistent with this number. Chen et al. (2005) analyse six DLA systems at (four of which are also included in our investigation, while the other two do not fulfill the criteria listed in Section 2) and find an average gradient of ( dex kpc-1. With in the cosmology adopted here, this implies a gradient of dex kpc-1. For two DLA systems at , Péroux et al. (2014) find similar shallow gradients of and dex kpc-1.
5.3 Metallicity gradients in galaxy discs
While the measurements of the gradients above refer to the extended outskirts of the galaxies, in few cases, metallicity gradients can be measured directly in the galaxy discs. This requires high spatial-resolution and resolved spectroscopy for example from integral field spectra coupled with adaptive optics observations. Péroux et al. (2011a, 2013) use VLT/SINFONI to measure metallicity gradients based on spatially resolved emission line ratios from H ii regions in the discs of three DLA galaxies including Q1009–0026, and they report values ranging from to dex kpc-1 measured over a few kpc in radius.
Investigations of non-absorption selected galaxies chosen within the same redshift bins and luminosity intervals, have substantial larger sample sizes to draw from. Shallow gradients of dex kpc-1 in galaxy discs at have been measured (Swinbank et al., 2012), while even positive gradients have been inferred from galaxies at (Queyrel et al., 2012).
Metallicity gradients derived from emission in H ii regions within a few kpc in the discs represent the chemical evolution taking place within the substructure of the galaxy discs themselves. Young starbursts may quickly enrich the immediate surroundings of the H ii regions, and thereby on short time scales give rise to steep gradients. When combining DLA metallicities with the global galaxy metallicity integrated over scales of tens of kpc on the other hand, we find much more shallow metallicity gradients in the outskirts of the DLA galaxies (–0.022 dex kpc-1). These shallow gradients reflect more closely the long-duration time scale of galaxy evolution and the gradual build of metals in the outer regions of galaxies, and is affected by both infalling pristine gas and outflows of metal rich gas.
5.4 Absorption line gradients in galaxy halos
The extended regions at distances of up to 40 kpc studied here probe the region where the interstellar medium extends to the circumgalactic medium (CGM) of galaxies. The metal composition of the CGM has been investigated in other types of galaxies besides DLA systems. Using stacks of spectra of Lyman break galaxies Steidel et al. (2010) demonstrate that metal lines are detected out to distances of 100 kpc, and that the absorption equivalent widths (EWs) are anti-correlated with distance. In low-redshift () galaxies a similar anti-correlation is seen (Werk et al., 2013). In the CGM of Lyman-break galaxies, Steidel et al. (2010) measure a change of the rest-frame EW(Si ii 1526) from 2 Å at 2 kpc to 0.4 Å at 30 kpc. For DLAs, there is a tight correlation between EW(Si ii 1526) and metallicity (Prochaska et al., 2008). If a similar relation exist for the halos around Lyman break galaxies, this implies an average gradient of dex kpc-1. Unfortunately, the EW of Si ii is rarely reported for DLAs, so we cannot test this relation directly in our sample.
Mg ii absorbers are also frequently used to probe the CGM, showing a clear trend of decreasing EW with impact parameter (Churchill et al., 2000). However, the strongest systems with rest-frame EW(Mg ii 2796)1Å do not show a strong anti-correlation (Nielsen et al., 2013). The DLA systems analysed here are likely all strong Mg ii absorbers (see also Rao & Turnshek, 2000). For six of the DLAs, which have reported rest-frame EW(Mg ii) between Å in the literature, we do not find any clear trend with impact parameter as expected.
6 Conclusions
The long standing quest for the nature of DLA galaxies is finally nearing its conclusion. It was recently shown (M13) that the stellar mass of DLA galaxies can be computed from a simple relation depending only on the metallicity of the absorbing gas, the redshift, and a parameter, , which is the offset between metallicity measured from the absorbing DLA gas and that measured from emission lines of the same galaxy. The parameter is in most cases not known, and in this paper we have addressed how it may be determined or estimated in cases where it cannot be measured directly.
could be a function of several properties of the DLA galaxy, but in particular one of those is an obvious candidate. From studies at low redshifts it is known that galaxies have metallicity gradients such that they in general have a higher metallicity in the centre and in the mean correspondingly lower metallicity at increasing distance from the centre.
In this paper we have addressed two questions. Since the prescription for computing DLA stellar masses provided in M13 was derived on a purely statistical basis we first tested, via comparison to stellar masses determined directly from SED fits to photometric data, if the prescription is correct. As a byproduct of this test we also determined individual values of for each DLA galaxy in our sample. Secondly we then tested if our sample showed any evidence for the expected signature of metallicity gradients. Our conclusions on those two tests can be summarised as follows:
-
1.
Our independent test confirms the statistical MzZ relation reported in M13. We find a mean value with a scatter of . In case nothing else than metallicity and redshift is known about a DLA galaxy then we recommend to use this value in combination with the M13 prescription.
-
2.
We also find that the data show a correlation between and impact parameter similar to known metallicity gradients at low redshift. We find a best fit for a gradient dex kpc-1 in the entire range of redshifts to . The sample is still very small, and because of the distribution of impact parameters and redshifts in our sample, one could also interpret the correlation as a redshift evolution of without metallicity gradients. The redshift evolution interpretation is in conflict with results from several large independent surveys, while the metallicity gradient interpretation is favoured because metallicity gradients are well documented in the local universe and out to at least .
-
3.
The residual internal scatter of the relation is significantly reduced (for the same number of fitted parameters) in the metallicity gradient formulation of the prescription. This is additional independent support that we are indeed measuring metallicity gradients in the DLA galaxies.
-
4.
The sample includes three sub-DLA systems. If we exclude those from the analysis, the results remain unchanged. This suggests that high-column density sub-DLAs follow the same relation as laid out by classical DLAs.
Based on those results we have expanded the parameter and presented an improved prescription as given in Eq. 3. We recommend to use this updated form of the relation in cases where the impact parameter is known, or where at least limits can be placed on it.
Acknowledgements
We thank Roser Pello for providing updates of- and help with the use of the HyperZ code. The Dark Cosmology Centre is funded by the DNRF. LC is supported by the EU under a Marie Curie Intra-European Fellowship, contract PIEF-GA-2010-274117. The research leading to these results has received funding from the European Research Council under the European Union’s Seventh Framework Program (FP7/2007-2013)/ERC Grant agreement no. EGGS-278202. LC thanks ESO, Garching for the hospitality during the work for this paper, and for the support by the DFG cluster of excellence ‘Origin and Structure of the Universe’.
References
- Asplund et al. (2009) Asplund, M., Grevesse, N., Sauval, A. J., & Scott, P. 2009, ARA&A, 47, 481
- Belli et al. (2013) Belli, S., Jones, T., Ellis, R. S., & Richard, J. 2013, ApJ, 772, 141
- Bergeron & Boissé (1991) Bergeron, J., & Boissé, P. 1991, A&A, 243, 344
- Bolzonella et al. (2000) Bolzonella, M., Miralles, J.-M., & Pelló, R. 2000, A&A, 363, 476
- Bouché et al. (2013) Bouché, N., Murphy, M. T., Kacprzak, G. G., Péroux, C., Contini, T., Martin, C. L., & Dessauges-Zavadsky, M. 2013, Science, 341, 50
- Bouché et al. (2012) Bouché, N., et al. 2012, MNRAS, 419, 2
- Bruzual & Charlot (2003) Bruzual, G., & Charlot, S. 2003, MNRAS, 344, 1000
- Centurión et al. (2003) Centurión, M., Molaro, P., Vladilo, G., Péroux, C., Levshakov, S. A., & D’Odorico, V. 2003, A&A, 403, 55
- Chabrier (2003) Chabrier, G. 2003, PASP, 115, 763
- Chen et al. (2005) Chen, H.-W., Kennicutt, R. C., Jr., & Rauch, M. 2005, ApJ, 620, 703
- Chen & Lanzetta (2003) Chen, H.-W., & Lanzetta, K. M. 2003, ApJ, 597, 706
- Christensen et al. (2012) Christensen, L., et al. 2012, MNRAS, 427, 1973
- Christensen et al. (2004) Christensen, L., Sánchez, S. F., Jahnke, K., Becker, T., Wisotzki, L., Kelz, A., Popović, L. Č., & Roth, M. M. 2004, A&A, 417, 487
- Christensen et al. (2007) Christensen, L., Wisotzki, L., Roth, M. M., Sánchez, S. F., Kelz, A., & Jahnke, K. 2007, A&A, 468, 587
- Chun et al. (2010) Chun, M. R., Kulkarni, V. P., Gharanfoli, S., & Takamiya, M. 2010, AJ, 139, 296
- Churchill et al. (2000) Churchill, C. W., Mellon, R. R., Charlton, J. C., Jannuzi, B. T., Kirhakos, S., Steidel, C. C., & Schneider, D. P. 2000, ApJS, 130, 91
- Cooke et al. (2011) Cooke, R., Pettini, M., Steidel, C. C., Rudie, G. C., & Nissen, P. E. 2011, MNRAS, 417, 1534
- Djorgovski et al. (1996) Djorgovski, S. G., Pahre, M. A., Bechtold, J., & Elston, R. 1996, Nature, 382, 234
- Erb et al. (2006) Erb, D. K., Shapley, A. E., Pettini, M., Steidel, C. C., Reddy, N. A., & Adelberger, K. L. 2006, ApJ, 644, 813
- Fukugita & Ménard (2014) Fukugita, M., & Ménard, B. 2014, ArXiv e-prints
- Fynbo et al. (2013) Fynbo, J. P. U., et al. 2013, MNRAS, 436, 361
- Fynbo et al. (2010) Fynbo, J. P. U., et al. 2010, MNRAS, 408, 2128
- Fynbo et al. (2011) Fynbo, J. P. U., et al. 2011, MNRAS, 413, 2481
- Fynbo et al. (2008) Fynbo, J. P. U., Prochaska, J. X., Sommer-Larsen, J., Dessauges-Zavadsky, M., & Møller, P. 2008, ApJ, 683, 321
- Guillemin & Bergeron (1997) Guillemin, P., & Bergeron, J. 1997, A&A, 328, 499
- Ilbert et al. (2009) Ilbert, O., et al. 2009, ApJ, 690, 1236
- Jorgenson & Wolfe (2014) Jorgenson, R. A., & Wolfe, A. M. 2014, ApJ, 785, 16
- Kacprzak et al. (2010) Kacprzak, G. G., Murphy, M. T., & Churchill, C. W. 2010, MNRAS, 406, 445
- Kewley & Dopita (2002) Kewley, L. J., & Dopita, M. A. 2002, ApJS, 142, 35
- Kewley & Ellison (2008) Kewley, L. J., & Ellison, S. L. 2008, ApJ, 681, 1183
- Komatsu et al. (2011) Komatsu, E., et al. 2011, ApJS, 192, 18
- Krogager et al. (2013) Krogager, J.-K., et al. 2013, MNRAS, 433, 3091
- Krogager et al. (2012) Krogager, J.-K., Fynbo, J. P. U., Møller, P., Ledoux, C., Noterdaeme, P., Christensen, L., Milvang-Jensen, B., & Sparre, M. 2012, MNRAS, 424, L1
- Kulkarni et al. (2005) Kulkarni, V. P., Fall, S. M., Lauroesch, J. T., York, D. G., Welty, D. E., Khare, P., & Truran, J. W. 2005, ApJ, 618, 68
- Kulkarni et al. (2006) Kulkarni, V. P., Woodgate, B. E., York, D. G., Thatte, D. G., Meiring, J., Palunas, P., & Wassell, E. 2006, ApJ, 636, 30
- Lane et al. (1998) Lane, W., Smette, A., Briggs, F., Rao, S., Turnshek, D., & Meylan, G. 1998, AJ, 116, 26
- Lara-López et al. (2010) Lara-López, M. A., et al. 2010, A&A, 521, L53
- Le Brun et al. (1997) Le Brun, V., Bergeron, J., Boisse, P., & Deharveng, J. M. 1997, A&A, 321, 733
- Ledoux et al. (2002) Ledoux, C., Bergeron, J., & Petitjean, P. 2002, A&A, 385, 802
- Ledoux et al. (2006) Ledoux, C., Petitjean, P., Fynbo, J. P. U., Møller, P., & Srianand, R. 2006, A&A, 457, 71
- Madau (1995) Madau, P. 1995, ApJ, 441, 18
- Maiolino et al. (2008) Maiolino, R., et al. 2008, A&A, 488, 463
- Mannucci et al. (2010) Mannucci, F., Cresci, G., Maiolino, R., Marconi, A., & Gnerucci, A. 2010, MNRAS, 408, 2115
- Møller et al. (2004) Møller, P., Fynbo, J. P. U., & Fall, S. M. 2004, A&A, 422, L33
- Møller et al. (2013) Møller, P., Fynbo, J. P. U., Ledoux, C., & Nilsson, K. K. 2013 (M13), MNRAS, 430, 2680
- Møller & Jakobsen (1990) Møller, P., & Jakobsen, P. 1990, A&A, 228, 299
- Møller & Warren (1998) Møller, P., & Warren, S. J. 1998, MNRAS, 299, 661
- Møller et al. (2002) Møller, P., Warren, S. J., Fall, S. M., Fynbo, J. U., & Jakobsen, P. 2002, ApJ, 574, 51
- Neeleman et al. (2013) Neeleman, M., Wolfe, A. M., Prochaska, J. X., & Rafelski, M. 2013, ApJ, 769, 54
- Nielsen et al. (2013) Nielsen, N. M., Churchill, C. W., & Kacprzak, G. G. 2013, ApJ, 776, 115
- Noeske et al. (2007) Noeske, K. G., et al. 2007, ApJ, 660, L43
- Noterdaeme et al. (2012) Noterdaeme, P., et al. 2012, A&A, 540, A63
- Péroux et al. (2013) Péroux, C., Bouché, N., Kulkarni, V. P., & York, D. G. 2013, MNRAS, 436, 2650
- Péroux et al. (2011a) Péroux, C., Bouché, N., Kulkarni, V. P., York, D. G., & Vladilo, G. 2011a, MNRAS, 410, 2237
- Péroux et al. (2011b) Péroux, C., Bouché, N., Kulkarni, V. P., York, D. G., & Vladilo, G. 2011b, MNRAS, 410, 2251
- Péroux et al. (2012) Péroux, C., Bouché, N., Kulkarni, V. P., York, D. G., & Vladilo, G. 2012, MNRAS, 419, 3060
- Péroux et al. (2014) Péroux, C., Kulkarni, V. P., & York, D. G. 2014, MNRAS, 437, 3144
- Pettini et al. (1994) Pettini, M., Smith, L. J., Hunstead, R. W., & King, D. L. 1994, ApJ, 426, 79
- Pontzen et al. (2008) Pontzen, A., et al. 2008, MNRAS, 390, 1349
- Prochaska et al. (2008) Prochaska, J. X., Chen, H.-W., Wolfe, A. M., Dessauges-Zavadsky, M., & Bloom, J. S. 2008, ApJ, 672, 59
- Prochaska et al. (2003) Prochaska, J. X., Gawiser, E., Wolfe, A. M., Castro, S., & Djorgovski, S. G. 2003, ApJ, 595, L9
- Queyrel et al. (2012) Queyrel, J., et al. 2012, A&A, 539, A93
- Rafelski et al. (2012) Rafelski, M., Wolfe, A. M., Prochaska, J. X., Neeleman, M., & Mendez, A. J. 2012, ApJ, 755, 89
- Rao et al. (2011) Rao, S. M., Belfort-Mihalyi, M., Turnshek, D. A., Monier, E. M., Nestor, D. B., & Quider, A. 2011, MNRAS, 416, 1215
- Rao et al. (2003) Rao, S. M., Nestor, D. B., Turnshek, D. A., Lane, W. M., Monier, E. M., & Bergeron, J. 2003, ApJ, 595, 94
- Rao & Turnshek (2000) Rao, S. M., & Turnshek, D. A. 2000, ApJS, 130, 1
- Rupke et al. (2010) Rupke, D. S. N., Kewley, L. J., & Chien, L.-H. 2010, ApJ, 723, 1255
- Savaglio et al. (2005) Savaglio, S., et al. 2005, ApJ, 635, 260
- Schaerer & de Barros (2009) Schaerer, D., & de Barros, S. 2009, A&A, 502, 423
- Schlafly & Finkbeiner (2011) Schlafly, E. F., & Finkbeiner, D. P. 2011, ApJ, 737, 103
- Schulte-Ladbeck et al. (2005) Schulte-Ladbeck, R. E., König, B., Miller, C. J., Hopkins, A. M., Drozdovsky, I. O., Turnshek, D. A., & Hopp, U. 2005, ApJ, 625, L79
- Steidel et al. (2010) Steidel, C. C., Erb, D. K., Shapley, A. E., Pettini, M., Reddy, N., Bogosavljević, M., Rudie, G. C., & Rakic, O. 2010, ApJ, 717, 289
- Steidel et al. (1995) Steidel, C. C., Pettini, M., & Hamilton, D. 1995, AJ, 110, 2519
- Swinbank et al. (2012) Swinbank, A. M., Sobral, D., Smail, I., Geach, J. E., Best, P. N., McCarthy, I. G., Crain, R. A., & Theuns, T. 2012, MNRAS, 426, 935
- Tremonti et al. (2004) Tremonti, C. A., et al. 2004, ApJ, 613, 898
- Turnshek et al. (2001) Turnshek, D. A., Rao, S., Nestor, D., Lane, W., Monier, E., Bergeron, J., & Smette, A. 2001, ApJ, 553, 288
- Warren & Møller (1996) Warren, S. J., & Møller, P. 1996, A&A, 311, 25
- Warren et al. (2001) Warren, S. J., Møller, P., Fall, S. M., & Jakobsen, P. 2001, MNRAS, 326, 759
- Watson et al. (2011) Watson, D., et al. 2011, ApJ, 741, 58
- Weatherley et al. (2005) Weatherley, S. J., Warren, S. J., Møller, P., Fall, S. M., Fynbo, J. U., & Croom, S. M. 2005, MNRAS, 358, 985
- Werk et al. (2013) Werk, J. K., Prochaska, J. X., Thom, C., Tumlinson, J., Tripp, T. M., O’Meara, J. M., & Peeples, M. S. 2013, ApJS, 204, 17
- Wolfe et al. (2003) Wolfe, A. M., Gawiser, E., & Prochaska, J. X. 2003, ApJ, 593, 235
- Wolfe et al. (2004) Wolfe, A. M., Howk, J. C., Gawiser, E., Prochaska, J. X., & Lopez, S. 2004, ApJ, 615, 625
- Wuyts et al. (2012) Wuyts, E., Rigby, J. R., Sharon, K., & Gladders, M. D. 2012, ApJ, 755, 73
- Yanny et al. (1989) Yanny, B., York, D. G., & Gallagher, J. S. 1989, ApJ, 338, 735
- Yuan & Kewley (2009) Yuan, T.-T., & Kewley, L. J. 2009, ApJ, 699, L161
- Zaritsky et al. (1994) Zaritsky, D., Kennicutt, R. C., Jr., & Huchra, J. P. 1994, ApJ, 420, 87
Appendix A Robustness of results considering group environments
In seven cases the fields included a second possible identification of the DLA galaxy. In two of those cases the spectroscopic redshifts are identical, in one case a divergent photometric redshift has been published, in the remaining cases no redshift information is available. Those multi-candidate fields represent either chance alignments at vastly different redshifts, or could be various stages of open or compact group environments and/or mergers in progress. In section 5.1 we described in detail the strategy we followed in order to identify the most likely candidate. Here we will test how robust our results are against possible mis-identifications.
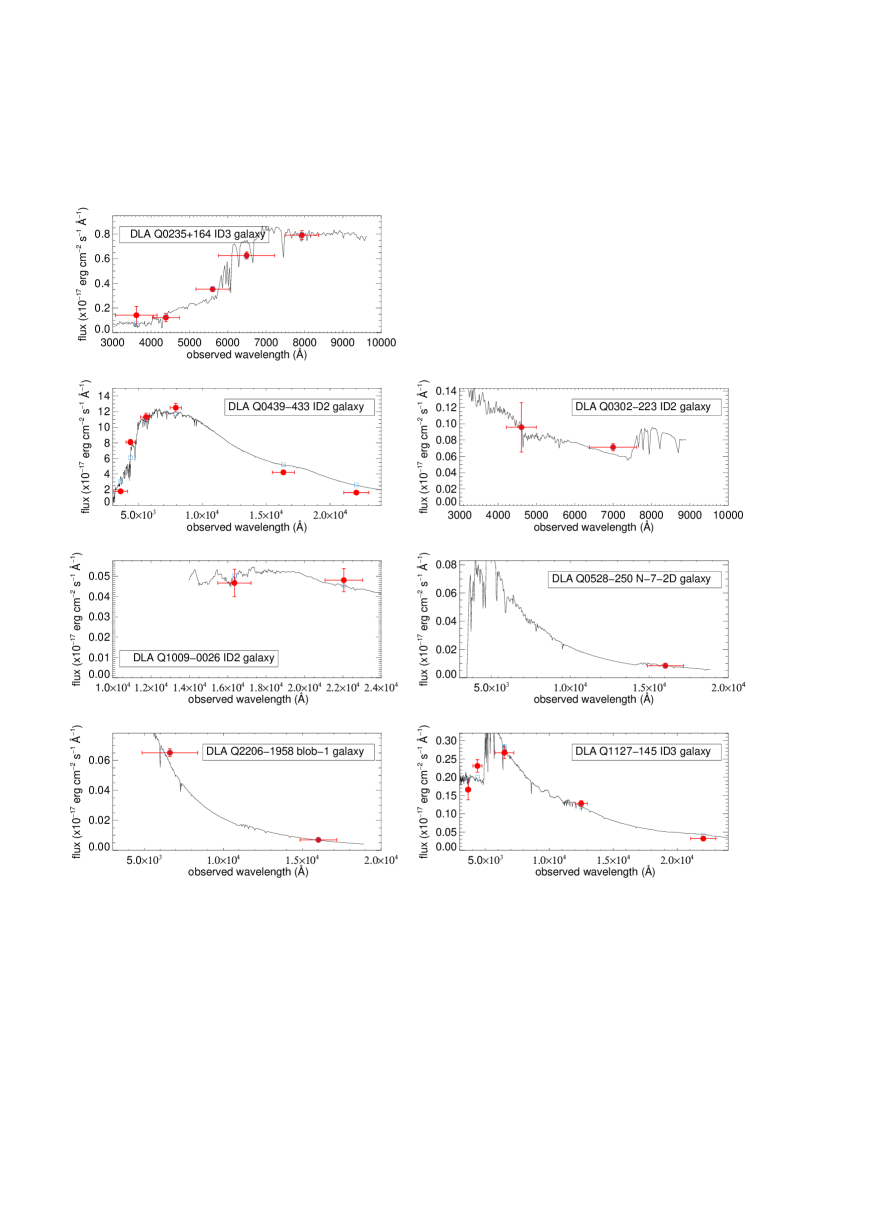
In Fig. 5 we show the SED fits of the seven alternative candidate DLA galaxies on the assumption that the candidates are indeed at the redshift of the DLAs, and in Table 4 we list the relevant data for those seven galaxies. In case we assume that our strategy for identification is incorrect then we know nothing about how to correctly identify those seven DLAs and we have in fact just selected random galaxies. In the mean we would therefore have 3–4 correct identifications and a similar number of mis-identifications. At much lower probability we might even have 5, 6, or even all 7 mis-identified. We carried out a full set of tests as follows. Assuming wrong identifications we randomly picked of the candidates from Table 4 and replaced the corresponding entries for and in Tables 1 and 3. We then determined the mean of the results from the randomly replaced samples for all possible values of as listed in Table 5. We found that the values of both and for all are well within the 1 range of the results reported in Section 4. We also found that the scatter of the relations were monotonically rising the more of the DLA galaxies we replaced with alternative identifications. In Fig. 6 we show a number of representative randomly replaced samples for different values of .
Based on those tests we conclude that:
1) The results reported in the main text (value of , metallicity slope and general validity of Eq. 1) are very robust against the possible mis-identifications.
2) The more mis-identifications we assume the larger is the resulting scatter of the relations. This strongly supports that the strategy for identification we set out in Sect. 5.1 is correct.
| name | [kpc] | log (SED) [M⊙] | information |
|---|---|---|---|
| Q0235+164 ID3 | 40.9 | 10.450.07 | same |
| Q0302–223 ID2 | 21.8 | 9.430.20 | no info |
| Q0439–433 ID2 | 20.0 | 10.400.01 | = 0.8 |
| Q0528–250 N-7-2D | 29.3 | 9.150.20 | no info |
| Q1009–0026 ID2 | 40.7 | 10.760.10 | no info |
| Q1127–145 ID3 | 25.7 | 8.620.08 | no info |
| Q2206–1958 blob2 | 9.7 | 8.860.31 | same |
| replacements | |||
|---|---|---|---|
| 0 | 0.310 | 0.022 | 0.222 |
| 1 | 0.319 | 0.021 | 0.229 |
| 2 | 0.327 | 0.021 | 0.236 |
| 3 | 0.336 | 0.021 | 0.244 |
| 4 | 0.345 | 0.021 | 0.250 |
| 5 | 0.355 | 0.021 | 0.256 |
| 6 | 0.365 | 0.020 | 0.262 |
| 7 | 0.375 | 0.020 | 0.268 |
