1404.3538
Improving weather radar by fusion and classification
Abstract
In air traffic management (ATM) all necessary operations (tactical planing, sector configuration, required staffing, runway configuration, routing of approaching aircrafts) rely on accurate measurements and predictions of the current weather situation. An essential basis of information is delivered by weather radar images (WXR), which, unfortunately, exhibit a vast amount of disturbances. Thus, the improvement of these datasets is the key factor for more accurate predictions of weather phenomena and weather conditions. Image processing methods based on texture analysis and geometric operators allow to identify regions including artefacts as well as zones of missing information. Correction of these zones is implemented by exploiting multi-spectral satellite data (Meteosat Second Generation). Results prove that the proposed system for artefact detection and data correction significantly improves the quality of WXR data and, thus, enables more reliable weather now- and forecast leading to increased ATM safety.
1 Motivation
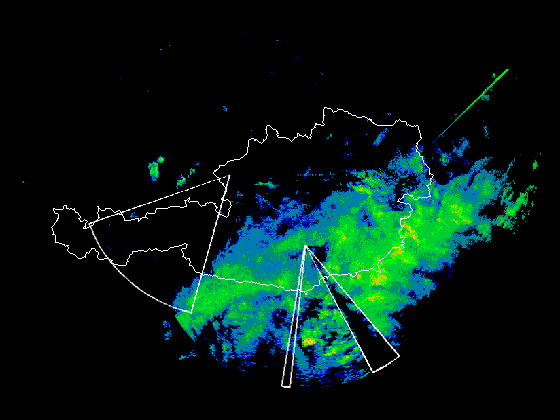
Air traffic controllers face the challenge to cope with a huge amount of information. Significant sources are found in images and other sensors measuring the current weather conditions. By using weather radar (WXR), one can predict three dimensional evaluation and forecast of precipitation, danger of icing, storm expansion and development as well as its strength [5]. But due to the mountainous region of Austria, the limited number of stations, obstructions arising in close range to the transmitter, a limited sampling possibility, beam spread, and other signal-absorbing effects it is not possible to cover the complete Austrian area and/or the images are afflicted by interferences. Fig. 1 gives two examples of such artefact appearance in WXR imagery, displayed as composite of maximum projected weather radar reflectivity derived from radar sites for the Austrian airspace.
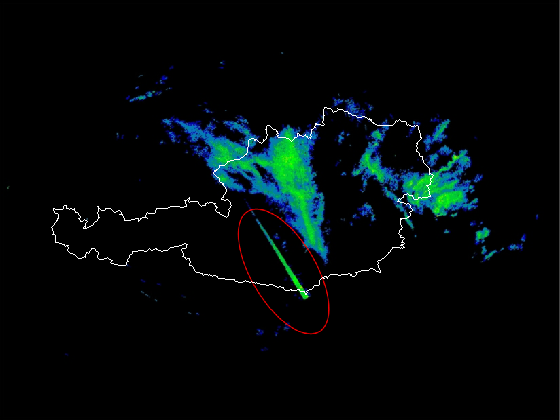
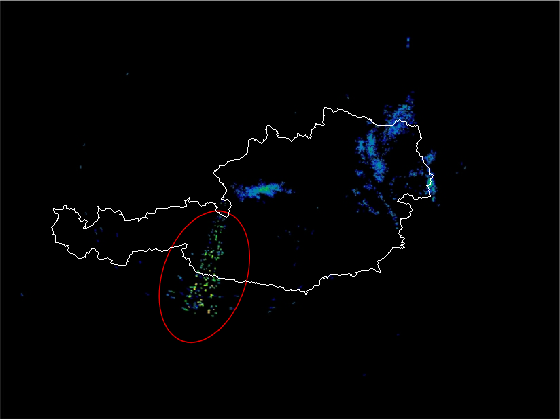
The classes of artefacts include anomalies like clutter (sea and ground clutter), false echoes (caused by aircrafts, birds or insects, dust particles, atmospheric turbulence, the sun or other radars), bright bands (caused by height reflectivity of a cloud’s melting zone) and beam blockage (shadowing, concealed zones).
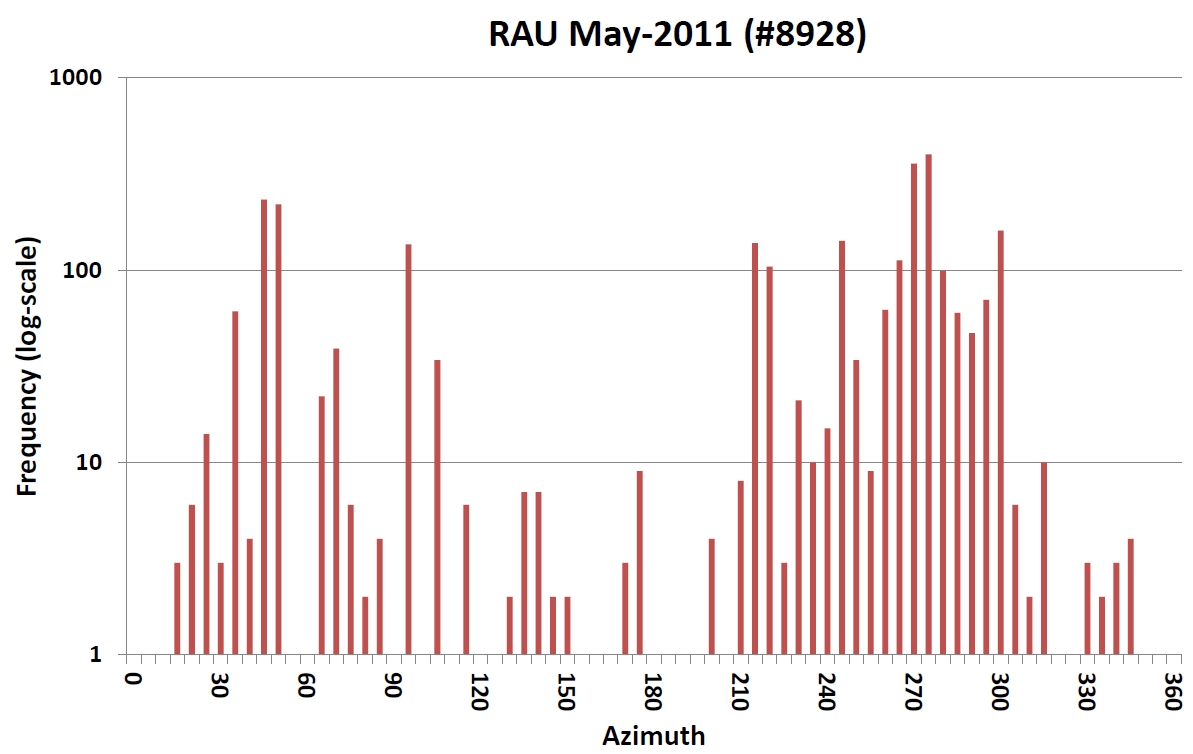
A statistic evaluation111Data provided by Austro Control. of WXR images from one single radar station during a period of one month (May 2011) showed that artefacts due to ’Radio Local Area Network’ (RLAN) disturbances were found in from images (i.e. afflicted images, Fig. 2). Due to the fact that RLAN disturbances are an international problem, European-wide activities to eliminate this type of artefacts are already pursued (e.g. [4]).
This supports the fact that the improvement of WXR images - by combining them with other sensors in order to complete concealed zones and eliminate interfering signals without losing important meteorological information - is essential for an accurate prediction of weather phenomenons and atmospheric conditions (see also [14]), which is furthermore an essential factor in the work process of air traffic controllers.
In recent literature some efforts to enhance the quality of radar data by detecting and removing these unwanted disturbances can be found: Gill [2] presents a method for clutter removal. The method ’Elevation angle Dependent Co-Occurrence Matrix EDCM’ exploits the property, that clutter, due to its surface-induced origin, usually is associated with the radar’s lower elevations. Ziyang et al. [15] propose a noise filtering algorithm based on fuzzy features and Support Vector Machines (SVM), which effectively allows the removal of ground clutter or clear sky echoes. Peura [9] develops a dedicated set of detectors according to the respective artefact class. Tools for the detection of birds and insects, speckle noise, line segments (external emitter and sun) or ships and airplanes are given. Lakshmanan and Zhang [6] focus on artefacts caused by biological contaminants: insects, bats and birds employing clustering, segmentation, and neural networks (NN).
In order to correct disturbed areas, data from other sources has to be included. Most notable is weather satellite data, where first activities on ’gap filling’ are reported ([1], [8]). Satellite data for Europe is available in 12 spectral channels and a temporal resolution of 15 minutes.
The work presented here does not focus on specific classes of artefacts, but takes a more generalized approach by targeting several classes by a fusion-based concept of artefact detection and correction. In this concept texture-based processing is combined with geometry-related detectors, which furthermore are subject to a spatio-temporal analysis (Section 2). The affected areas as well as concealed zones in WXR data are completed in a meteorological reasonable manner with the help of satellite data employing classification approaches (Section 3).
2 Artefact Detection
WXR images represent precipitation values as bit data using reflectivity quantification values222Reflectivity values: , , , , , , , , , , , , and , where higher labels represent more intense zones of precipitation. The resolution of WXR images is resulting in images of the size for Austria.
Since artefacts in WXR images arise in a variety of appearances, their detection is based on a concept of fusing texture-based methods with geometry-related analysis. Texture-based detection is able to deliver a segmentation of the more general appearances of artefacts, whereas the geometry-related detection utilizes the circular properties of radar imaging.
2.1 Texture segmentation
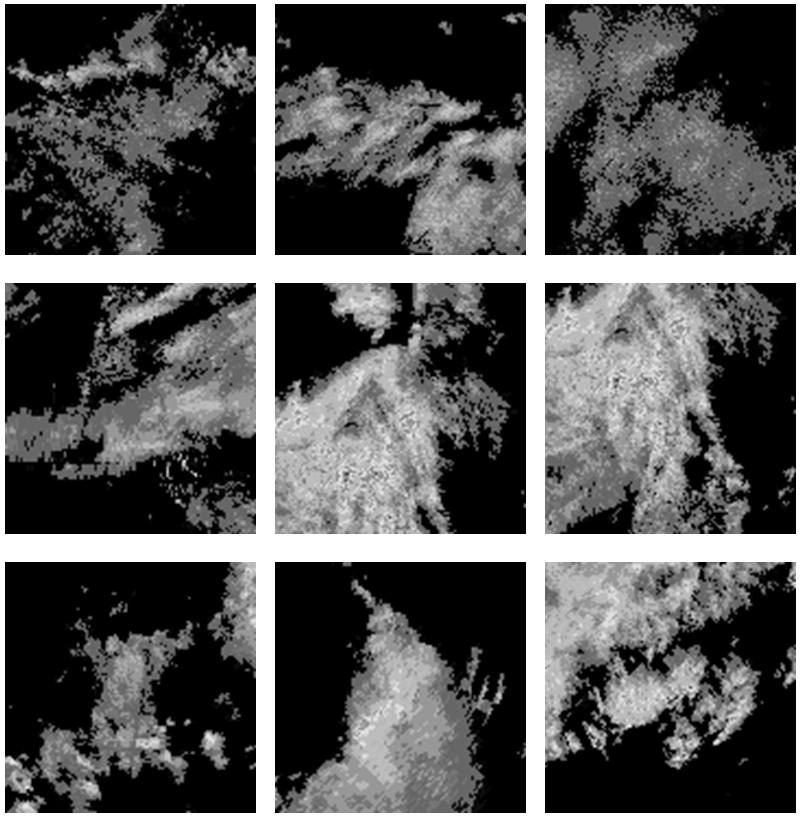
Based on the available WXR images333Data from one year, with a capturing interval of 5 minutes., 460 texture patches of zones with artefacts as well as normal precipitation were extracted serving as data for the selection of the best texture segmentation algorithm (Fig. 3).
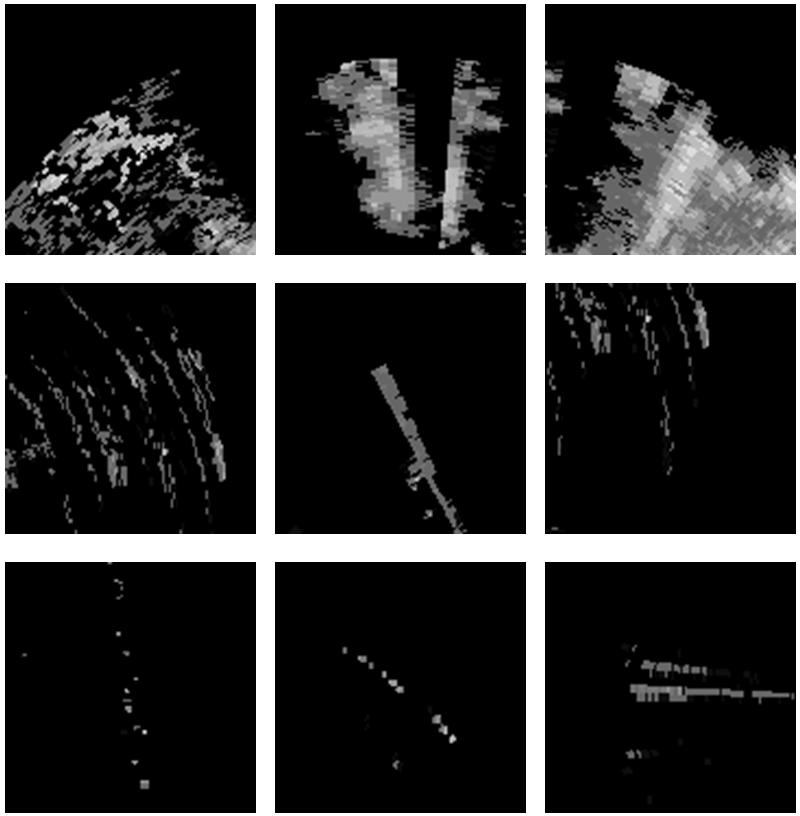
The variety of analysed texture segmentation methods included variants ranging from ’Grey Level Co-Occurrence Matrix’ ([3]) and ’Region Covariance Descriptor’ ([10]) over ’Gabor Filters’ in combination with other descriptors ([12]) to ’Leung-Malik Set’ ([7]) and ’Maximum Response Set’ ([13]). Best results were achieved with a covariance descriptor on feature images of Gabor filter outputs ([11]) by using six orientations and three frequencies resulting in 18 filter outputs on a neighbourhood of 39 pixels. The evaluation was performed with ’Nearest Neighbour Classification’ and ’Leave One Out Cross Validation’.
2.2 Geometric analysis
A certain amount of artefacts exhibit specific geometric appearances due to the principles of radar imaging and appear either as linear structures pointing towards the radar station or circular structures with the radar station as the centre (Fig. 4). The detection of these specific artefact classes is achieved with a combination of Hough-transformation and mathematical morphology utilizing properties in polar coordinates.
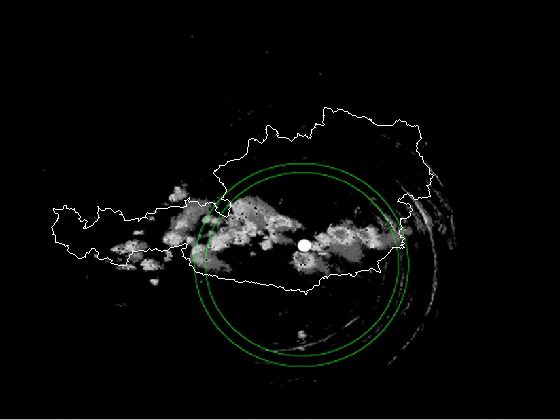
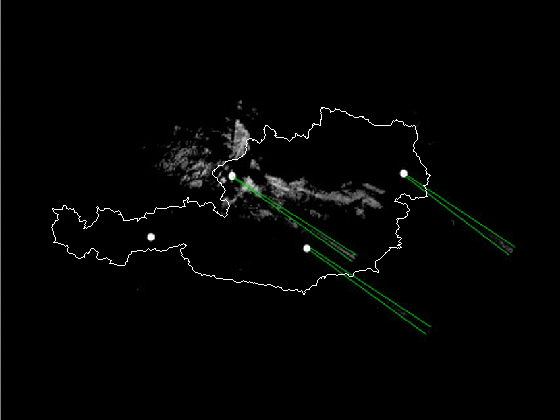
The complete sector of linear structures (Fig. 4 right) transforms to a vertical line in polar coordinates. By morphological closing and filtering for elongated vertical structures these artefacts are extracted in polar space. A reprojection to cartesian coordinates delivers the required structures. The circular structures tend to be composed by a number of small objects instead of connected circular regions. Thus, application of circular Hough transformation is best suited to detect these accumulated circular structures. Since the Hough space can be constrained to the parameters of the radar stations ( fixed centres and operating distance of ) and does not need a general search of the parameter space the application of Hough transformation stays computationally reasonable.
2.3 Fusion and performance
For evaluation of the artefact detection the necessary ground truth was established by manual pixel-based segmentation of 107 complete WXR images. Segmentation was done independently by three meteorologists and majority voting per pixel.
Texture segmentation alone could achieve a performance of 444Note that all performance values given do not consider the background class (no precipitation or artefact in the image) as this would lead to tremendously higher numbers, since background pixels (i.e. no precipitation) are more common than foreground pixels. correctly classified pixels with a sensitivity of and specificity of . The results indicate an already correct segmentation of artefact pixels, but still have a high number of false positives, which in turn would lead to too much filtering of precipitation in the following step of image correction. Thus, the texture-based segmentation was fused with the geometry-based detection and furthermore subjected to a spatio-temporal analysis.
Since artefacts tend to appear only for short periods of time in the same spot, the analysis of predecessor images significantly reduced the false positive detection. The inclusion of only two more timestamps in the fused system led to a tremendous improvement in performance with a number of correctly classified pixels for image sets, where all predecessor images were available with the standard time frame of 5 minutes. In some cases, due to hardware issues, WXR images are missing. Consequently, the predecessor images exhibit a longer timespan (e.g. minutes). But also in these cases the fused system delivered an improvement in comparison to pure texture-based segmentation with correctly classified pixels.
As drawback of the fused system, the number of false negatives, i.e. artefact pixels that could not be detected, is higher than in the pure texture-based system leading to a sensitivity of and a specificity of . Considering the application domain of air traffic management, it is essential that no significant precipitation is lost in the process. Thus, the trade-off in artefact detection is justified and the overall achieved system performance is .
3 Weather Radar Correction
Besides the removal of spurious zones in weather radar images, there are also concealed zones, mostly due to orographic shadowing. These zones appear as circle segments and are easily detected by an analysis of the precipitation sum over a year (Fig. 5 left).
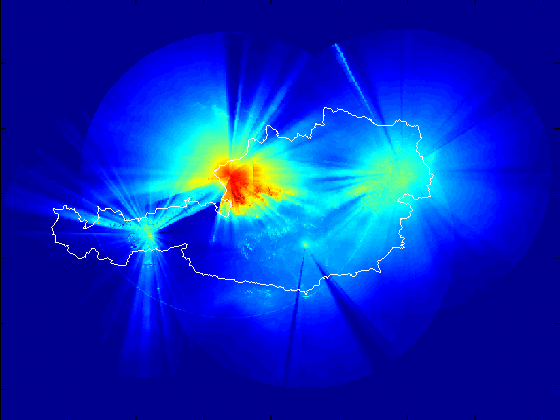
The shadow mask for each WXR image is derived by detection of linear boundaries of the current precipitation and verifying if this linear boundary corresponds to a boundary from the previously detected shadow zones in the summation image (Fig. 5 right). The mask derived from this analysis in combination with the mask derived from the artefact detection (Section 2) represents the overall correction mask of non-valid WXR pixels and builds the basis for the desired correction. The correction task itself is performed by utilizing the channels of the ’Meteosat Second Generation (MSG)’ satellite. The underlying hypothesis for the correction is that similarities in MSG images point to similar WXR values. Nevertheless, the locality of weather phenomena and orographic influences do not allow for a global classification of these regions. Local analysis is necessary in order to fill all non-valid pixels with meteorologically reasonable values.
In order to obtain local training data, each connected region in the correction mask is extracted by connected component labelling. The training set around each connected region is then obtained by repeated application of the morphological operation of dilation followed by subtraction of the original region mask. Consequently, training is performed for each region separately with the pixels obtained from its outside border.
3.1 Classification
Several classification concepts were evaluated for filling the concealed regions regarding the flexibility of the local approach. The drawback of the local approach is that less data is available for training, which made the application of more advanced classifiers such as SVM less successful. The k-nearest neighbour classifier, although being a simple algorithm, provided the best correction values at low computation times required for the online application. The classifier employs the MSG channels for each pixel inside the region to be corrected and searches the training set for pixels with similar MSG-vectors. After calculating the Euclidean distance between the pixel to be corrected and the MSG-vectors available for training, the top- neighbours of minimum distance return WXR-labels. From these WXR-labels the mean value is used to correct the desired pixel.
3.2 Evaluation of correction results
Evaluation of correction performance was done for simulated regions of three different sizes (small, medium and large), respectively containing 100, 1000 and 10000 pixels. Positioning was done on valid regions inside the original WXR images, so that the removed data could directly be used as ground truth data for evaluation of correction quality. Allowing for plus or minus one intensity class error, WXR correction was correctly performed for of the pixels for small, of the pixels for medium and of the pixels for large regions. As an example a snapshot of the confusion matrix for the medium sized evaluation is given in Table 1555High labels from to were left out for illustration clarity as all values were reflecting that severe precipitation is quite rare and those values did not appear in the set of test data..
| - | 0 | 1 | 2 | 3 | 4 | 5 | 6 | 7 |
|---|---|---|---|---|---|---|---|---|
| 0 | 0.93 | 0.31 | 0.11 | 0.02 | 0.02 | 0.01 | 0.01 | 0.00 |
| 1 | 0.05 | 0.34 | 0.15 | 0.03 | 0.02 | 0.00 | 0.00 | 0.00 |
| 2 | 0.02 | 0.29 | 0.52 | 0.24 | 0.10 | 0.03 | 0.02 | 0.00 |
| 3 | 0.00 | 0.03 | 0.15 | 0.36 | 0.20 | 0.07 | 0.03 | 0.01 |
| 4 | 0.00 | 0.02 | 0.06 | 0.27 | 0.42 | 0.27 | 0.13 | 0.06 |
| 5 | 0.00 | 0.01 | 0.01 | 0.06 | 0.18 | 0.34 | 0.26 | 0.09 |
| 6 | 0.00 | 0.00 | 0.00 | 0.01 | 0.05 | 0.23 | 0.40 | 0.50 |
| 7 | 0.00 | 0.00 | 0.00 | 0.00 | 0.01 | 0.04 | 0.13 | 0.31 |
| GT+/-1 | 0.98 | 0.95 | 0.82 | 0.87 | 0.80 | 0.85 | 0.80 | 0.84 |
| Sample size | 71343 | 4653 | 15501 | 4592 | 4040 | 1179 | 875 | 176 |
From the results it is apparent that WXR correction using a k-nearest neighbour classifier works best for small to medium sized regions supporting the hypothesis of locality in the correction process. An exception are zones with higher precipitation rates, as they are generally smaller and less often present in the training sets. These effects lead to an underestimation of the precipitation rates in the corrected regions. Another important aspect of correction is the meteorological plausibility of the appearance of the correction. To illustrate the quality of the results Fig. 6 displays a sample region used during classification evaluation.
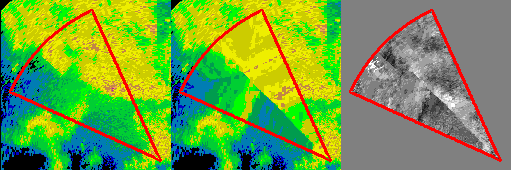
Dark areas in the error images denote negative errors, whereas light areas denote positive errors. In the displayed large mask a maximum error of is achieved. For medium sized masks the error does not exceed .
For further improvement of the correction results it is planned to include information from tracking precipitation cells over time instances into concealed regions as well as other sources such as numerical weather prediction (NWP) data (e.g. temperature, pressure fields etc.).
4 Conclusion
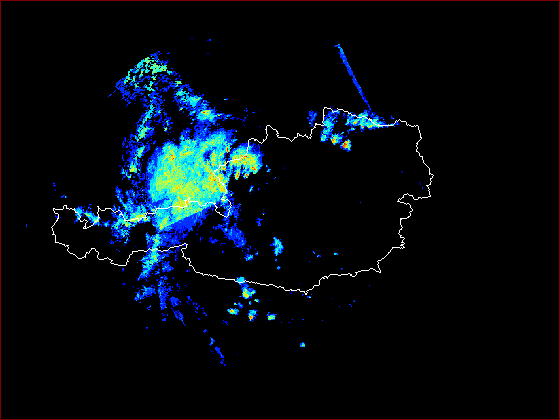
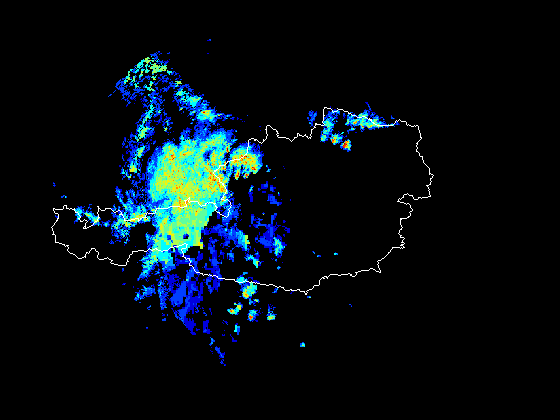
This paper presents a system that is able to improve weather radar images in a meteorologically reasonable manner consisting of two components: artefact detection and removal as well as completing concealed zones. The system led to filing of two positively evaluated patents and is currently under evaluation in a semi-operational environment at ’Austro Control GmbH’, where the results are compared to the original WXR images in parallel operation. Therefore, a web-based logbook-tool has been established that gives feedback on the quality of the corrected WXR images. Fig. 7 displays the final result of the image processing chain for weather radar improvement, where areas with classification values are pixelated on a coarser scale for better illustration. It clearly shows the regions of removed artefacts in the North and the completed zones in the South-West.
In the future it is planned to integrate the system directly at the sensor site (WXR station) allowing for the corrected WXR images to be the basis for all meteorological short term forecasting. This will ease the detection of significant meteorological indicators, like effects from wind shear as precursors to heavy thunderstorms. The improved forecasts will in turn have significant effects on safety in aviation.
Acknowledgments
This research was partly funded by BMVIT under programme TAKE OFF, project nrs. , and .
References
- [1] T. Bovith, R. Gill, S. Overgaard, L. K. Hansen, and A. A. Nielsen. Detecting weather radar clutter using satellite-based nowcasting products. In Proc. of ERAD, 2006.
- [2] R. S. Gill. Sea clutter removal using radar elevation dependent second order texture parameters, jun 2008.
- [3] R.M. Haralick, K. Shanmugam, and I. Dinstein. Textural features for image classification. IEEE Transactions on Systems, Man, and Cybernetics, 3(6):610–621, November 1973.
- [4] Z. Horvath, T. Micskei, D. Varga, and C. Lukovszki. Efficiency of dynamic frequency selection and other possibilities of meteorology radar jamming avoidance. Hungarian Meteorology Service, 2008.
- [5] R Kaltenböck. Nowcasting of thunderstorms using mesoscale modified low level wind in austria. In WMO s Word Weather Research Programme Symposium on Nowcasting and Very Short Range Forecasting, Toulouse, France., 2005. Meteo-France.
- [6] V. Lakshmanan and J. Zhang. Censoring biological echoes in weather radar images. In 6th International Conference on Fuzzy Systems and Knowledge Discovery. IEEE Computer Press, 2009.
- [7] Thomas Leung and Jitendra Malik. Representing and recognizing the visual appearance of materials using three-dimensional textons. International Journal of Computer Vision, 43(1):29–44, 2001.
- [8] D.B. Michelson and D. Sunhede. Spurious weather radar echo identification and removal using multisource temperature information. Meteorol. Appl., 11(1), 2004.
- [9] Markus Peura. Anomaly detection and removal in radar images (andre) final project report, 2002.
- [10] Fatih Porikli, Oncel Tuzel, and Peter Meer. Covariance tracking using model update based on lie algebra. In Proc. IEEE Conf. on Computer Vision and Pattern Recognition, 2005.
- [11] Sylwia Steginska. Texturanalyse und Mustererkennung in Wetterradarbildern. Master’s thesis, Graz University of Technology, 2012.
- [12] Jing Yi Tou, Yong Haur Tay, and Phooi Yee Lau. Gabor filters as feature images for covariance matrix on texture classification problem. In ICONIP (2), pages 745–751, 2009.
- [13] Manik Varma and Jesus College. Statistical Approaches To Texture Classification. PhD thesis, Robotics Research Group,Department of Engineering Science, University of Oxford, 2004.
- [14] H-R. Verworn, S. Krämer, and S. Köhler. The relevance of attenuation corrected x- and c-band data for real-time applications. In Weather Radar and Hydrology Symposium, Grenoble, France, 2008.
- [15] Mao Ziyang, HUANG Xiaoyu, and CHENG Lizhi and. Weather radar image filtering with fuzzy features using non linear technique. In Congress on Image and Signal Processing, 2008.