Molecular gas heating mechanisms, and star formation feedback in merger/starbursts: NGC 6240 and Arp 193 as case studies
Abstract
We used the SPIRE/FTS instrument aboard the Herschel Space Observatory (HSO) to obtain the Spectral Line Energy Distributions (SLEDs) of CO from J=4–3 to J=13–12 of Arp 193 and NGC 6240, two classical merger/starbursts selected from our molecular line survey of local Luminous Infrared Galaxies (LIRGs: 1011 L⊙). The high-J CO SLEDs are then combined with ground-based low-J CO, 13CO, HCN, HCO+, CS line data and used to probe the thermal and dynamical states of their large molecular gas reservoirs. We find the two CO SLEDs strongly diverging from J=4–3 onwards, with NGC 6240 having a much higher CO line excitation than Arp 193, despite their similar low-J CO SLEDs and , (J=1–0) ratios (proxies of star formation efficiency and dense gas mass fraction). In Arp 193, one of the three most extreme starbursts in the local Universe, the molecular SLEDs indicate a small amount (5%-15%) of dense gas (n cm-3) unlike NGC 6240 where most of the molecular gas (60%-70%) is dense (n(–) cm-3). Strong star-formation feedback can drive this disparity in their dense gas mass fractions, and also induce extreme thermal and dynamical states for the molecular gas. In NGC 6240, and to a lesser degree in Arp 193, we find large molecular gas masses whose thermal states cannot be maintained by FUV photons from Photon Dominated Regions (PDRs). We argue that this may happen often in metal-rich merger/starbursts, strongly altering the initial conditions of star formation. ALMA can now directly probe these conditions across cosmic epoch, and even probe their deeply dust-enshrouded outcome, the stellar IMF averaged over galactic evolution.
1 Introduction
The discovery of bright CO J=1–0 line emission in the Orion nebula (Wilson, Jefferts, & Penzias 1970) opened up the rich field of molecular astrophysics with molecular lines as the primary probes of the physical conditions of Giant Molecular Clouds (GMCs), the most massive structures in galaxies and the sites of star formation. The much weaker rotational transitions from high-dipole moment molecules of CS and CN, which probe much denser gas, were detected soon afterwards (Wilson et al. 1971). As receiver sensitivities improved multi-J transitions of such high-dipole molecules (mostly HCN and HCO+) were used along with those of CO to probe the full range of physical conditions of the molecular gas in nearby star-forming (SF) galaxies (e.g. Solomon et al 1992; Gao & Solomon 2004; Gracia-Carpio et al. 2007; Krips et al. 2008; Greve et al. 2009). These observational studies, and theoretical investigations of the supersonic turbulent GMCs either as individual entities (Li et al. 2003; Larson 2005; Jappsen et al. 2005) or embedded within galaxies (Krumholz & McKee 2005), showed the dense molecular gas (n104 cm-3) as the phase where stars form. Its physical conditions are thus the crucial input for all star formation theories and the resulting stellar Initial Mass Function (IMF) (Larson 2005; Elmegreen et al. 2008).
However, the weakness of high-dipole moment molecular lines (e.g. HCN J=1–0 is 5-100 times fainter than CO J=1–0) that trace high density gas prevented large extragalactic surveys of such lines, while strong atmospheric absorption limits observations of the more luminous CO SLEDs mostly up to J=3–2 (e.g. Yao et al. 2003; Leech et al. 2010), i.e. the first CO transition that starts tracing solely the dense and warm SF gas ((3-2)104 cm-3, 33 K). Such low-J CO line spectroscopy has no diagnostic value regarding the conditions of the dense gas, and little overlap with the CO SLEDs of distant SF galaxies where CO J=3–2, 4–3 and higher-J transitions are mostly detected, redshifted into more transparent mm/submm atmospheric windows (e.g. Solomon & Vanden Bout 2005; Weiss et al. 2007).
The importance of high-J CO lines in probing the dense gas physical conditions was recently underscored by a small extension of CO SLEDs to include J=4–3 and 6–5 for a few local Luminous Infrared Galaxies (LIRGs: L⊙). These revealed large dense and warm gas reservoirs that are irreducible to ensembles of Photon-Dominated Regions (PDRs) in some merger/starbursts (Papadopoulos et al. 2012a). Such conditions were also found in Mrk 231 and Arp 220 using CO SLEDs from J=1–0 up to J=13–12 obtained with SPIRE/FTS and ground-based observations (van der Werf et al. 2010; Rangwala et al. 2011). Finally high-J CO and heavy rotor molecular lines are necessary for better estimates of the = factor in merger/starbursts where, unlike isolated spirals, the dense phase can contain much of their total molecular gas mass (Papadopoulos et al. 2012b).
The thermal, dynamical and chemical state of the dense gas in SF galaxies, its mass contribution to (H2), the effects of SF and AGN feedback, and complete CO SLEDs from J=1–0 up to high-J transitions as local benchmarks for high-z CO observations were the key drivers for our Herschel Comprehensive (U)LIRG Emission Survey (HerCULES), an open time Key program (PI: Paul van der Werf) on the ESA Herschel Space Observatory (HSO)111Herschel is an ESA space observatory with science instruments provided by European-led Principal Investigator consortia and with important participation from NASA (Pilbratt et al. 2010), augmented by a large ground-based low-J CO and 13CO line survey (Papadopoulos et al. 2012a). Here we report on HSO SPIRE/FTS and ground-based observations of Arp 193 and NGC 6240, two prominent merger/starbursts from HerCULES whose similar low-J CO SLEDs, = (a proxy of SF efficiency SFE=SFR/) and =/ (a proxy of =M(n104 cm-3)/Mtot(H2)) ratios, make them good testbeds for exploring diferences in their dense gas properties. This work is structured as follows: 1) we present the SPIRE/FTS and ground-based molecular line data and their reduction (Section 2), 2) we construct the full CO SLEDs from J=1–0 to J=13–12 and use them along with our 13CO, HCN, HCO+, and CS line data to find the average conditions and mass of the molecular gas components using radiative transfer models (Section 3), 3) determine their thermal states and energy requirements (Section 4), and 4) discuss general implications for the ISM in merger/starbursts, and present our conclusions (Section 5). We adopt a flat -dominated cosmology with =71 km s-1 Mpc-1 and =0.27.
2 Observations, data reduction, line flux extraction
NGC 6240 and Arp 193 were observed with the SPIRE/FTS aboard HSO as part of the now completed HerCULES Key project. Arp 193 was observed on November 11, 2010 and NGC 6240 on February 26-27, 2011, using the staring mode with the SPIRE/FTS aboard the HSO with a high spectral resolution mode of =0.04 cm-1 over both observing bands. These were: a long wavelength band covering (14.9–33.0) cm-1 (equivalent to =(671–303) m or =(467–989) GHz), and a short wavelength band covering (32.0-51.5) cm-1 (equivalent to =(313–194) m or =(959–1544) GHz). For NGC 6240 the integration time was =97 repetitions with on-source integration of =12920 secs, while for Arp 193 these were =108 and =14386 secs. Dark reference measurements of (NGC 6240)=113 scans (15110 secs) and (Arp 193)=124 scans (16622 secs) were used to subtract the thermal emission of the sky and the telescope/FTS. The data were processed and calibrated using HIPE version 6.0. Interferometric CO J=1–0 (Arp 193) and J=2–1 (NGC 6240) images (Downes & Solomon 1998; Tacconi et al. 1999) yield source sizes 1.5 (Arp 193) and 3-4 (NGC 6240), much smaller than even the smallest SPIRE/FTS beam of 17 at 1500 GHz. Thus we set the aperture-source geometric coupling factor 1 across the entire FTS spectrum222See Equation 1 in Papadopoulos et al. 2010 for the expression of . Finally the two spectrometer bands in the overlap region (32-33) cm-1 are well matched and were averaged.
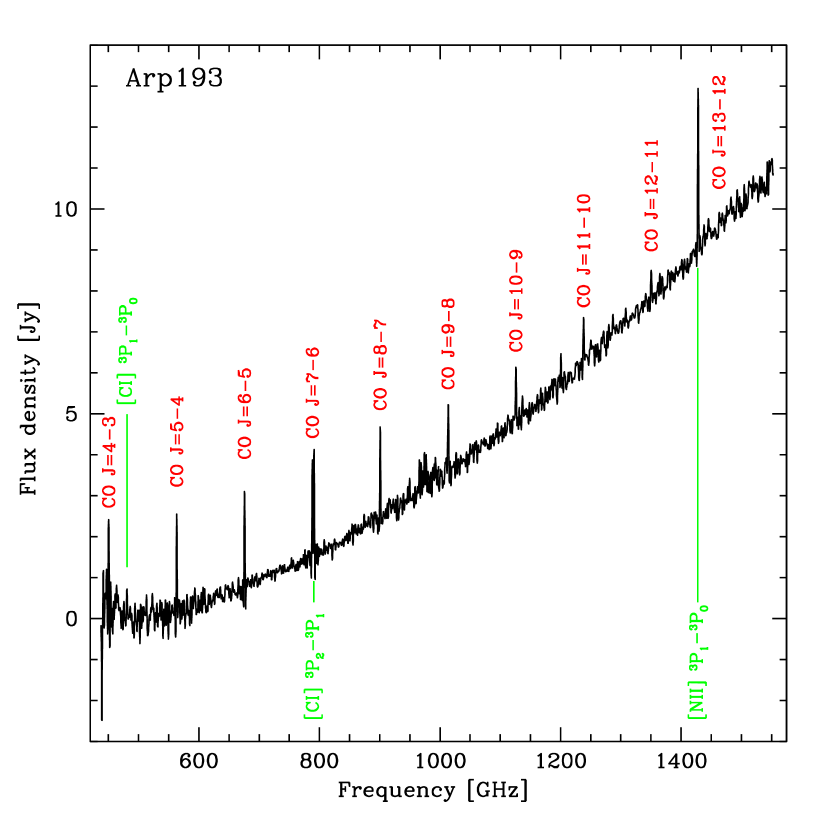
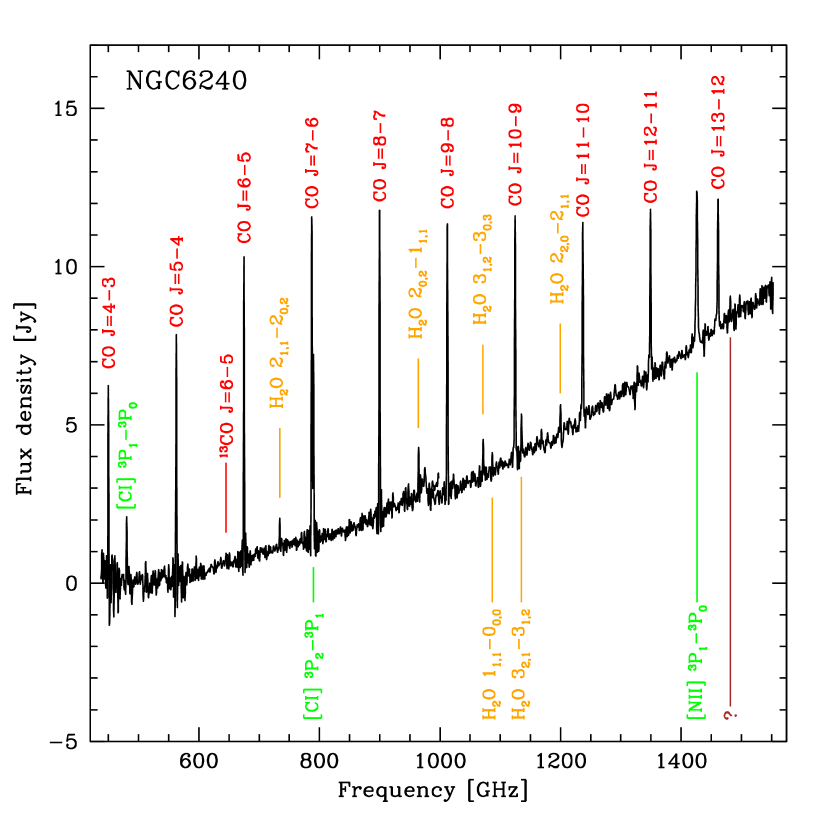
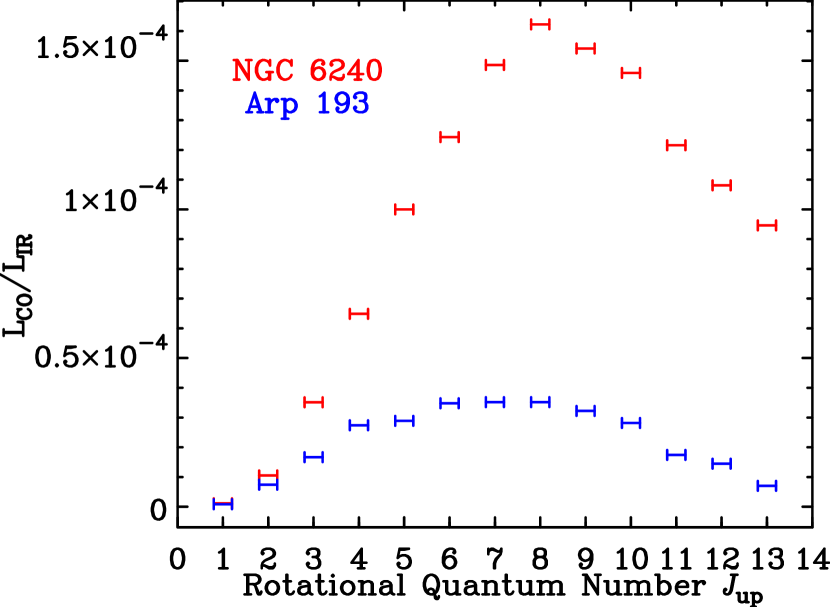
In Figure 1 we show the full SPIRE/FTS spectra of NGC 6240 and Arp 193. Besides the CO lines, several (6) water lines are also clearly detected in NGC 6240, while in both LIRGs the fine structure lines of atomic carbon [CI] (33 and 33), and of N II are detected. We use the CO lines to extract the redshifts of =0.02450.00013 (NGC 6240) and =0.02310.00015 (Arp 193), in good agreement with the CO-deduced values from single dish measurements (Papadopoulos et al. 2012a). For these redshifts the luminosity distances are: (NGC 6240)=105.5 Mpc (with 1′′ corresponding to 487 pc) and (Arp 193)=99.3 Mpc (with 1′′ corresponding to 460 pc).
The velocity-integrated line fluxes were extracted by: a) fitting a sinc-gaussian function to the line profile (sinc for the FTS response, and gaussian for the line profile), b) integrating over the entire line (=the FTS response convolved to an underlying line profile) without any assumptions about its profile. Both give similar values, but for Arp 193 where a non-gaussian line profile is present (see Figs 2, 3 in Papadopoulos et al. 2012a) we adopt those obtained via the second method. The CO J=1–0, 2–1, 3–2 (ground observations), and J=4–3 up to J=13–12 (SPIRE/FTS) velocity-integrated line fluxes and luminosities are in Table 1.
2.1 HCN, HCO+ and CS line observations
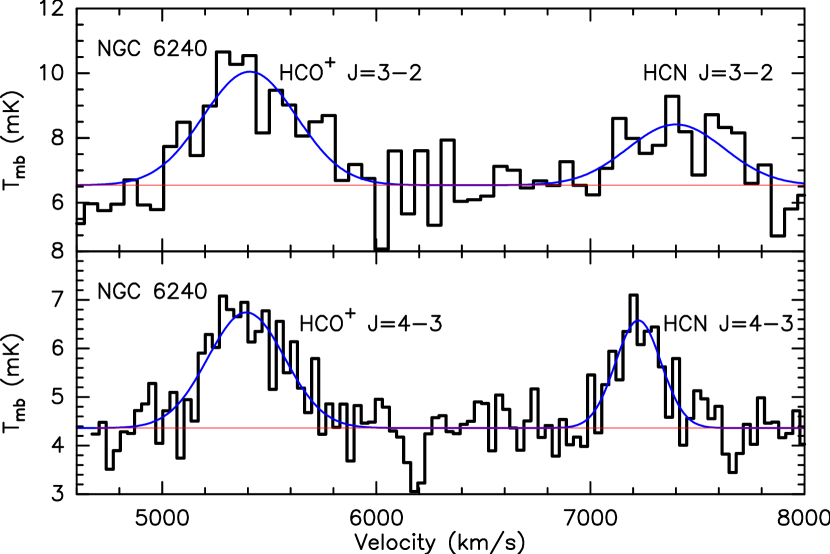
We performed HCN, HCO+ J=4–3 and CS J=7–6 line observations of NGC 6240 using the 12-m Atacama Pathfinder EXperiment (APEX) telescope333This publication is based on data acquired with the Atacama Pathfinder Experiment (APEX). APEX is a collaboration between the Max-Planck-Institut für Radioastronomie, the European Southern Observatory, and the Onsala Space Observatory. on the Chajnantor Plateau in Chile. Most observations were done in good (0.6 mm) to median (1 mm) weather conditions in April and August 2011. The FLASH receiver was employed with the LSB tuned to the CS =7–6 frequency (342.883 GHz), and the USB covering the HCN, HCO+ J=4–3 transitions. The Fast Fourier Transform Spectrometer (FTS) backends are employed in all spectral observations, with channel spacings of 0.4 MHz, and a bandwidth of 4 GHz for each sideband, yielding a velocity coverage of 3500 km s-1. Typical system temperatures where =(200-240) K, while the beam size at 345 GHz is HPBW=. Pointing checks using a strong continuum source were made every hour yielding a typical pointing uncertainty of -. We estimated a main-beam efficiency =0.7 from a continuum measurement on Mars, and a point-source conversion factor of =40 Jy/K. We performed all observations in the wobbler switching mode with a chopping frequency of 1.5 Hz and a chop throw of 2′ in azimuth (AZ) yielding flat baselines. Finally the APEX-1 SHeFI receiver was used to observe the HCN and HCO+ J=3–2 lines (see Figure 2) using the same observational setup.
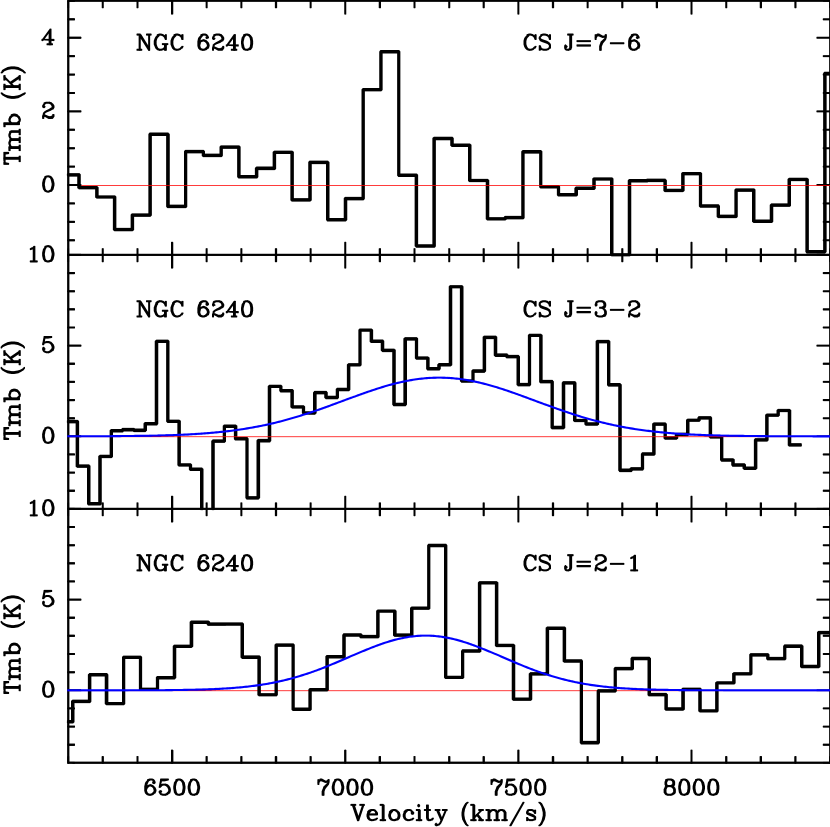
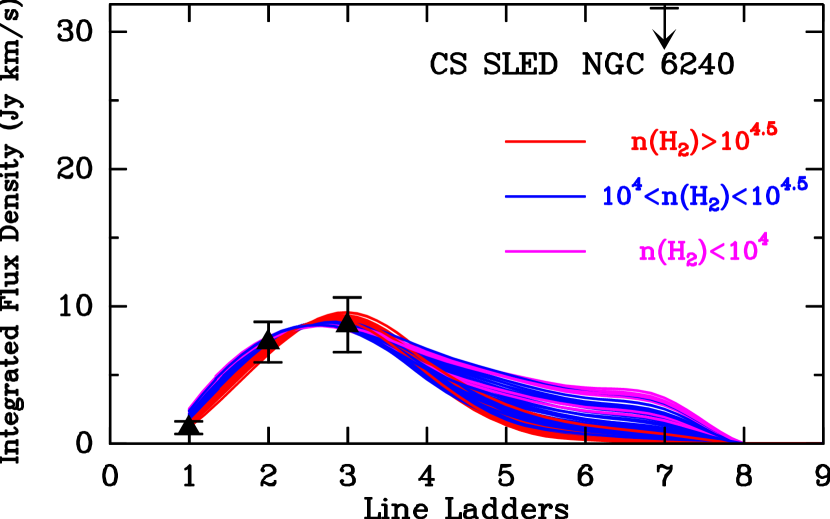
The CS J=2–1, 3–2 spectra were obtained using the IRAM 30 m telescope at Pico Veleta (Spain) in December 2011 under good weather conditions (0.1). The EMIR receivers E90, E150 observed the two lines simultaneously, with the fast fourier transform spectrometer (FTS) as the backend. To obtain flat baselines, a wobbler switching mode with a frequency of 2 Hz and beam throw of 120′′ was used. Pointing checks were made every 30 minutes, yielding pointing errors of 3′′ (rms). The main-beam efficiencies =0.71, 0.63 at 90 GHz and 140 GHz respectively. The beam-sizes (HPBW) are 26′′ (90 GHz) and 17′′ (140 GHz). In Figure 3 we show the CS lines for NGC 6240 (Arp 193 was not detected). The data were reduced using CLASS, with each spectrum inspected by eye and about 5% -10% of them discarded. For each source, the spectra were co-added, weighted by their noise. The velocity-integrated line fluxes along with those from the literature can be found in Table 2.
2.2 Literature data
Our new HCN J=3–2, 4–3 fluxes for NGC 6240 from APEX are significantly lower than those reported by Greve et al. (2009) (whose HCN 4–3 data were used also in Papadopoulos 2007), with our HCN J=3–2 flux in excellent agreement with three other such measurements (Gracia-Carpio et al. 2008, Krips et al. 2008 and Israel 2012). For the HCN J=4–3 line we adopt our new measurement since lack of adequate baseline of the old JCMT spectrum makes the flux obtained highly uncertain. For HCN J=3–2 we adopt the mean of our value and those reported in the literature (we do the same in all cases where multiple consistent observations of the same line exist, see Table 2). Finally the CO J=6–5 velocity-integrated fluxes obtained with SPIRE/FTS (Table 1) are significantly larger than those obtained from the ground using the James Clerk Maxwell Telescope (JCMT) (Papadopoulos et al. 2012a, their Table 5). We attribute this to pointing offsets of the JCMT, now known to have affected some of the CO J=6–5 measurements despite its overall good pointing (pointing rms2′′) and the corrections made to account for flux reduction due to pointing errors444Equation 4 in Papadopoulos et al. 2012a.
3 The state of the molecular gas reservoirs
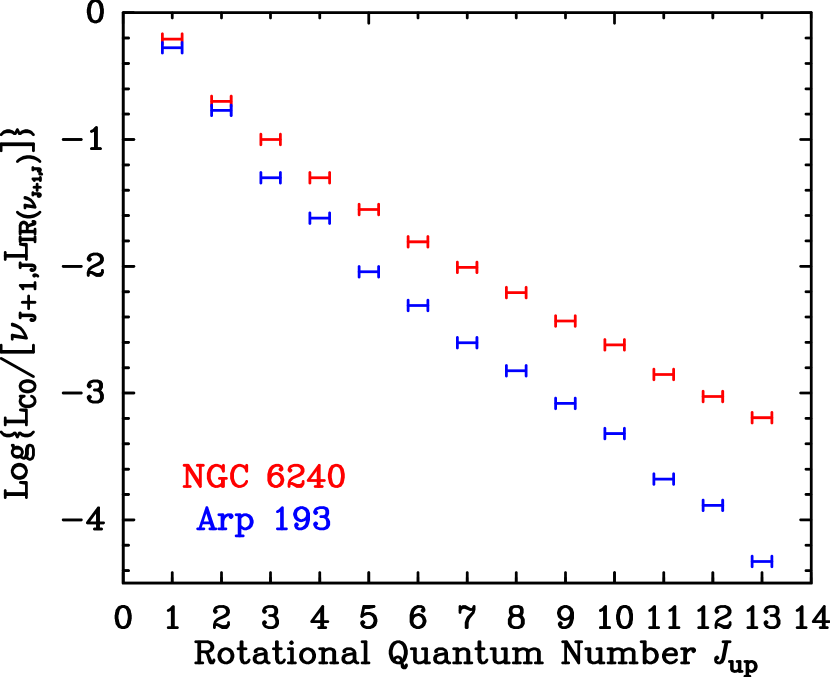
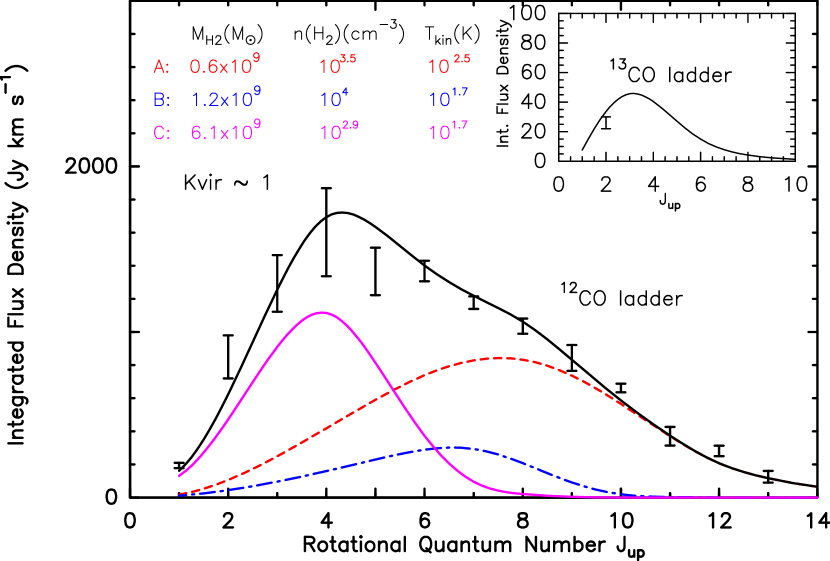
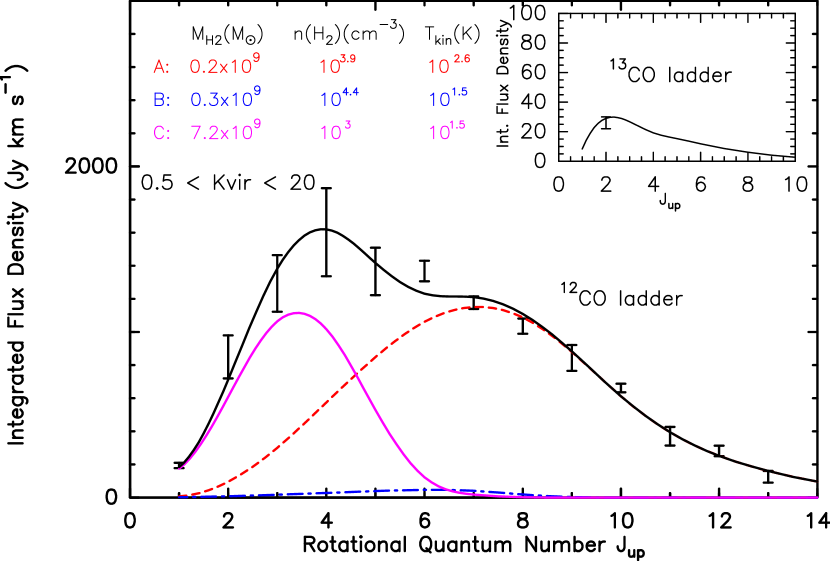
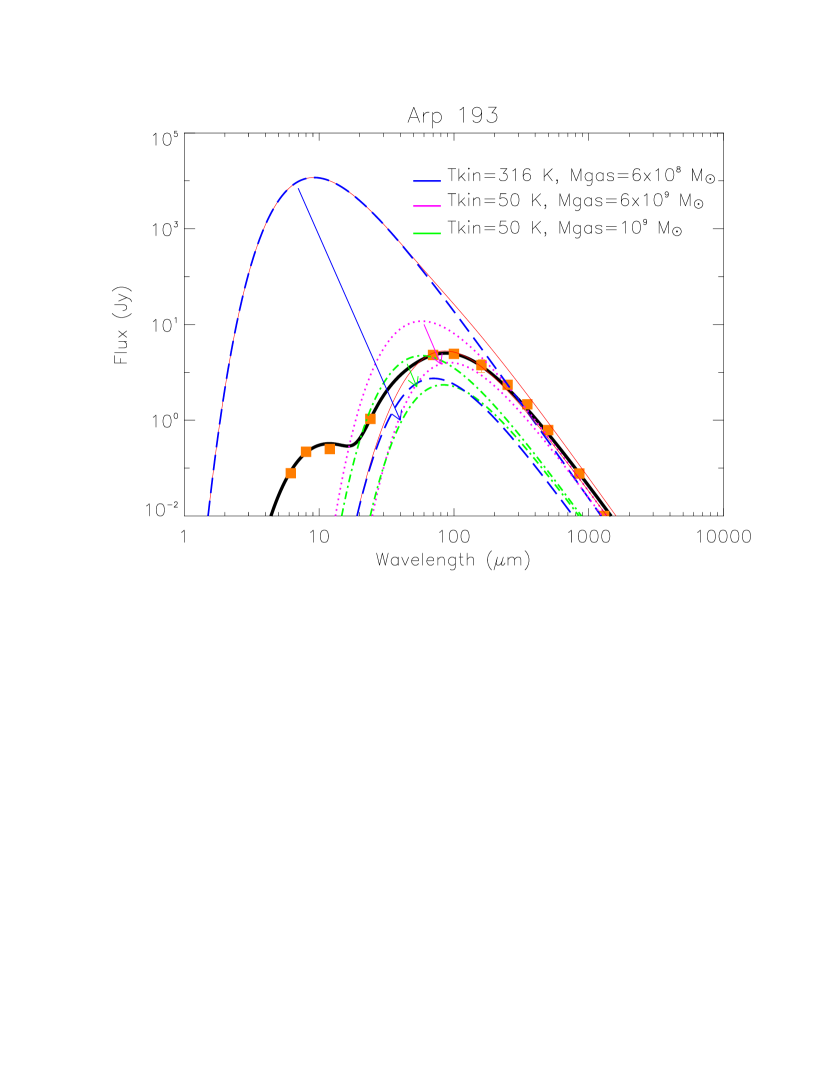
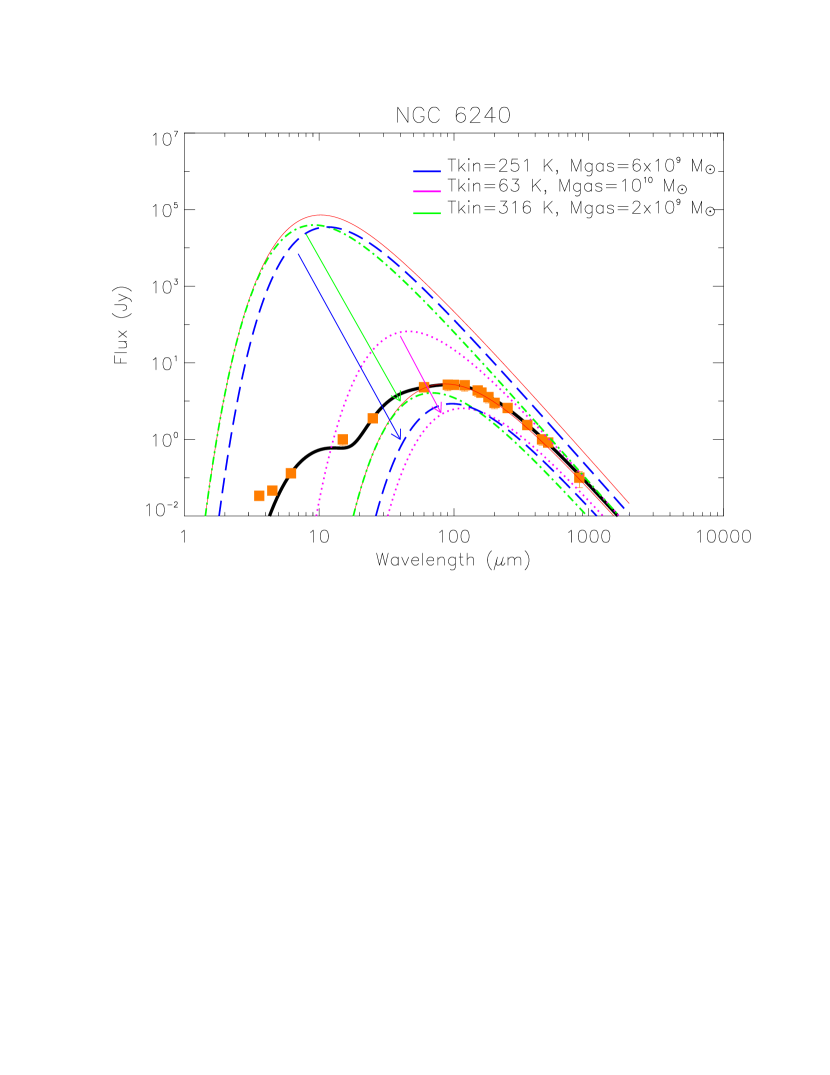
In Figure 4 we show the CO SLEDs of the two LIRGs, normalized by their far-IR luminosities: =, and by the continuum at the corresponding line rest frequency: =. These SLEDs remain similar up to J=3–2 (within factors of 1.2-2) but then diverge significantly for higher-J lines by factors of 5-10. The lower excitation of the high-J CO lines of Arp 193 comes as a surprise for a galaxy that is one of the three ULIRGs that harbor the most extreme starburst regions in the local Universe (the other two being Arp 220 and Mrk 273; see Downes & Solomon 1998, hereafter DS98).
The high-J CO SLED divergence and the different HCN ratios (Table 2) imply different dense gas conditions and/or dense gas mass fractions for these two mergers. This occurs despite similar = (J=1–0), and = ratios (0.073 (NGC 6240) and 0.055 (Arp 193), while for both galaxies), quantities often used as proxies of =M(n104 cm-3)/Mtot(H2) and SF efficiency SFE=SFR/M(H2) in galaxies.
3.1 The dense gas phase: the HCN, HCO+ and CS lines
We start the radiative transfer modeling with the HCN, HCO+ lines since (HCN/HCO+)-rich gas is where the minimal high-J CO SLEDs are set. Any additional high-J CO line luminosity would come from warmer (FUV)-heated outer layers of GMCs where high-dipole molecules like HCN are mostly dissociated because of their lower dissociation potential than of CO (Boger & Sternberg 2005), confining them deeper inside GMCs, beyond the reach of strong FUV radiation fields (attenuated by the outer GMC layers). In such regions supersonic turbulence has mostly dissipated, and only cosmic rays (CRs) heat the gas and control its ionization and chemical state (e.g. Bergin & Tafalla 2007). The strong molecular line cooling of dense gas (), and the gas-dust thermal coupling with cold dust (warmed only by the feeble IR fields able to penetrate that deep into GMCs) ′′thermostate′′ such regions around a narrow range of states that serve also as the initial conditions of star formation in galaxies (Larson 2005; Elmegreen et al. 2008).
We used the public Large Velocity Gradient (LVG) code RADEX555Extensive runs with RADEX revealed convergence problems (i.e. the solutions obtained changing significantly even after many iterations). Our solutions have been checked for this problem. (van der Tak et al. 2007) to map the parameter space compatible with the heavy rotor lines available for NGC 6240 and Arp 193 (Table 2), with = parametrizing the dynamical state of the gas. We first examine only self-gravitating states (0.52) which are typical for dense gas regions inside Galactic GMCs. Strictly speaking only states with =1 can be called self-gravitating but we consider a slightly wider range (by a factor of 2) to account for the uncertainties of cloud density profiles, geometry, and [CO/H2] abundance that are used in extracting from the RADEX input parameter N(CO)/=n(H2) (see Appendix A for details of our model).
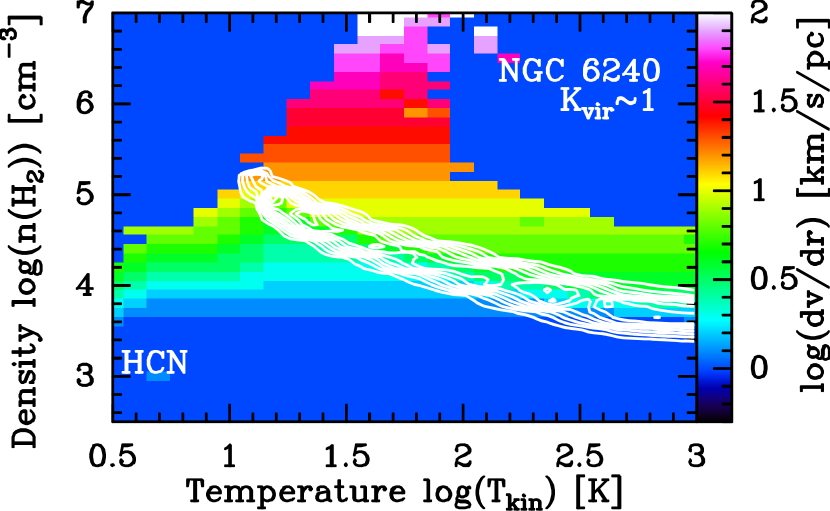
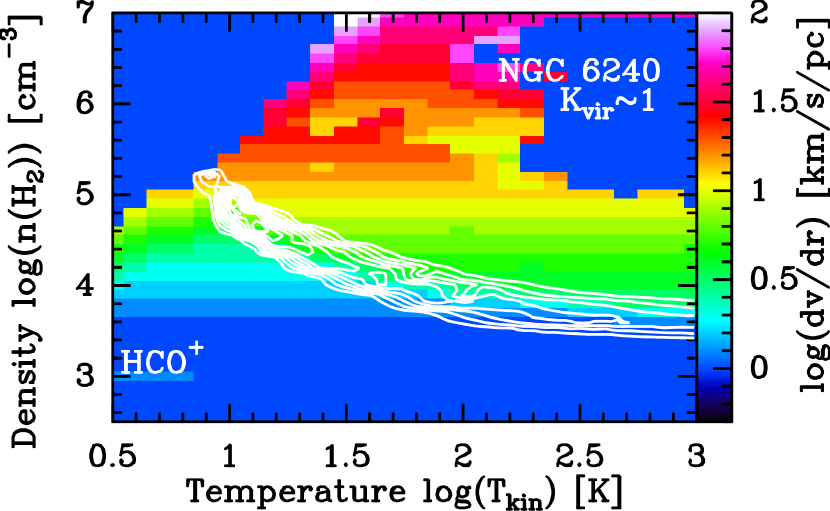
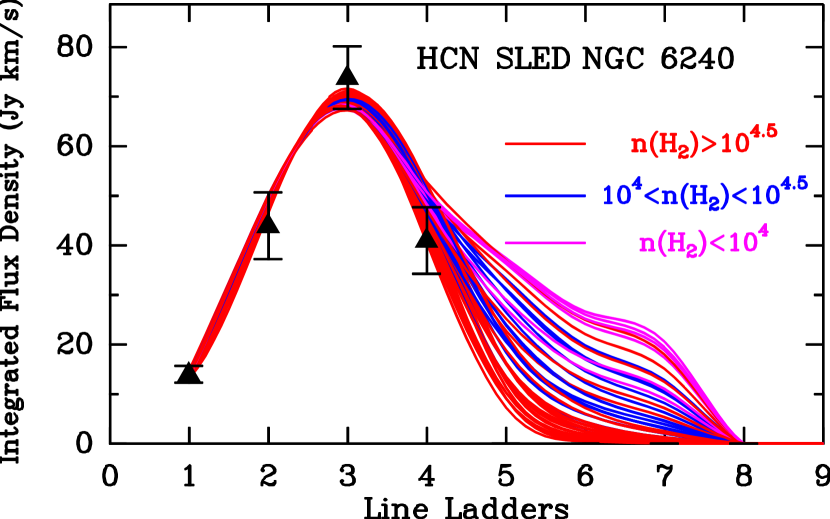
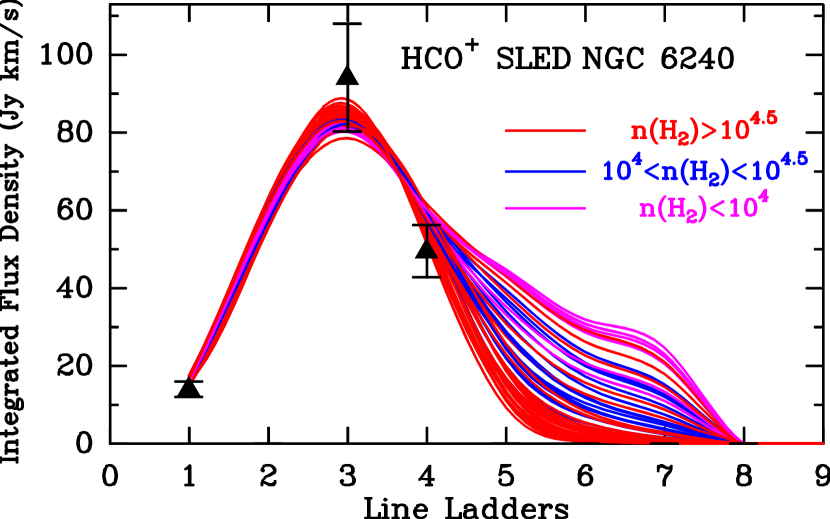
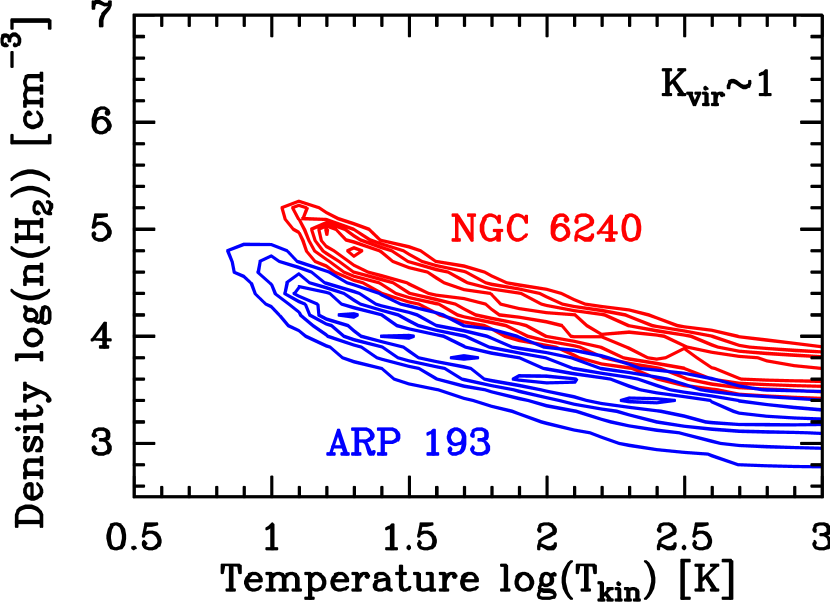
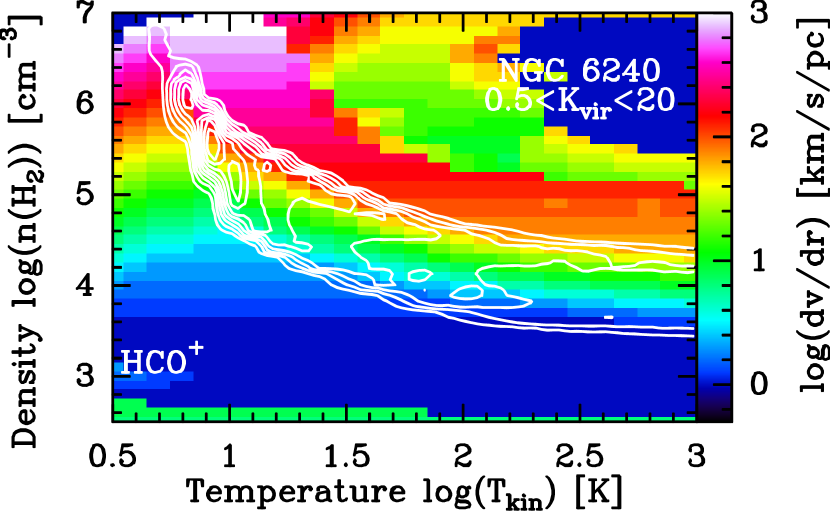
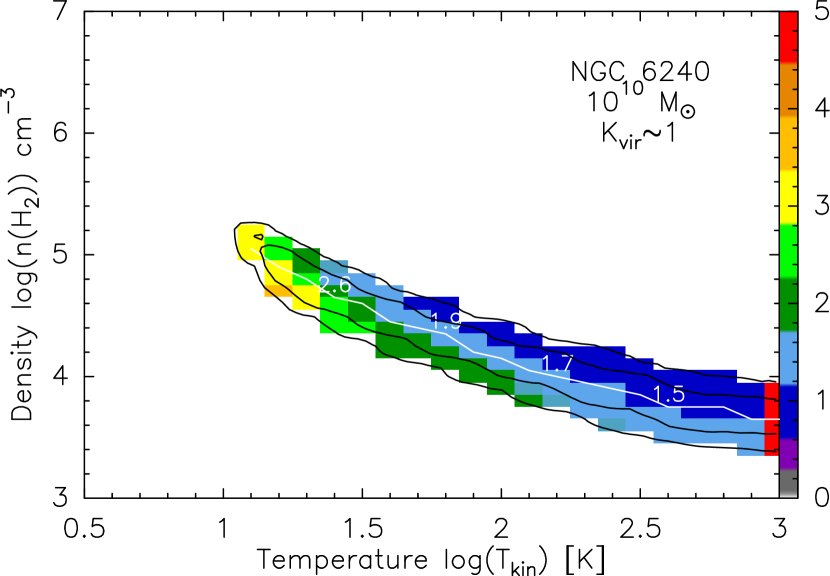
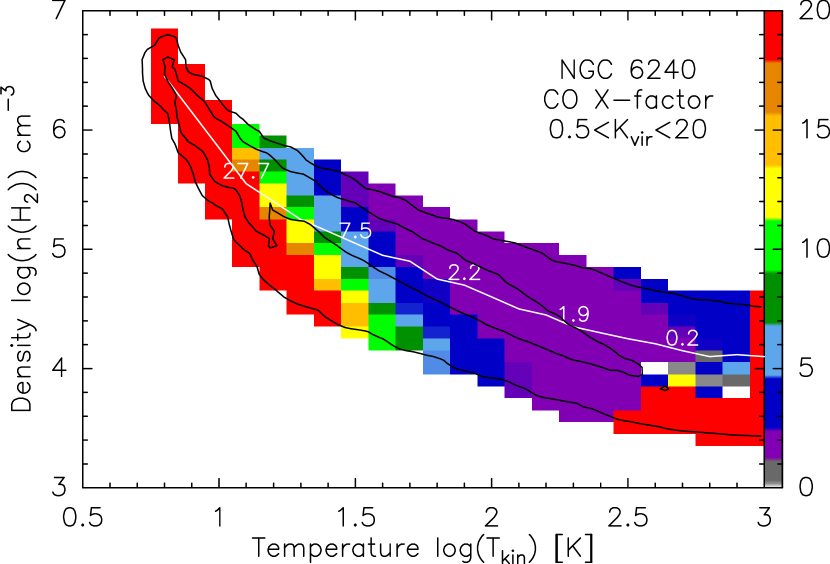
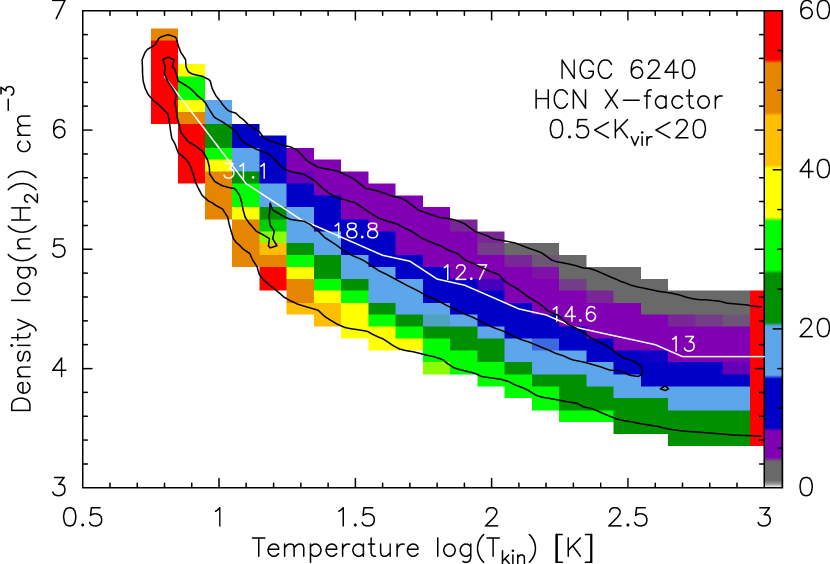
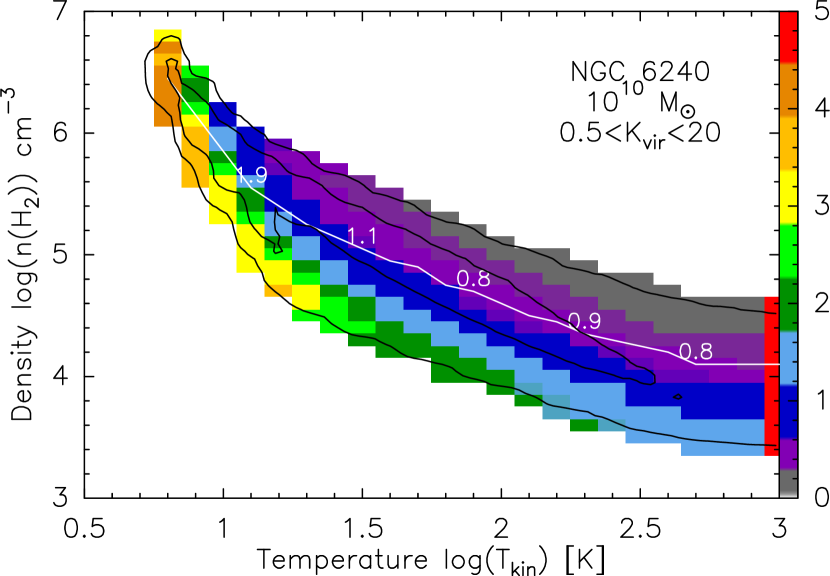
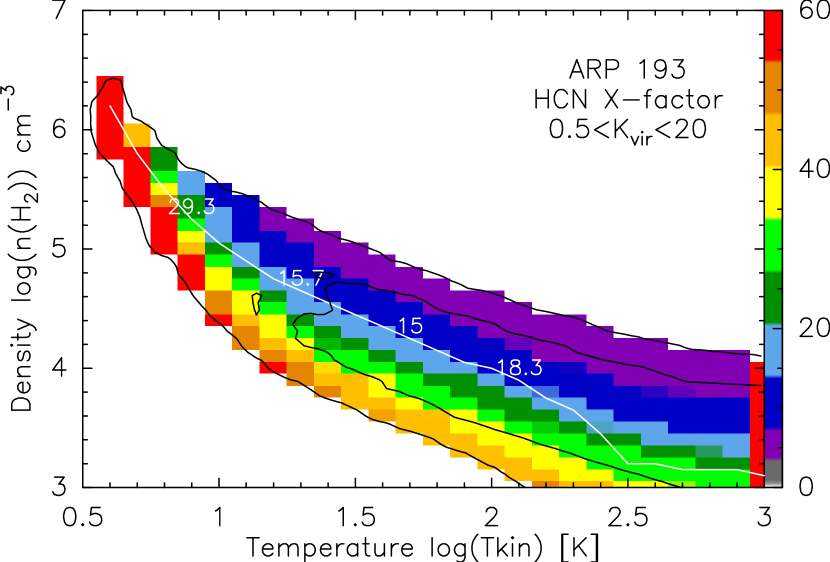
In Figure 5 we show the probability density functions (pdfs) for as constrained by the HCN line ratios, the heavy rotor molecule with the larger number of available transitions for both galaxies. For NGC 6240 where several HCO+ lines are also available, a nearly identical solution space is recovered (see Figure 6). The HCN SLEDs corresponding to the solution space in Figure 5 are shown in Figure 7, along with those for the HCO+ and CS lines available for NGC 6240. For this LIRG the HCN-derived solution range is a good fit for all the high-dipole moment molecular lines, with densities of cm-3n cm-3 for most LVG solutions within the 15 K150 K interval. Nevertheless, as expected for radiative transfer modeling of optically thick lines like those of HCN and HCO+, considerable degeneracies remain. However, with the current HCN and HCO+ line data containing the SLED turnover, additional measurements of even one higher-J line (e.g. HCN and/or HCO+ J=5–4) can much reduce them (see Figure 7). For NGC 6240 our results differ somewhat from those Greve et al. 2009 as our new lower HCN J=4–3 line luminosity (and a much lower CS J=7–6 upper limit) now exclude any significant gas masses with 105 cm-3.
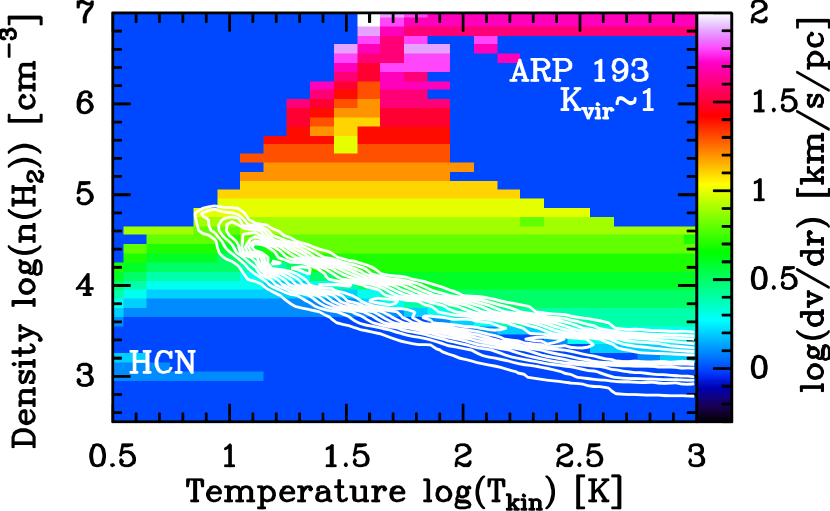
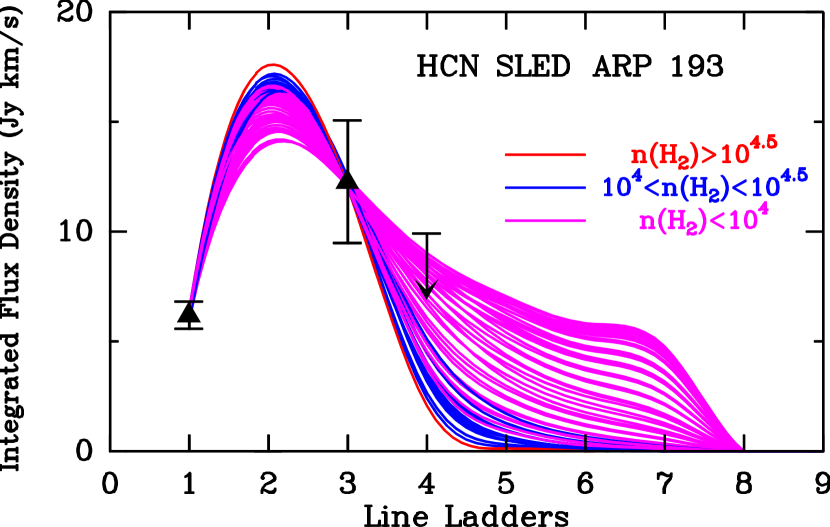
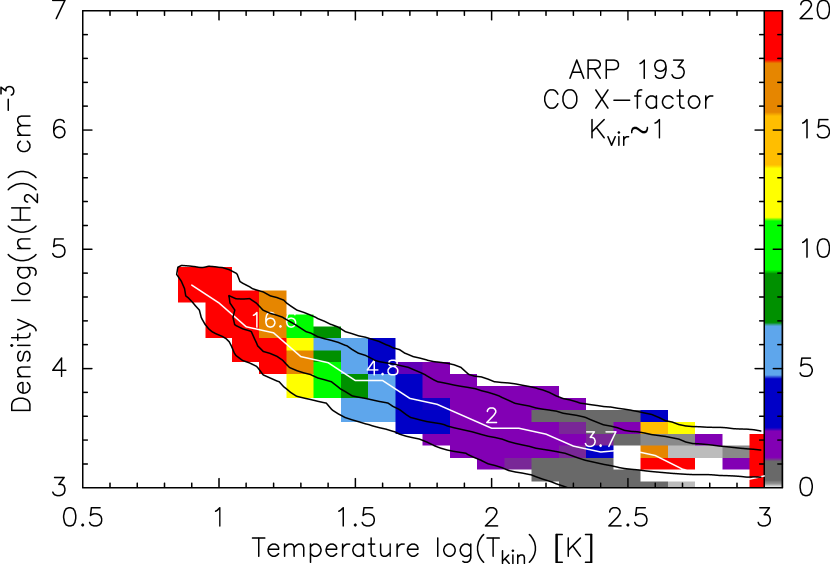
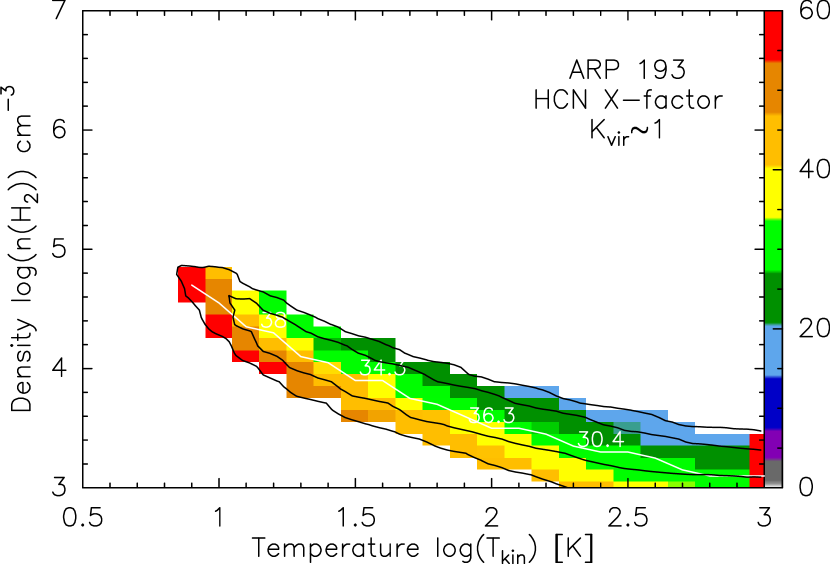
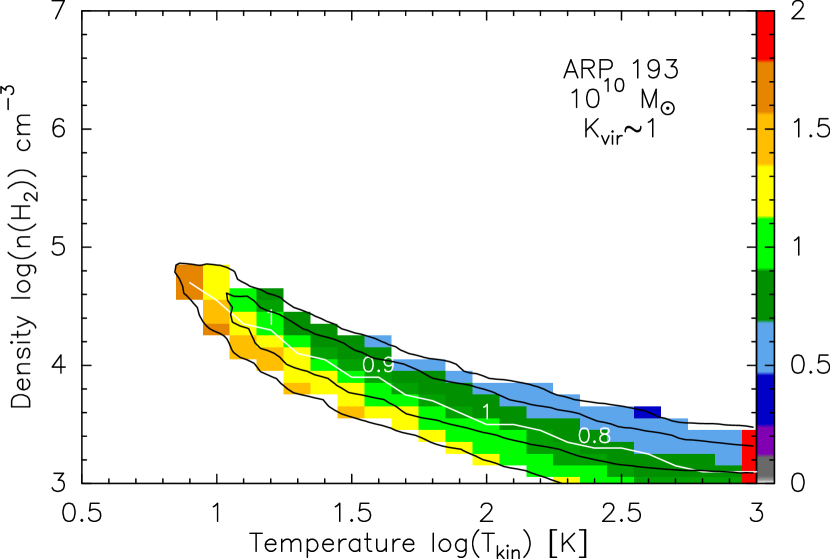
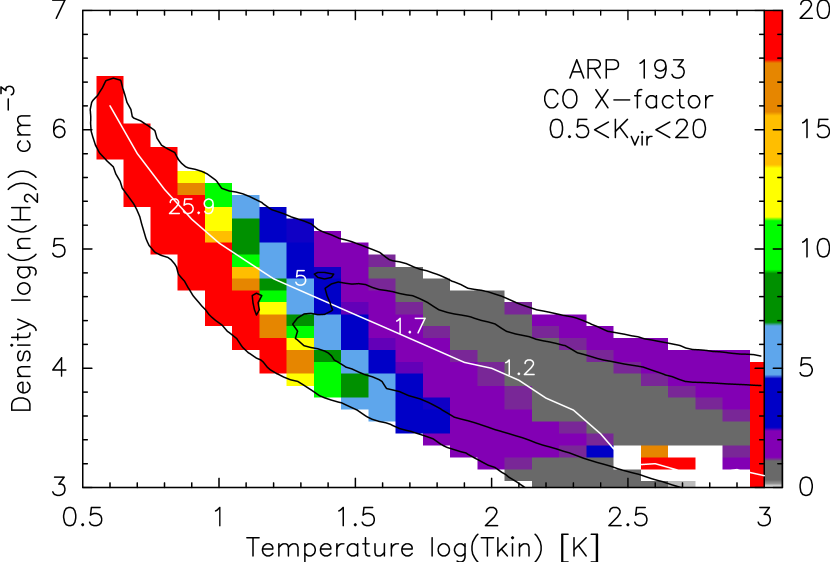
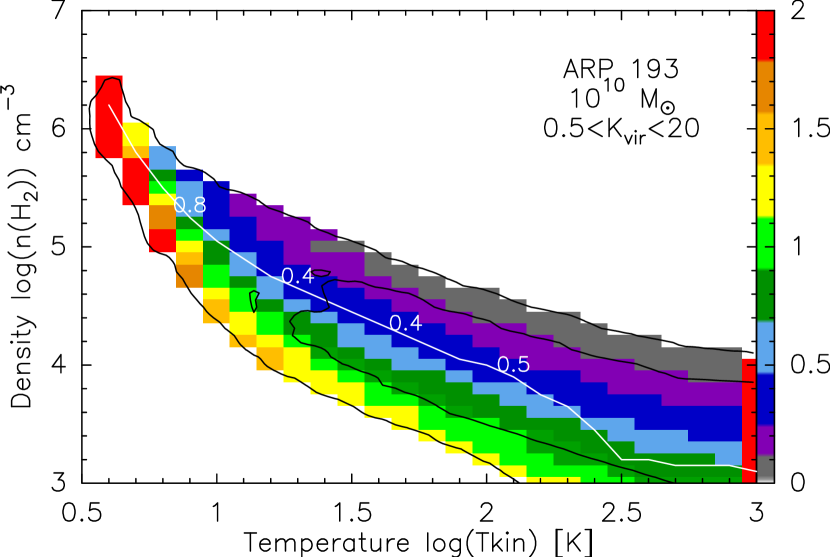
The low HCN line ratios of Arp 193 on the other hand correspond to significantly lower average gas densities than in NGC 6240 over the entire solution range (see Figure 8). Indeed, quite unlike NGC 6240 where solutions within the 15 K150 K interval have n104 cm-3, in Arp 193 most have n104 cm-3, i.e. are compatible even with an absent dense gas component in one of the three most prominent starbursts in the local Universe. This can then naturally yield its low-excitation high-J CO SLED. We note however that the degeneracy of HCN-derived LVG solutions still leave such HCNCO SLED extrapolations rather uncertain. For example the HCN-extrapolated CO SLEDs for NGC 6240 and Arp 193 while indeed divergent beyond J=4–3 as proposed by Papadopoulos et al. 2010, do not correspond well to those actually observed with SPIRE/FTS. Only the minimal CO SLEDs of a SF galaxy can be confidently deduced in this manner (Geach & Papadopoulos 2012).
3.1.1 Unbound states for the dense gas
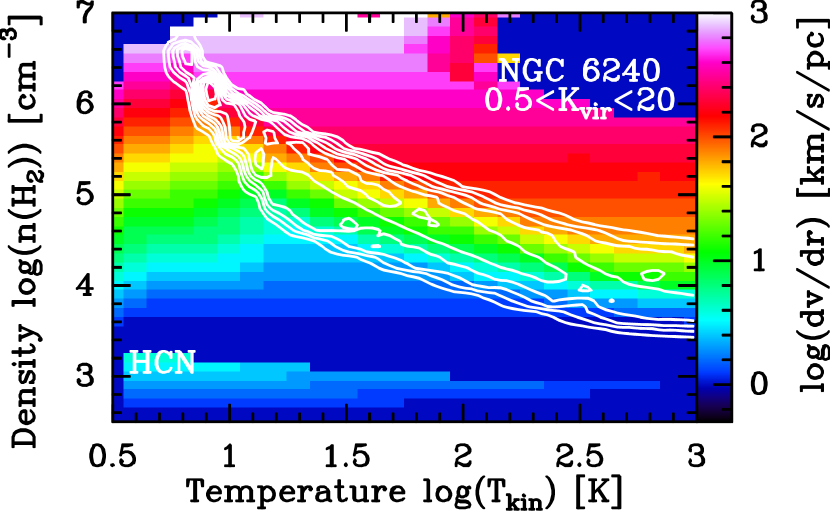
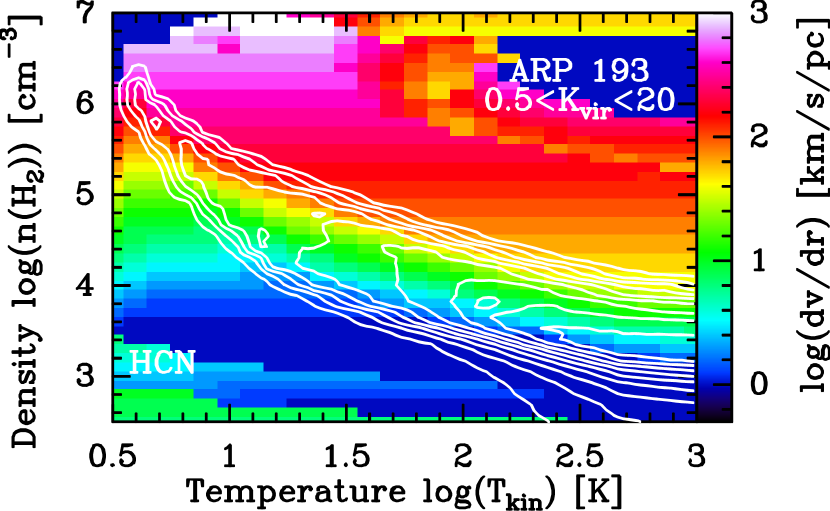
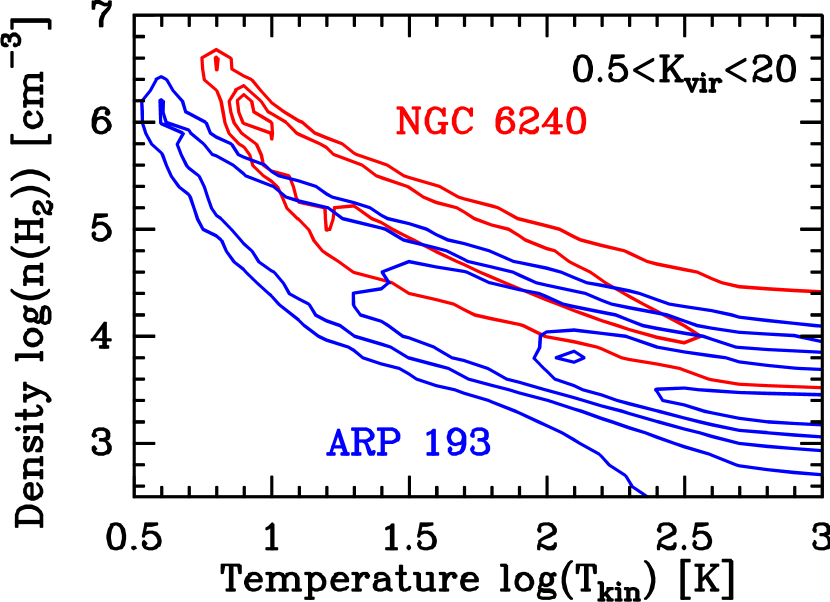
Requiring 1 for the LVG solutions of the (HCN/HCO+)-line emitting gas is appropriate for the dense regions of ordinary GMCs in spirals. In mergers however GMCs, if they remain as individual entities at all, may be far from ordinary (Solomon et al. 1997; DS98). Moreover strong gas outflows (i.e. bona fide unbound gas) have been found in extreme starbursts even for dense gas (Aalto et al. 2012) while dense and unbound gas states have been inferred for the Galactic Center and the nucleus of NGC 253 (Bradford et al. 2005, 2003). We thus search also for unbound dense gas states compatible with the heavy rotor molecular SLEDs. The new pdfs for 0.520 (Fig. 9) now encompass higher densities for any given (compare with Fig. 5), and extend towards colder/denser states (whether these are possible is discussed in 3.2). Figure 10 shows similar effects for the (HCO+)-constrained pdfs of NGC 6240, while the HCN-determined pdfs of the two LIRGs now significantly overlap (Fig. 11), especially for 30 K, (compare with Fig. 8).
3.2 Beyond PDRs: the extraordinary states of the dense gas in mergers
Before extending our molecular SLED modeling to include the two CO SLEDs it is worth revisiting the paradigm of how these emerge in the ISM and whether it remains adequate in the extreme ISM conditions in merger/starbursts. In the standard picture low-J CO line emission (J=1–0, 2–1 and some fraction of J=3–2) arises from the entire molecular gas mass distribution, while high-J CO lines mainly from the FUV-illuminated warm outer layers of molecular clouds near O, B stars, the so-called Photon-Dominated Regions (PDRs). Deeper inside GMCs, where the (HCN/HCO+)-rich gas resides, lack of strong FUV radiation (which allows such molecules to survive), and strong gas-dust thermal coupling with an increasingly colder dust reservoir, leaves the gas too cold (10 K in Galactic HCN-bright cores) to radiate in high-J CO lines. Turbulent heating does not fundamentaly alter this picture since is significant also in the outer, lower density GMC layers (where turbulence is thought to be injected), while dissipating in the inner denser regions. In ordinary GMCs these contain (1-2)% of their mass, and set the SF initial conditions and the IMF mass scale.
This simple picture of GMCs[PDRs]+[cold FUV-shielded dense cores], with most of their mass in PDRs, was recently challenged in some merger/starbursts whose ISM states indicate large amounts of dense ( cm-3) and warm (80 K) molecular gas (Papadopoulos et al. 2012a). Even in the absence of such observations, a general argument for extraordinary thermal and/or dynamic states for the dense gas in merger/starbursts can be made starting from their typically large HCN/CO J=1–0 ratios of 0.1–0.2 (0.01-0.03 in galactic disks). For n5 cm-3, (10–15) K, and 1 (i.e. Galactic-type dense gas conditions) the HCN-bright component would have: (20–60) (666=M⊙(K km s-1 pc2)-1) (using expressions in Papadopoulos et al. 2012b for a thermalized line). Then for =(0.5–2) (777=K km s-1 pc2) typical in merger/starbursts: (1-12)1010 M⊙, large enough to dominate and even surpass the typical of their CO-bright regions (see DS98). The dense gas in such HCN-bright galaxies must then be much warmer and/or in unbound states (i.e. 1) whose smaller factors would then yield well within their . Actually even approaching a large fraction of of a merger/starburst would be worrying as one would expect 50% of to be newly-formed stars (for a typical dense-gas SF efficiency of 50%), with some room left for lower density gas and an older stellar population. Thus the high HCN/CO (J=1–0) line ratios of such galaxies can mean either unreasonably large amounts of cold, dense, self-gravitating gas, or very different thermal and/or dynamical dense gas states. These, as we will argue later, cannot be maintained by FUV photons from PDRs.
The aforementioned reasoning assumes that in both merger/starbursts and isolated spirals HCN lines are collisionally excited. Only then their very different HCN/CO J=1–0 ratios reflect different dense gas mass fractions (modulo any differences of their average dense gas conditions). Large scale IR pumping of HCN levels occuring only in merger/starbursts could upset this by yielding high global HCN/CO J=1–0 ratios and well-excited HCN rotational transitions in these galaxies, without large amounts of their molecular gas at n cm-3. While this may occur in some extreme systems (Aalto et al. 2012), it could not be generaly important without ′′breaking′′ the tight linear HCN- correlation found across the entire (U)LIRG population and down to individual Galactic GMCs (Gao & Solomon 2004; Wu et al. 2005). Large scale IR pumping of HCN lines only in merger/starbursts would instead produce a broken, non-linear, - correlation towards ULIRGs, with a larger dispersion, and certainly not extending smoothly down to individual GMCs where such pumping is negligible. The same picture of large dense gas tracer luminosity in ULIRGs with respect to isolated gas-rich spirals, and a tight linear -Lline correlation is found also for CS lines (Zhang et al. 2013), and benchmarked for SF regions in the Galaxy (Wu et al. 2010). The simplest explanation is that both HCN and CS are collisionally excitated in most LIRGs.
3.3 The CO SLEDs of NGC 6240 and Arp 193: an inside-out decomposition
Our previous discussion makes clear that a significant dense, warm and/or unbound gas component can be a general feature of HCN-luminous merger/starbursts such as Arp 193 and NGC 6240. Such a component is then bound to significantly contribute to their high-J CO line luminosities. The practical importance of this is that the LVG solution space defined by the HCN line ratios (Figures 5, 9) (also the solution space for the CS and HCO+ lines in NGC 6240) can now be used to model also the high-J CO SLEDs of these galaxies. Incorporating the (HCN/HCO+/CS)-rich dense gas into the CO SLED modeling is an imperative for merger/starbursts as it can contain a large fraction of their (Solomon et al. 1992; Gao & Solomon 2004; Greve et al. 2009), and its omission may be responsible for the often contradictory conclusions regarding their molecular gas conditions found in the literature (e.g. Greve et al. 2009 versus Rangwala et al. 2011 regarding Arp 220). For HCN-constrained CO SLED decompositions, /1 can be used as an additional constraint on the parameter space possible (see Appendix B for details on the aforementioned fitting procedure and the constraints).
From Figures 12, 13 is obvious that for 1 and 30 K, the high values yield (2-3) M⊙ (NGC 6240) and M⊙ (Arp 193). For NGC 6240 this surpasses its (0.60 kpc)1010 M⊙ within its CO region (Tacconi et al. 1999). However for Arp 193 where (1.3kpc)=1.61010 M⊙ (DS98) no such constraint can be placed888In our detailed HCN/CO SLED decompositions we actually use =1.3 since in strongly evolving gas-rich galaxies where molecular gas has yet to settle in circular motions (e.g. in mergers) the dynamical mass computed under the assumption of exact virialization may underestimate the true one. The value of =1.3 rather than 1 is deduced from numerical simulations of isolated gas-rich disks (see Daddi et al. 2010, Equation 2). Its value in mergers would most likely be higher still. For super-virial dense gas states, the resulting lower and (see Figures 14, 15) can relax such dynamical mass constraints considerably by allowing unbound states even for the high density gas in these galaxies.
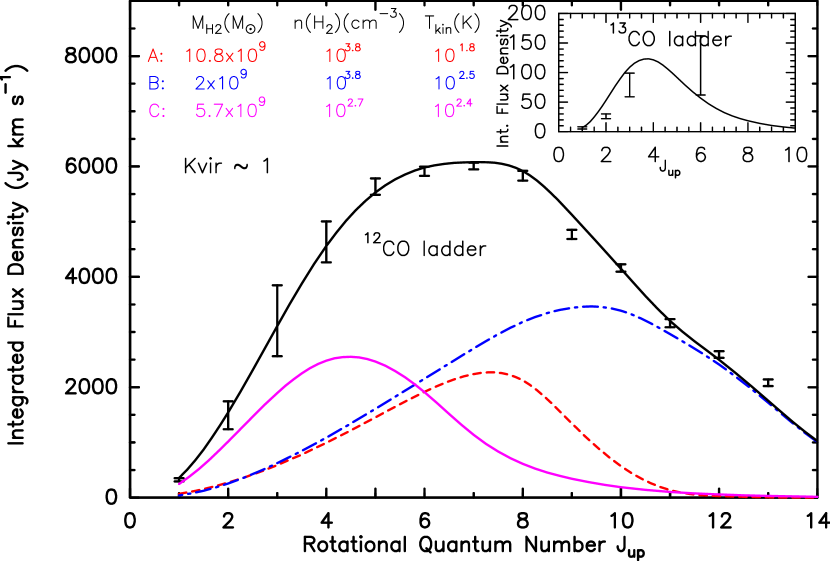
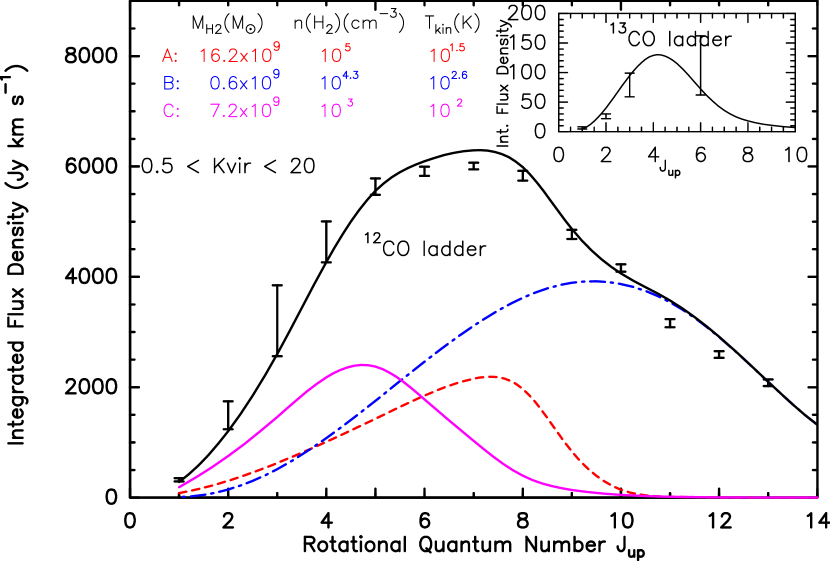
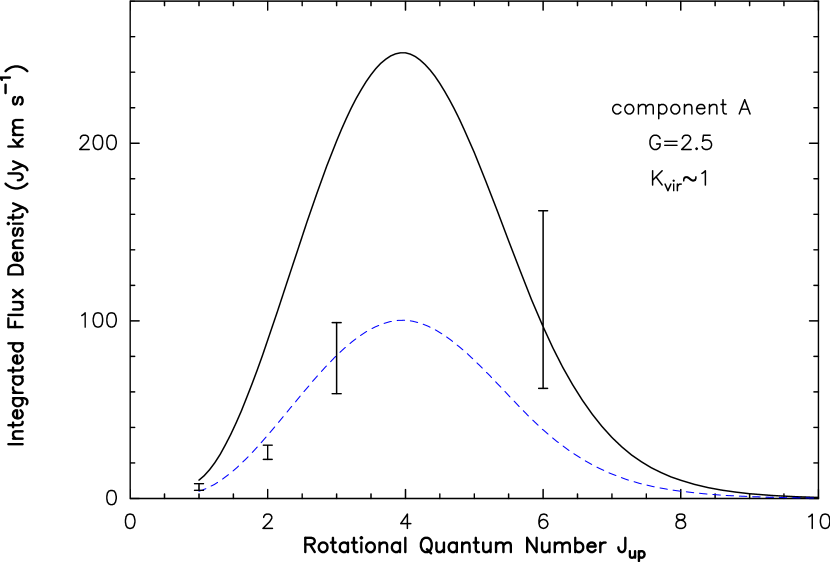
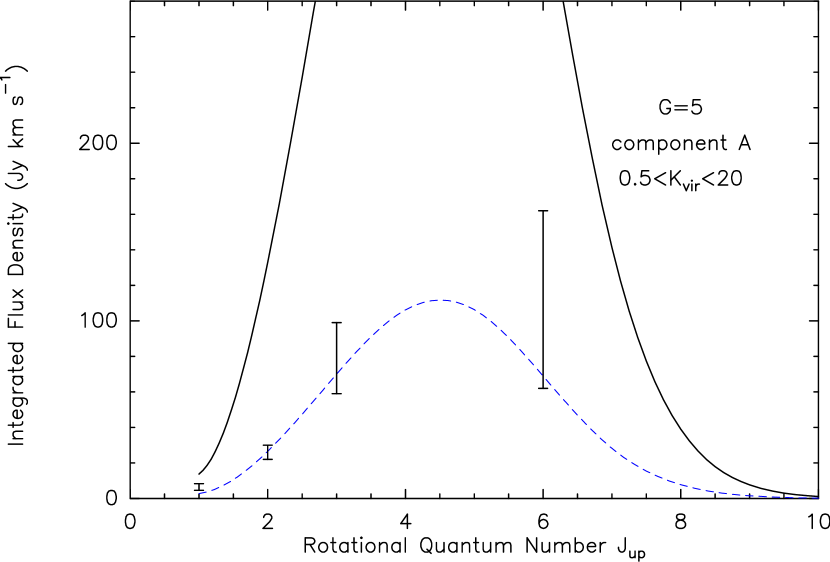
The high-J CO SLED for both galaxies can be decomposed to two components (A) and (B) drawn from the HCN-defined LVG parameter space (for NGC 6240 also (HCO+/CS)-compatible) and its 30 K sub-region (Figures 16, 17). A lower density component (C) from outside this parameter space can then reproduce the remaining low-J CO SLED up to J=4–3, 5–4 (beyond which its contribution subsides). It typically has: (400–) cm-3, (50–400) K, with the warmest ((60–400) K) and lowest densities ((400-500) cm-3) in NGC 6240. In Arp 193 most gas is in this component (75%–95%), while for NGC 6240: 10%–30%. This disparity of the dense gas mass fraction between the two galaxies remains for all their CO/HCN SLED decompositions (see Table 3).
3.3.1 The 13CO lines, the [CO/13CO] abundance ratio, the IMF and ALMA
High r=[CO/13CO] abundance ratios of r150 are necessary for reproducing the weak 13CO lines of both galaxies. For Arp 193 r150 while r300-500 is needed for NGC 6240 (see Figures 16, 17) as its 13CO lines are the weakest found in (U)LIRGs. Degeneracies regarding the range of [CO/13CO] do remain, especially between the virial (1) and super-virial (0.520) SLED decompositions. However, as long as HCN-constrained states are used to obtain the high-J CO SLEDs, such high abundance ratios are necessary. This becomes more evident from Figure 18 where the 13CO SLED of the most mass-dominant component of the decomposition is shown for NGC 6240 and r=80 (the highest abundance ratio in the Galaxy). The corresponding 13CO lines are 2.5-5 times brighter than observed.
The CO line emission samples most of the metal-rich molecular gas in galaxies and thus the aforementioned large [CO/13CO] ratios concern the bulk of the molecular gas in the two metal-rich merger/starbursts. A lower limit of [C/13C]150 was placed also for the inner 500 pc of the starburst M 82, using several groups of C/13C isotopologues (Martin et al. 2010). Selective photodissociation of 13CO with respect to CO, infall of unprocessed gas with large from large galactocentric radii of the progenitor spirals, or nucleosynthesis by a larger number of massive stars of a top-heavy stellar IMF can all yield the high CO/13CO line ratios in (U)LIRGs (Casoli et al. 1992; Henkel & Mauersberger 1993). However rather strong arguments against selective dissociation of 13CO as a principal cause can be found in Casoli et al. (1992). Moreover this process can only take place near PDRs, which may contain only small fractions of the molecular gas in merger/starbursts (see 3.2). Infall of large amounts of unprocessed gas to the central regions of merger/starbursts is difficult given the molecular gas outflows in starburst galaxies like NGC 6240 (Cicone et al. 2012).
Selective nucleosynthesis by massive stars (i.e. a top-heavy IMF) can yield high [CO/13CO] abundance ratios. However to do so for the large amounts of molecular gas sampled by the CO lines such a top-heavy IMF would have to be sustained long enough as to recycle most of the molecular gas into being dominantly enriched by the different [CO/13CO] abundance ratios. Alternatively a top-heavy IMF may have been there from the beginning of a galaxy’s evolution. Either scenario calls for a top-heavy time-averaged stellar IMF (t-IMF) rather than such an IMF prevailing only for the starburst episode occuring at the observed epoch.
A CR-driven mechanism inducing a top-heavy IMF, and triggered by the high SFR densities of merger/starbursts, has been identified (Papadopoulos et al. 2011). Such an IMF would then strongly alter the isotopic ratios of carbon, oxygen, nitrogen, and sulfur (Henkel & Mauersberger 1993). Such atoms are then ′′locked′′ in numerous molecules whose rotational transitions span a vast range of and values, and thus of molecular gas phases. A large ratio injected by a top-heavy IMF prevailing during the main SF episodes in a merger would then ′′contaminate′′ most of these phases, and thus boost all the corresponding isotopologue line ratios probing them (e.g. , ). However whether such a top-heavy IMF indeed prevails during most main SF episodes of a merger and whether it can ′′erase′′ the likely more ordinary isotopologue abundance ratios in the ISM of the spiral disk progenitors remains an open question.
How much is boosted by selective massive star nucleosynthesis remains unclear (Henkel & Mauersberger 1993) as is the effect of the delayed release of 13CO by longer-lived lower mass stars with respect to 12CO synthesized by the massive ones (Wilson & Matteucci 1993; Henkel et al. 2010). These issues must be tackled before isotopologue ratios can be used to constrain the observed-epoch IMF and the t-IMF in the heavily dust enshrouded environments of merger/starbursts. In that regard the several other isotopologues available (e.g. based on N, O, and S) can provide powerful constraints on the galaxy chemical evolution models used to interpret their relative abundances in terms of the IMF and t-IMF (Wilson & Matteucci 1993; Matteucci 2013). Using mm/submm isotopologue lines to measure isotope ratios and then use those to set constraints on the IMF and t-IMF of heavily dust-enshrouded star-forming galaxies in the Universe is however the next best thing other than using their faint dust-absorbed starlight. The huge leap in sensitivity and correlator flexibility of ALMA will allow determination of any given isotopic abundance ratio using several molecular lines of its isotopologues. Double-rare isotopologues (e.g. ) can much reduce the optical depth uncertainties of extracting relative abundances from such line ratios (Langer & Penzias 1990). On the practical side, the similar frequencies of same-J isotopologue lines greatly facilitate the imaging of their intensity ratios with ALMA since such observations will always have nearly identical u-v coverage.
3.4 The molecular gas in Arp 193: terminal SF feedback at work?
It is remarkable that in Arp 193 there seems to be little mass at n cm-3 given that: a) such high density gas is the actual SF ′′fuel′′ in galaxies, and b) this merger hosts one of the three most extreme starbursts in the local Universe. Star formation and its feedback (via radiative pressure and/or SNR shocks) may have rapidly dispersed/consumed much of its initial (pre-burst) dense gas reservoir during a nearly ′′coherent′′ SF event whose O,B stars are still present (thus maintaining the large that makes Arp 193 a LIRG). In this non-steady state situation the dense gas reservoir within the compact SF region of Arp 193 is yet to be resupplied by the ongoing merger, with SF expected to shut down as a result until this happens. In this regard this extreme starburst may have been ′′caught′′ during a rare phase of a terminal feedback event.
Strong SF feedback may have acted as both a SF-synchronization ′′trigger′′ and a fast disperser of the dense gas reservoir inside the central SF region of Arp 193. The solutions with 1 (see Table 3, Figure 17) may then be the more relevant ones since unbound average gas motions are possible if strong mechanical or radiative SF feedback affects the bulk of the dense gas reservoir to the point of unbinding it. Such extreme events may be the triggers of the strong molecular gas outflows found in merger/starbursts (Cicone et al. 2013). Interestingly Arp 193 is one of the few merger/starbursts where a ring with an inner radius of 220 pc rather than a disk best fits its CO J=2–1 line velocity fields (DS98), a geometric configuration expected if strong SF feedback cleared out the inner parts of its gas disk.
The short lives of O,B stars will make such starbursts very rare since such ′′coherent′′ SF events must have: 1 where is the time interval during which most O,B stars of the burst were formed, and (1-5)106 yrs the time for them to become SNs (and thus cease to be FUV emitters). The expected rareness of (U)LIRGs in such an evolutionary stage can be set in prespective using the ISM evolution model for LIRGs by Baan et al. 2010, and specifically their Figure 1c that shows the short timescale during which IR luminosities remain high (so the object is selected as a (U)LIRG)), while the dense gas mass is being rapidly depleted. A random ergodic sampling of the ISM evolution curve in their Figure 1c by a large set of evolving mergers will then yield very few galaxies during such a stage. We note however that unlike Baan et al. our ′′delay′′ between and the dense gas mass fraction evolution is (i.e. not due to any delayed impact of low mass stars on ).
Synchronizing star formation and the dispersal/consumption of the dense gas reservoir that fuels it over timescales of T∗(1-5) Myr requires a triggering mechanism with at least as short of a crossing time over the SF region of Arp 193. Using (740–1300) pc for the gas disk revealed by CO J=2–1 imaging (DS98), means that the speed for a SF-synchronization ′′signal′′ initiated from a star-formation burst in the disk’s center would have to be: /(240–420) km s-1 (for =3 Myrs). Such high velocities correspond to with =1–2 ( the rotational velocity of the CO-bright gas disk (or ring) in Arp 193, see DS98). Such a starburst would then consume/disperse its molecular gas disk within 1/(2)(0.08–0.16)! This is possible for strongly evolving merger/starburst systems, especially if SF feeback initiates strong non-gravitational gas motions (1) that act to both trigger fast star formation and unbind/disperse the gas disk. Moreover, recent observations indicate that the SF region of Arp 193 is much more compact than indicated by low-J CO imaging (which trace both SF and non-SF molecular gas). Indeed recent e-MERLIN and VLBI imaging revealed recent starburst activity indicated by SNe and SNR taking place within a region with a radius of r120 pc (Romero-Cañizales et al. 2012). For such compact region a ′′coherent′′ starburst event becomes much easier to induce.
The extremity of a starburst event that can disperse/consume the massive dense gas reservoir neccesary to fuel star formation in LIRGs like Arp 193 can be viewed also in terms of the molecular outflow this would imply. A typical pre-burst dense gas reservoir of (1/10–1/5)(1-2) (for ), with 1/2 consumed by the SF burst itself (i.e. a Galactic SFEdense of 50), leaves (0.5–1) of dense gas mass to be dispersed within 3 Myr. The implied molecular gas outflow then is: (165-330) yr-1 (which can be higher still if the SFEdense under extreme SF feedback conditions is less than its Galactic value). Such strong molecular outflows from merger/starbursts have been recently observed (Cicone et al. 2012). High resolution imaging of HCN, H13CN, and high-J CO, 13CO line emission in Arp 193 can be used to verify both the compactness of its SF region and the presence of a strong molecular gas outflow affecting high-density gas.
Finally, Arp 193 and NGC 6240 with their similar J=1–0 ratios but different actual dense gas mass fractions caution against using such ratios as simple proxies of () for galaxy-galaxy comparisons. The same goes for often used as a proxy of the dense gas SF efficiency. Nevertheless the expected scarcity of objects like Arp 193, would retain the statistical usefulness of such proxies for large galaxy samples.
4 The heating sources of the molecular gas in NGC 6240 and Arp 193
The CO and HCN SLED decomposition for these two LIRGs can now be used to examine in detail whether FUV photons from PDRs can maintain the thermal state of the components that make up their molecular gas reservoirs. The energy balance equation for molecular gas heated only by photoelectric heating and cooled by line emission and gas-dust coupling is:
| (1) |
where denotes photoelectric heating, and , , and the CO, H2, C II, and O I line cooling (see Appendix C). For the dense FUV-shielded regions of Galactic GMCs where 10 K neither the lines (510 K) nor the CII and OI fine structure lines (92 K (CII) and 230 K (OI)), are appreciably excited. Nevertheless we must now include them since such regions can now be much warmer (section 3.3). The CII line in particular can remain a powerful coolant even within FUV-shielded regions where CII abundances are maintained only by CRs. The continuum term denotes cooling due to the thermal interaction of the gas with colder concomitant dust (see Appendix C). For CO line cooling we use the observed CO SLEDs, and the luminosity fractions per component obtained from our decomposition. These are lower limits if significant line power remains beyond the CO J=13–12 transition.
Here we must note that while TkinTdust for concomitant dust and gas is found by a number of detailed PDR models (e.g. Hollenbach & Tielens 1999; Papadopoulos et al. 2011), all of them use approximations regarding the radiative transfer of the re-radiated FIR/IR continuum from the (FUV/optically)-heated dust. The validity of these approximations may break down for the ISM in (U)LIRGs where significant dust optical depths prevail out to FIR/IR wavelengths. In such environments a strong IR radiation background within molecular clouds, understimated by current PDR models, may warm the dust above , and make a net gas-heating term in Equation 1. This is possible even in ordinary PDRs where Tdust can dip below Tkin by (5-15)K in FUV-shielded regions (see Hollenbach & Tielens 1999 their Figure 16).
Nevertheless, if values significantly larger than were to prevail for large dust and molecular gas masses in the high FIR/IR optical depth ISM of (U)LIRGs, it would yield strongly surpressed high-J CO lines and even in absorption against the corresponding dust continuum. This is not observed in the FTS high-J CO line spectra of (U)LIRGs, and NGC 6240 in particular has the highest line/continuum ratios observed among them, even up to J=13–12. For a column density of – cm-2 (typical in ULIRGs), dust optical depths of would prevail at the rest frequencies of such high-J CO lines suggesting that cannot be much greater than . However, establishing this in detail would require more detailed modeling of the combined dust plus line radiative transfer throughout the galaxy in tandem with more robust estimates of the total column density and dust optical depth, which are beyond the scope of this paper. Finally the high CR energy densities and strong turbulence in the ISM of (U)LIRGs directly heat the gas but not the dust (unlike photoelectric heating). This will raise above the of the concomitant dust (e.g. Papadopoulos et al. 2011, 2012a). For turbulence such an inequality has been recently shown for the very turbulent molecular clouds in the Galactic Center (often used as local analogs of ULIRG-type ISM conditions) where dust with (15-20) K (Pierce-Price et al. 2001; Rodríguez-Fernández et al. 2004; Gracía-Marín et al. 2011) coexists with dense gas ( cm-3) gas having (60-100) K (Rodríguez-Fernández et al. 2004; Ao et al. 2013 and references therein).
4.1 Average photoelectric gas heating
In order to compute (see C 1) we need the intensity (in Habing units) of the average ISRF in the ISM of the two merger/starbursts. An effective can be obtained from the of each ISM component by using:
| (2) |
which is the average value for graphite and silicate grains for an emissivity law of =2. The formula is insensitive to the grain size, which we set to a=1 m. In terms of it is:
| (3) |
For =(10–15) K, 0.4–4, typical for the dust in the Galaxy. We can now obtain an approximate estimate of for the dust mass content of the three gas components that make up the molecular SLEDs of NGC 6240 and Arp 193 by setting a gas/dust ratio of 100 and =(1/f) (f1) per ISM component. We then find the corresponding total dust SED, and adjust f’s so that it matches the observed one in the far-IR/submm range (see Figure 19). The estimated is then used to find per ISM component and its .
This method yields a per ISM component that is , thus its use in Equation C 1 yields an upper limit for . This is because in the very high-extinction ISM of compact merger/starbursts the average FUV/optical radiation field is strongly attenuated (see also 4.2.1), leaving only IR radiation to heat their concomitant dust. Thus, unlike ordinary ISM environments, in merger/starbursts the observed dust SED and equivalent can have a strong contribution from IR heating, making the corresponding (from Equation 3) mostly a , and a strict upper limit of the strongly attenuated FUV radiation field. Moreover even if a correction could be made and the true average computed, the latter would still be higher than that within the CO-rich part of molecular clouds where the molecular SLEDs emerge. This is simply because FUV-heated warm dust from their HI and CO-poor/H2-rich outer cloud layers also contributes to the total dust emission, biasing the global dust SED (and its effective ) towards these warmer outer GMC regions. This would then make the average (from Equation 3) higher than that actually prevailing inside the (CO/HCN)-rich regions of molecular clouds.
4.2 (FUV photon)-deficient thermal states in Arp 193 and NGC 6240
We can now estimate the Y= factor for each gas component making up the CO SLED, where is the total cooling power expressed in Equation 1. We label states with Y1 as (FUV photon)-deficient, indicating other dominant gas heating mechanisms. For Arp 193 0.04–0.5 only for the low-density component with the highest temperatures ((300–400) K, and containing (3–8)% of its 8 M⊙ (see Table 3). For the other two cooler components 1 (i.e. FUV photons can maintain the thermal state). For these most massive components of Arp 193 the Y factors could be larger still (thus placing them even more comfortably within the domain of FUV-maintained thermal states) if dust optical depth effects rather than only dust-gas temperature differences contribute to the small difference found between the observed dust SED and their SLED-deduced ones.
In NGC 6240 however large fractions of are clearly in (FUV photon)-deficient thermal states. More specifically, as in Arp 193, we find the warmest component (in this case component B) to have 1 (0.04–0.2). However, unlike Arp 193, we obtain 1 also for either (A) or (C) components (specific values depending on the adopted CII abundance and set of solutions). Together with component (B), the fraction of the molecular gas mass in such thermal states then rises to (40–70)%. There are even cases where all three components have 1 (e.g. for = and the SLED decomposition in the 0.520 domain), placing the entire molecular gas mass in NGC 6240 in such thermal states. This is consistent with recent results reported by Meijerink et al (2013) where the entire CO SLED is attributed solely to shock-heated gas. In that work, the large line/continuum ratio of the observed CO SLED of NGC 6240 (see Figures 1, 4) is a direct result of a large / ratio, itself a signature of globally shock-heated molecular gas. The ultimate power source of such galaxy-wide shocks can be readily found in the time-evolving gravitational potential expected within compact mergers, a power source unavailable for the molecular gas in isolated spirals.
Finally, returning to issue of IR-heated dust as a potential molecular gas heating source we note that for states with Y1 typically (0.01–0.20). Thus even reversing the sign of (so that the entire becomes a net heating term) is not enough to elevate Y up to 1 values. Moreover such a reversal would imply improbably high given that in states with Y1, (as constrained solely by the molecular SLEDs) is already high ((65-300) K). In practice the small numerical coefficient of ensures that gas heating by a warmer dust cannot compete with in typical SF environments (e.g. for =100, =0.01 and = cm-3: ), which remains 1 even for =100 K unless f0.075, i.e. dust 13x warmer than the gas).
4.2.1 Strong surpression of the average FUV radiation fields in merger/starbursts
The Y factors estimated in the previous section will be generally lower still if the propagation of FUV light in the heavily dust-obscured SF regions of merger/starbursts is more realistically treated. Using the formalism by Wolfire et al. 1990 for galactic centers, the average FUV radiation field incident on molecular clouds randomly mixed with the forming stars has an intensity:
| (4) |
where is the mean distance FUV photons propagate before being absorbed. The size of the starburst responsible for the observed is denoted by and can be as compact as (200-300) pc (see our section 3.4; Sakamoto et al 2008). For the dust-enshrouded ISM of merger/starbursts, with its high average densities of cm-3 clumpy PDR models give 1 pc (Meixner & Tielens 1993). For Arp 193 and NGC 6240 where (2-4)1011 L⊙ Equation 4 yields: 220–1500, which is 3-4 times and up to an order of magnitude lower than the values derived in 4.1. Moreover Equation 4 yields an estimate of the average FUV field incident on molecular cloud surfaces, which will be lower deeper inside their (CO/HCN)-rich inner regions. The fundamental role of the FUV radiation in gas heating in PDRs but also the limitations placed by its strong dust absorption can be further highlighted by the archetypal PDR in Orion’s Bar. Its thickness is only (0.2-0.5) pc (Tielens & Hollenbach 1985), leaving the bulk of the Orion molecular cloud cold (Sakamoto et al. 1994). The large surpressions of the average FUV radiation fields expected in the ISM of dusty mergers further accentuate the need for (non FUV photon)-driven gas heating mechanisms in such galaxies.
5 The gas heating mechanisms in LIRGs: towards a complete diagnostics
Similar investigations of the thermal/dynamical states of the dense molecular gas have already been made for the Galactic Center (Bradford et al. 2005; Ao et al. 2013) and the nucleus of NGC 253 (Bradford et al. 2003; Hailey-Dunsheath et al. 2008). These were the first to establish CRs and/or turbulence as dominant gas heating mechanisms in these regions using energy balance criteria similar to ours in Section 4. Another criterion they used was the PDR-expected warm gas mass fraction, finding a much larger one than could be maintained by FUV photons from PDRs (e.g. Bradford et al. 2003). This can be so even as the molecular line ratios could still be fitted by PDR ensembles. Indeed molecular line ratios alone cannot discern the dominant molecular gas heating mechanisms in LIRGs. This was shown in Mrk 231 where hot and dense PDRs can reproduce its CO line ratios up to J=13–12 but cannot contain much molecular gas mass without their warm dust ′′outshining′′ the observed dust SED, and an X-ray dominated region is necessary (van der Werf et al. 2010). Such ′′normalization′′ tests, whether using the warm molecular gas mass fraction, its concomitant dust mass and SED, the dust IR-brightness (Rangwala et al. 2011), or the observed high-J CO line luminosities (Bradford et al. 2003), are crucial for discerning whether PDR ensembles can truly account for the molecular line emission in LIRGs or not.
5.1 New gas heating mechanisms in merger/starbursts: a general argument
A ′′normalization′′ criterion based on the warm gas =(HI+H2) mass fraction expected in PDRs can be readily used for the ISM of merger/starbursts. An approximate value in FUV-irradiated GMCs can be found by computing the mass of the outer atomic HI layer marking the HIH2 transition as it is comparable to the warm PDR H2 layer extending further inwards. Thus the PDR-residing column density N(HI+H2)2. For a given , metallicity Z (Z=1, Solar), and average gas density n, this column density can be computed in units of optical extinction as (see Pelupessy et al. 2006 for details):
| (5) |
with =4 s-1 the H2 dissociation rate (for =1), 3 cm-3 s-1 its formation rate on grains (for typical CNM HI), and =6.6 is the H2 self-shielding function over the HI/H2 transition layer, with =2-3 the dust cross section ratio for FUV and optical light. The PDR-related gas mass fraction per GMC then is:
| (6) |
assuming spherical and uniform GMCs that do not cross-shield and hence each receives the full FUV radiation field. These simple assumptions make the computed a maximum since the denser substructures existing within GMCs, and the inevitable cloud-cloud cross-shielding, will lower its actual value as denser gas deeper inside will have even thinner PDR layers, and cloud cross-shielding will reduce the actual (see 4.2.1).
The mean optical extinction per GMC is a function of the ambient ISM conditions, mainly the average gas pressure (dominated by supersonic non-thermal gas motions). The empirical Galactic (average density)-(size) relation n(2R)-1, along with its normalization in terms of cloud boundary pressure , yields (see Pelupessy et al. 2006):
| (7) |
where 1500 cm-3. For average GMC densities of 100 cm-3, Solar metalicities, =2, and =5-10 (for ordinary SF environments) Equation 5 yields 0.50-0.75, while for typical ISM pressures in galactic disks (1-2)104 K cm-3: 3.3-4.7. Under such conditions the HI+(warm H2) PDR gas phase contains 0.74–1 (from Equation 6), and thus most HI and H2 gas is indeed in PDRs as is often stated (Hollenbach & Tielens 1999). In merger/starbursts however the highly turbulent molecular gas can reach pressures of (–) cm-3, conditions recently inferred even in a distant ULIRG at z2.3 (Swinbank et al. 2011). In such an ISM: ULIRG100–330, creating an environment where FUV photons do not penetrate deep. Indeed, even for a high = and average densities of n= cm-3 (typical for merger/starbursts): 1.4–1.9, and thus 0.03–0.15, with only half of that as molecular gas (0.015–0.075). In reality average FUV radiation fields irradiating the dense molecular gas in ULIRGs will have – (4.2.1), for which 0.15–0.77 (for n= cm-3), and (HI+H2)0.0035–0.06.
Thus for the high average densities and pressures of the molecular gas in merger/starbursts, PDRs will be confined in very thin layers per molecular cloud with few%, essentially undoing the effects of stronger radiation fields (which act to ′′thicken′′ PDR layers). Hence any molecular SLED decomposition that yields much larger warm gas mass fractions cannot be attributed to PDR ensembles. We note that we assumed metal-rich ISM (Z1), which may not be so for merger/starbursts at high redshifts. The expected must then be computed for their average metalicities, and can be substantially larger for Z1. In metal-poor environments a particularly luminous C+ line can be expected, with a larger from the much ′′thicker′′ CO-poor envelopes of PDRs around molecular clouds.
5.2 Turbulence and CRs as new global molecular gas heating mechanisms
In compact merger/starbursts high SF rate densities boost their average CR energy density by (–)Galactic while highly supersonic turbulence (fueled by the merger process) is typical. In such environments it has already been shown that CR and turbulent heating ( and ) alone can maintain warm gas states even in the complete absence of photoelectric heating (Papadopoulos et al. 2010, 2012a). In reality they can easily surpass for large amounts of molecular gas mass even as all three processes take place.
For CRs: [0.038–0.075] (for photolectric efficiency =(1-2)%, and using the expressions in Appendix C). For a constant average ratio / at cloud boundaries ( and both being proportional to the local SFR density), we find that for =3-4, 0.6-3, i.e. CR heating becomes comparable and overtakes photolectric heating as the ambient FUV field becomes strongly attenuated. In the Galaxy such optical depths still include most of a typical GMC’s mass, but in the high-pressure ISM of mergers these include only small mass fractions (see 5.1).
For turbulence: (0.15–0.30) (using expressions in Appendix C). For Galactic GMCs with boundary pressures: =104 K cm-3 and sizes of =(10-20) pc (turbulence driven at the largest scales): (0.47–1.34), which remains 1 for – typical in starbursts. However for the high-pressure ISM of merger/starbursts: (–) K cm-3 and (85–1340). Turbulent heating can then overtake photolectric heating, except in the outer GMC layers near O,B stars where remains high (we considered no attenuation of the average , making the computed a minimum). For a ′′bottom′′-driven turbulence in merger/starbursts (i.e. injected at small scales and high-density regions, Papadopoulos et al. 2012a), turbulent heating may be strong even for the densest and most FUV-shielded molecular gas, quite unlike Galactic GMCs where turbulence in such regions has dissipated.
5.3 Future prospects in the age of ALMA and JVLA
The divergence of the IR-normalized high-J CO SLEDs of two IR-luminous starbursts with otherwise similar low-J CO SLEDs, and , ratios highlights the uncertainties of assuming the high-J CO line excitation in the absence of appropriate observations as it has been the practice at high redshifts (e.g. Tacconi et al. 2006). As Arp 193 and NGC 6240 demonstrate, similar ′′proxies′′ of SF ′′efficiencies′′ and dense gas mass fractions can still correspond to different dense gas conditions and thus high-J CO SLEDs. Moreover a strong decoupling of molecular gas and dust temperatures with , maintained deep inside FUV-shielded regions, is expected where turbulent and/or CR heating dominate. These in turn induce very different initial conditions for star formation, making molecular line diagnostic of FUV-shielded dense gas crucial for star formation theories.
Molecular line diagnostic of (non FUV)-photon gas heating will become readily accessible with ALMA (Papadopoulos 2010; Bayet et al. 2011; Meijerink et al. 2011), with a recent such study done for the dense molecular gas in the Galactic Center (Ao et al. 2013). In the absence of very high-J CO SLEDs, which for the local Universe are accessible only from Space, multi-J CO and 13CO lines up to J=6–5, 7–6, and large dipole moment molecular lines are adequate for revealing non-photon gas heating. Extreme thermal and dynamical states in the dense gas of merger/starbursts can be powerfully probed using imaging of line emission from high-dipole molecules (e.g. HCN) and one of its rare isotopologues (e.g. H13CN). ALMA with its large sensitivity, correlator versatility and wide bandwidths (allowing multi-line observations), can routinely conduct such investigations in star-forming galaxies in the coming decades. Finally, with the determination of (H2) being a necessary step for finding what fraction of it is warm and dense (and whether PDRs can account for it), the JVLA with its access to the low-J CO SLEDs at high redshifts remains indispensible.
On the theoretical front, discrete-component decompositions of molecular SLEDs like those used in this work and throughout the literature (e.g. Rangwala et al. 2011; Panuzzo et al. 2010; van der Werf et al. 2010) must be replaced by continous distributions that represent more realistic renderings of the conditions inside molecular clouds. This can then yield much more powerful, physically-motivated, ′′continous′′-component decompositions of molecular SLEDs of galaxies with fewer degeneracies than the discrete decompositions, while containing more information about the underlying physical conditions of turbulent molecular clouds (see also Appendix B). The recent shock-model of the CO SLED of NGC 6240 by Meijerink et al. 2013 is a step towards such a ′′continous′′-component CO SLED modeling based (in this case) on the underlying physics of shocked gas. The large molecular line data sets that ALMA will deliver for the extragalactic ISM will then set much more powerful constraints on such SLED models, and on the physical conditions of the molecular gas in merger/starbursts where the most decisive tests for SF theories may lie.
5.4 Conclusions
We present a large set of molecular line observations of Arp 193 and NGC 6240, two prominent merger/starbursts, using the SPIRE/FTS instrument aboard the Herschel Space Observatory (HSO), the IRAM 30-m telescope at Pico Veleta (Spain) and the 12-m APEX telescope in the Atacama Desert (Chile). These two LIRGs, selected from our Herschel Comprehensive (U)LIRG Emission Survey (HerCULES) have similar low-J CO SLEDs, = and =/ ratios (proxies of SF efficiency and dense gas mass fraction) are good benchmarks for studying the dense gas in mergers where this component may dominate. Our analysis of the molecular SLEDs yields the following results:
-
•
The two IR-normalized CO SLEDs markedly deviate from J=4–3 onwards with NGC 6240 having a highly excited SLED with large line/continuum ratios up to J=13–12 while Arp 193 has a significantly lower global high-J CO excitation (and line/continuum ratios) despite being one of the three most intense starbursts in the local Universe.
-
•
Only (5–15)% of the H2 gas mass in Arp 193 is at n cm-3 (the primary star formation ′′fuel′′), while in NGC 6240 this rises to (70–90)%, more typical for a merger/starburst. Terminal SF feedback, with Arp 193 ′′caught′′ during a short-timescale gas-(dispersal/consumption) maximum of its duty cycle, can induce such a disparity.
-
•
We deduce 150 (Arp 193) and up to 300-500 (NGC 6240), much higher than in the Galaxy. A top-heavy galactic IMF sustained over long timescales in merger/starbursts can produce such high abundances. By measuring several isotope ratios of atoms like C, N, and S using a multiplicity of corresponding isotopologue molecules and their rotational transitions ALMA can now powerfully probe the IMF in galaxies where very high dust extinctions render the use of starlight for such a task nearly impossible.
-
•
In both galaxies the gas component responsible for their luminous heavy rotor SLEDs can account also for their high-J CO SLEDs from J=5–4, 6–5 up to J=13–12. In NGC 6240 most the H2 gas mass is in states irreducible to self-gravitating and photoelectrically heated gas, and this also the case for the warmest gas phase in Arp 193.
Finally we give a general argument on why the FUV radiation from PDRs is unlikely to encompass large molecular gas masses in merger/starbursts and maintain the extraordinary thermal states often found for their dense gas. Turbulent and/or CR heating can readily do so, unhindered by the large dust extinctions, and without destroying the complex heavy rotor molecules like HCN as FUV radiation from PDRs does. Such heating mechanisms will then alter the initial conditions of star formation away from those in the Galaxy and isolated spirals, making starbursts/mergers critical testbeds of star formation theories. ALMA and the JVLA, with their exceptional sensitivity can play a leading role in determining the initial conditions of star formation in dust-obscured galaxies across cosmic epoch.
Appendix A The LVG radiative transfer model and typical degeneracies
For each gas component a 3-dimensional parameter grid with regularly spaced temperature , density n(), and fractional abundance versus velocity gradient is used as an input to a Large Velocity Gradient (LVG) radiative transfer code. is the molecular abundance ratio with respect to H2. In this work =2 (Greve et al. 2009), =8 (Jansen 1995), and =1 (Greve et al. 2009). The parameter grid spans =(–) K, n()=(102–108)cm-3, and (dV/dR)=(–) km s-1 pc-1. We sample it using with logarithmic steps of 0.1 and generate the model grids with RADEX (van der Tak et al. 2007).
For each individual model a value is calculated using the ratios of line brightness temperatures obtained from the models and the observations. We then compute =, where is the ratio of the measured line luminosities, the error of the measured line ratio, and the ratio of the line brightness temperatures calculated by the LVG model. We then obtain the Bayesian probability density function (pdf) for a given set of observational data with respect to a model using:
| (A1) |
where is the prior probability of the model. We assume flat priors () for n(), (dV/dR), and with , and set =0 for solutions outside the prior criteria. We calculate the probability for each observation of obtaining the observed data with model , which follows Gaussian distribution, using
| (A2) |
where is the measurement set, the normalization, and calculated for each model. We set line optical depths 100 as required by the RADEX manual. Finally we search two solution classes classified by the gas dynamical state, self-gravitating: 0.52, and unbound states: 0.520 (see 3.1.1).
An obvious degeneracy inherent in all our solutions, and indeed present in all LVG radiative transfer models, is that between the asssumed molecular abundance and (dV/dR) since an LVG model always uses the combination. Only radiative transfer models that solve for the chemical networks while also computing the gas thermal state (since it strongly affects the reaction rates) can avoid such degeneracies. Since 1985 (Hollenbach & Tielens 1985) all such models have been developed for PDRs and only much later expanded to include X-ray Dominated Regions (XDRs) expected near AGN (Meijerink & Spaans 2005), and CR-dominated Regions (CRDRs) (Papadopoulos et al. 2011). None yet employs an LVG approximation, necessary for modeling line emission from macroturbulent molecular clouds. We are currently developing a multi-component (PDR/XDR/CRDR)-LVG code to be used in the future.
Another degeneracy common among LVG models, is that of the parameter. Unless one sets a probability prior to restrict the grid to self-gravitating gas states (1), solutions with 1 are nearly always possible for a given set of CO/HCN SLEDs besides the self-gravitating solutions. This particular degeneracy direct impacts the corresponding and factors (compare Figures 12, 13 with 14, 15). We nevertheless consider also unbound states, even for the dense gas, as these are possible in the extreme ISM environments of merger/starbursts (see 3.1.1). In our HCN/CO SLED decomposition we list both types of solutions (see Table 3, and Figures 16, 17). Finally a n()– degeneracy exists in all our (HCN/HCO+)-constrained LVG solutions (see Figures 5, 6, 9, 10).
Appendix B The fitting procedure and future developments
In supersonically turbulent molecular clouds a wide range of densities and temperatures is expected, and the n()– parameter space defined their HCN SLEDs will be ′′populated′′ by them. In our modeling this is used to obtain the CO SLEDs as a superposition of states drawn from the n()– space as constrained by the luminous global HCN SLEDs (for NGC 6240 also the CS and HCO+ SLEDs). The ISM physics behind this choice is outlined in 3.3. Dynamical mass constraints can yield additional restrictions towards the cold/dense ′′corner′′ of this n()– parameter space (see 3.2, 3.3). Future higher-J HCN and HCO+ measurements and of their rarer isotopologues (e.g. H13CN) can also do this for its (high-)/(low-n) domain.
Our fitting process starts from the (high-)/(low-n) end of the parameter space shown in Figures 5, 9, producing all the corresponding CO SLEDs within the regions of maximum probability. Once a template SLED whose shape matches the largest possible segment of the high-J CO SLED is found, its mass scaling factor is determined so the observed and the model SLED are brought to the same scale. The resulting scaled-up SLED template is then subtracted from the observed one, and the process is repeated for obtaining the next component needed to match the remaining global CO SLED. We use a discrete grid to produce the aforementioned sets of template CO SLEDs, and given its dense sampling we do not expect the main features of the CO SLED decomposition (n(H2), , relative mass constributions of the components) to depend on the grid characteristics. This is currently the practice in all such studies (e.g. van der Werf et al. 2010), but it does contain a degree of arbitariness. Moreover a discrete set of components is a poor, unphysical, description of supersonically turbulent molecular clouds. A physically motivated, continuous mass weighting function , would be much more realistic. Currently only can be obtained in this fashion from simulations of isothermal turbulent molecular clouds (Padoan & Nordlund 2002). Such an approach, apart from reducing the arbitariness and the number of free parameters of discrete-component decompositions of molecular SLED, will allow more information to be extracted for the underlying conditions of the turbulent gas from such modeling.
Appendix C The heating and cooling functions for molecular gas
The heating and cooling functions used to compute the energy balance (Equation 1) of the LVG-derived gas states making up the CO and HCN SLEDs of NGC 6240 and Arp 193 are given below (see Papadopoulos et al. 2011 for details on these functions). For photoelectric heating the corresponding expression is:
| (C1) |
where is the photoelectric heating efficiency, given by
| (C2) |
and = is a factor that determines the balance between photonization and electron recombination. We obtain the electron density by setting equal to the assumed abundance of C II (i.e. ionized carbon as the sole source of free electrons in molecular clouds). The cooling due to gas-dust interaction (since for concomitant gas and dust phases) is given by
| (C3) |
where = (f1) for the temperatures of the molecular gas and dust mass reservoir. CO rotational lines provide substantial cooling, especially for the dense gas phase deep inside GMCs. To compute we use the observed CO SLEDs from J=1–0 up to J=13–12. Thus for each phase k=1,2… (whose sum makes up the observed CO SLEDs) it is:
| (C4) |
where =(k-phase)/ is the CO line luminosity fraction corresponding to (k)-phase, =1.34 the mean molecular weight, the H2 molecule mass, and , the density and mass of the corresponding (k) component (obtained via our CO SLED decomposition). Inserting the various quantities and converting to astrophysical units yields:
| (C5) |
where we have omitted subscript (k) for simplicity as the meaning of computing per component is now clear.
The C II line at 158 m can remain powerful coolant of molecular gas even in the absence of far-UV radiation, as C II can be maintained by CRs deep inside molecular clouds (Papadopoulos et al 2011). The corresponding cooling power is given by
| (C6) |
where = is the C II abundance. In a similar fashion the cooling due to the O I line fine structure line at 63 m is given by
| (C7) |
where = is the Oxygen abundance (see Papadopoulos et al. 2011 for a derivation of these two expressions). We assume =2.9 for the abundance of Oxygen not locked in CO. For CII we set three abundance values namely: =3 (all carbon ionized), and =, corresponding to CR-maintained abundances inside (far-UV)-shielded gas regions, and compute its cooling (and Y factors) accordingly.
Finally we include the two lowest H2 rotational lines: S(0):-=2–0, S(1):-=3–1, the only ones that will be excited for (100–1000) K. The cooling function then is:
| (C8) |
with 54 cm-3 the critical density of S(0):2–0, the ortho-H2/para-H2 ratio (=1-3), and
| (C9) |
expresses the relative cooling contributions of the two rotational lines considered here (with 103 cm-3 the critical density of the S(1):3–1 line).
CRs and turbulence can also deposit large amounts of energy into the molecular gas, unaffected by extinction. For CRs the corresponding heating function is:
| (C10) |
where we used the expressions found in Papadopoulos et al. 2011, for fully molecular gas. A Galactic CR ionization rate of =5 s-1 has been assumed. For turbulent heating we use the work of Pan & Padoan 2009 as it has been reformulated by Papadopoulos et al. 2012a eventually yielding:
| (C11) |
where =1.2 km s-1 and = K cm-3.
| Line | () | (NGC 6240) | aaFor =0.0245, =105.5 Mpc (NGC 6240) and =0.0231, =99.3 Mpc (Arp 193). (NGC 6240) | (Arp 193) | aaFor =0.0245, =105.5 Mpc (NGC 6240) and =0.0231, =99.3 Mpc (Arp 193). (Arp 193) |
|---|---|---|---|---|---|
| [m] (GHz) | [Jy km s-1] | [] | [Jy km s-1] | [] | |
| CO J=1–0bbfrom Papadopoulos et al. 2012a | 2600.757 (115.271) | 32229 | 4.2 | 19416 | 2.2 |
| CO J=2–1bbfrom Papadopoulos et al. 2012a | 1300.404 (230.538) | 1492253 | 3.9 | 850130 | 2.0 |
| CO J=3–2bbfrom Papadopoulos et al. 2012a | 866.963 (345.796) | 3205642 | 1.2 | 1294171 | 4.5 |
| CO J=4–3 | 650.252 (461.041) | 4634371 | 2.4 | 1603266 | 7.4 |
| CO J=5–4 | 520.231 (576.268) | 5636149 | 3.6 | 1366143 | 7.8 |
| CO J=6–5 | 433.556 (691.473) | 591382 | 4.6 | 136962 | 9.4 |
| CO J=7–6 | 371.650 (806.652) | 600960 | 5.5 | 117838 | 9.5 |
| CO J=8–7 | 325.225 (921.799) | 583389 | 6.0 | 103646 | 9.5 |
| CO J=9–8 | 289.120 (1036.912) | 476982 | 5.6 | 84478 | 8.7 |
| CO J=10–9 | 260.240 (1151.985) | 416267 | 5.4 | 66226 | 7.6 |
| CO J=11–10 | 236.613 (1267.014) | 316174 | 4.5 | 37156 | 4.7 |
| CO J=12–11 | 216.927 (1381.995) | 259260 | 4.0 | 28232 | 3.9 |
| CO J=13–12 | 200.272 (1496.923) | 208160 | 3.5 | 12635 | 1.9 |
| 13CO J=1–0bbfrom Papadopoulos et al. 2012a | 2720.406 (110.201) | 6.51.9 | 8.0 | ||
| 13CO J=2–1bbfrom Papadopoulos et al. 2012a | 1360.228 (220.398) | 264 | 6.4 | 264 | 5.7 |
| 13CO J=3–2ccfrom Greve et al. 2009, 3 upper limit | 906.846 (330.588) | 79 | 2.9 | ||
| 13CO J=6–5 | 453.498 (661.067) | 11267 | 8.3 | ||
| 33 | 609.136 (492.161) | 1751224 | 9.7106 | 636146 | 3.1106 |
| 33 | 370.415 (809.342) | 333252 | 3.0107 | 166043 | 1.3107 |
| Line | (NGC 6240) | Referencesaa1=Nakanishi et al. 2005, 2=Greve et al. 2009, 3=Krips et al. 2008, 4=Gracia-Carpio et al. 2008, 5=Israel (private communication), 6=Papadopoulos 2007, x=this work. All values are averages of those reported in the mentioned literature (see also 2.3). | (Arp 193) | Referencesaa1=Nakanishi et al. 2005, 2=Greve et al. 2009, 3=Krips et al. 2008, 4=Gracia-Carpio et al. 2008, 5=Israel (private communication), 6=Papadopoulos 2007, x=this work. All values are averages of those reported in the mentioned literature (see also 2.3). | |
|---|---|---|---|---|---|
| (GHz) | [Jy km s-1] | [Jy km s-1] | |||
| HCN J=1–0 | 88.631 | 142 | 1,2,3,4 | 6.20.9 | 4 |
| HCN J=2–1 | 177.261 | 447 | 3 | ||
| HCN J=3–2 | 265.886 | 747 | 3, 4, 5, x | 12.32.4 | 4 |
| HCN J=4–3 | 354.505 | 416 | x | 10 (3) | 6 |
| HCO+ J=1–0 | 89.188 | 213 | 2 | ||
| HCO+ J=3–2 | 267.557 | 14121bb Our HCO+ J=3–2 flux for NGC 6240 is higher than that reported by Gracia-Carpio et al. (2008) using the IRAM 30 m telescope (the only other such measurement in the literature). We adopt our value as some of the 267 GHz observations with the IRAM 30 m have been affected by pointing offsets (the 30-m beam at such frequencies is 9′′). | x | ||
| HCO+ J=4–3 | 356.734 | 749 | 2, x | ||
| CS J=2–1 | 97.980 | 7.51.5 | x | 2.1 (3) | x |
| CS J=3–2 | 146.969 | 92 | x | 3 (3) | x |
| CS J=7–6 | 342.882 | 32 (3) | x |
| Galaxy ()aaThe galaxy and the range of the LVG radiative transfer solutions. | Component (A)bbThe gas component: [log(n), log(), , , ] where
(in units of =)
is computed from Equation 1 in Papadopoulos et al. 2012b (where 0.6–2.4). |
Component (B)bbThe gas component: [log(n), log(), , , ] where
(in units of =)
is computed from Equation 1 in Papadopoulos et al. 2012b (where 0.6–2.4). |
component (C)bbThe gas component: [log(n), log(), , , ] where
(in units of =)
is computed from Equation 1 in Papadopoulos et al. 2012b (where 0.6–2.4). |
ccThe ratio of the total gas mass to the mass contained within the CO-bright regions, estimated using
=1.3 (see 3.3).
The values marked with (*) are those for which remains significantly above unity even for =2.4, and thus excludes the corresponding CO SLED decompositions. |
ddThe effective = factor of the SLED decomposition. |
|---|---|---|---|---|---|
| NGC 6240 (0.5–2) | [4.1, 1.6, 0.9, 77%, 11.7/] | [3.8, 2.5, 1.2, 8%, 1.9/] | [2.7, 2.6, 2, 15%, 0.8/] | 2.1/(∗) | 3.2/ |
| ′′ ′′ (0.5–2) | [4.6, 1.5, 1.2, 82%, 18.9/] | [3.8, 2.5, 1.2, 5%, 1.9/] | [2.6, 2.5, 2, 13%, 0.8/] | 3.4/(∗) | 5.3/ |
| ′′ ′′ (0.5–2) | [3.8, 1.8, 0.8, 58%, 5.9/] | [3.8, 2.5, 1.2, 11%, 1.9/] | [2.7, 2.4, 2.0, 31%, 0.9/] | 1.4/ | 2.2/ |
| ′′ ′′ (0.5–20) | [4.4, 1.5, 0.8, 88%, 23.8/] | [4.3, 2.6, 8.7, 1%, 2.1/] | [2.9, 2.0, 3.0, 11%, 1.0/] | 5.5/(∗) | 8.6/ |
| ′′ ′′ (0.5–20) | [5.0, 1.5, 4.9, 67%, 7.5/] | [4.3, 2.6, 8.7, 2%, 2.1/] | [3.0, 2.0, 1.5, 30%, 1.4/] | 1.8/ | 2.8/ |
| ′′ ′′ (0.5–20) | [3.8, 1.7, 0.8, 70%, 7.4/] | [3.8, 2.5, 1.2, 7%, 1.9/] | [3.0, 1.8, 3.0, 23%, 1.1/] | 2.4/(∗) | 3.8/ |
| Arp 193 (0.5–2) | [3.5, 2.5, 1.7, 8%, 1.3/] | [4.0, 1.7, 2.0, 15%, 3.7/] | [2.9, 1.7, 1.7, 77%, 1.7/] | 0.38/ | 1.7/ |
| ′′ ′′ (0.5–20) | [3.9, 2.6, 14, 3%, 1.2/] | [4.4, 1.5, 3.9, 4%, 4.8/] | [3.0, 1.5, 3.1, 93%, 1.6/] | 0.38/ | 1.7/ |
References
- (1) Aalto S., Booth R. S., Black J. M.,& Johansson L. E. B. 1995, A&A, 300, 369
- (2) Aalto S., Garcia-Burillo S., Muller S., Winters J. M., van der Werf P., Henkel C., Costagliola F., & Neri R. 2012, A&A, 537, 44
- (3) Ao Y., Henkel C., Menten K. M., Requena-Torres M. A., Stanke T., Mauersberger R., Aalto S., Muehle S., & Mangum J. 2013, A&A, 550, 135
- (4) Andrews B. H., & Thompson T. A. 2011, ApJ, 727, 97
- (5) Baan W. A., Loenen A. F., & Spaans M. 2010, A&A, 516, 40
- (6) Bergin E. A., & Tafalla M. 2007, ARA&A, 45, 339
- (7) Bradford C. M., Nikola T., Stacey G. J., Bolatto A. D., Jackson J. M., Savage M. L., Davidson J. A., & Higdon S. J. 2003, ApJ, 586, 891
- (8) Bradford C. M., Stacey G. J., Nikola T., Bolatto A. D., Jackson J. M., Savage M. L., & Davidson J. A. 2005, ApJ, 623, 866
- (9) Braine J., & Combes F. 1992, A&A, 264, 433
- (10) Bryant P. M., & Scoville N. Z. 1996, ApJ, 457, 678
- (11) Boger G. I. & Sternberg A. 2005, ApJ, 632, 302
- (12) Casoli F., Dupraz C., & Combes F. 1992, A&A, 264, 55
- (13) Cicone C., Feruglio C., Maiolino R., Fiore F., Piconcelli E., Menci N., Aussel H., & Sturm E. 2012, A&A, 543, 99
- (14) Cicone C., Maiolino R., Sturm E. et al. 2013, A&A, (in press, arXiv:1311.2595)
- (15) Daddi E., Bournaud F., Walter F. et al. 2010,, ApJ, 713, 686
- (16) Downes D., Solomon, P. M. 1998, ApJ, 507, 615
- (17) Elmegreen B. G., Klessen R. S., & Wilson C. D. 2008, ApJ, 681, 365
- (18) Engel H., Davies R. I., Genzel R., et al. 2010, A&A, 524m 56
- (19) Gao Y., & Solomon P. M. 2004, ApJ, 606, 271
- (20) Greve T. R., Papadopoulos P. P., Gao Y., & Radford S. J. E. 2009, ApJ, 692, 1432
- (21) Griffin M. J. 2010, A&A, 518, L3
- (22) Graciá-Carpio J., Garcia-Burillo S., Planesas P., Fuente A., & Usero A. 2008, A&A, 479, 703
- (23) García-Marín, M., Eckart A., Weiss A. et al. 2011, ApJ, 738, 158
- (24) Hailey-Dunsheath S., Nikola T., Stacey G. J., Oberst T. E., Parshley C., Bradford C. M., Ade P. A. R., & Tucker C. E. 2008, ApJ, 689, L109
- (25) Henkel C., Mauersberger R. 1993, A&A, 274, 730
- (26) Henkel, C., Downes D., Weiss A., Riechers D., & Walter F. 2010, A&A, 516, 111
- (27) Hollenbach D. J., & Tielens A. G. G. M. 1985, 291, 747
- (28) Hollenbach D. J., & Tielens A. G. G. M. 1999, Reviews of Modern Physics, Volume 71, Issue 1 pg. 173
- (29) Jappsen A.-K., Klessen R. S., Larson R. B., Li Y., & McLow M.-M. 2005, A&A, 435, 611
- (30) Krips M., Neri R., Garcia-Burillo S., Martín S., Combes F., Graciá-Carpio J., & Eckart A. 2008, ApJ, 677, 272
- (31) Krumholz M. R., & McKee C. F. 2005, ApJ, 630, 250
- (32) Langer W. D., & Penzias A. A. 1990, ApJ, 357, 477
- (33) Larson R. B. 2005, MNRAS, 359, 211
- (34) Leech J., Isaak K., Papadopoulos P. P., Gao Y., & Davies G. R. 2010, MNRAS, 406, 1364
- (35) Li Y., Klessen R. S., & McLow M.-M. 2003, ApJ, 592, 975
- (36) Martin S., Aladro R., Martin-Pintado J., & Mauersberger R. 2010, A&A, 522, 62
- (37) Meijerink R., & Spaans M. 2005, A&A, 436, 397
- (38) Matteucci F. 2013, (private communication, INAF, Trieste)
- (39) Meijerink R., Kristensen L. E., Weiss A., et al. 2013, ApJ, 762, L16
- (40) Meixner M., & Tielens A. G. G. M. 1993, ApJ, 415, 216
- (41) Nakanishi K., Okumura S. K., Kohno K., Kawabe R., & Nakagawa T. 2005, PASJ, 57, 575
- (42) Padoan P., & Nordlund Å. 2002, ApJ, 576, 870
- (43) Pan L., & Padoan P. 2009, ApJ, 692, 594
- (44) Papadopoulps P. P. 2007, ApJ, 656. 792
- (45) Papadopoulos P. P. & Seaquist E. R. 1999, ApJ, 516, 114
- (46) Papadopoulos P. P. & Allen M. L. 2000, ApJ, 537, 631
- (47) Papadopoulos P. P. & Ivison R. J. 2002, ApJ, 564, L9
- (48) Papadopoulos P. P. 2007, ApJ, 656, 792
- (49) Papadopoulos P. P., Isaak K. G., & van der Werf P. P. 2007, ApJ, 668, 815
- (50) Papadopoulos P. P. 2010, ApJ, 720, 226
- (51) Papadopoulos P. P., van der Werf P. P., Isaak K. G., & Xilouris E. M. 2010, ApJ, 715, 775
- (52) Papadopoulos P. P., Thi W.-F., Miniati F., & Viti S. 2011, MNRAS, 414, 1705
- (53) Papadopoulos P. P., van der Werf P. P., Xilouris E. M., Isaak K. G., Gao Y., & Múhle S. 2012a, MNRAS, 426, 2601
- (54) Papadopoulos P. P., van der Werf P. P., Xilouris E., Isaak K. G., & Gao Y. 2012b, ApJ, 751, 10
- (55) Pierce-Price D., Richer J. S., Greaves J. S. et al. 2001,in ”Galactic Structure, Stars and the Interstellar Medium”, ASP Conference Series, Vol. 231, p.228
- (56) Pilbratt G. L., et al. 2010, A&A, 518, L1
- (57) Rangwala N., Maloney R. P., Glenn J. et al. 2011, ApJ, 743, 94
- (58) Rodríguez-Fernández N. J., Martín-Pintado J., Fuente A., & Wilson T. L. 2004, A&A, 427, 217
- (59) Romero-Cañizales C. Pérez-Torres M. A., Alberdi A. et al. 2012, A&A, 543, A72
- (60) Riechers D. A., Hodge J., Walter F., Carilli C. L., & Bertoldi F. 2011, ApJ, 739, L31
- (61) Sakamoto S., 1994, PASP, 106, 1112
- (62) Sakamoto S., Hayashi M., Hasegawa T., Handa T., Oka T. 1994, ApJ, 425, 641
- (63) Sakamoto K., Wang J., Wiedner M. C. et al. 2008, ApJ, 684, 957
- (64) Solomon P. M., Downes D., & Radford S.J.E. 1992, ApJ, 387, L55
- (65) Solomon P. M., & Vanden Bout P. A. 2005, ARA&A, 43, 677
- (66) Swinyard B. M. et al. 2010, A&A, 518, L4
- (67) Swinbank A. M., Papadopoulos P. P., Cox P. et al. 2011, ApJ, 742, 11
- (68) Tacconi L. J., Genzel R., Tecza M., Gallimore J. F., Downes D., & Scoville N. Z. 1999, ApJ, 524, 732
- (69) Tacconi L. J., Neri R., Chapman S. C., et al. 2006, ApJ, 640, 228
- (70) Thompson T. A. 2009, Astronomical Society of the Pacific Conference Series, 408, 128
- (71) van der Tak, Black J. H., Schöier F. L., Jansen D. J., & van Dishoeck E. F. 2007, A&A, 468, 627
- (72) van der Werf P. P., Isaak K. G., Meijerink R. et al. 2010, A&A, 518, L42
- (73) Weiss A., Downes D., Walter F., & Henkel C. 2007, in ¿From Z-Machines to ALMA: (Sub)Millimeter Spectroscopy of Galaxies Astronomical Society of the Pacific Conference Series, Vol. 375, pg 25
- (74) Wolfire M. G., Tielens A. G. G. M., & Hollenbach D. 1990, 358, 116
- (75) Wilson R. W., Jefferts K. B., & Penzias A. A. 1970, ApJ, 161, L43
- (76) Wilson R. W., Solomon P. M., Penzias A. A., & Jefferts K. B. 1971, ApJ, 169, L35
- (77) Wilson T. L. & Matteucci F. 1992, Astron. Astrophys. Rev. 4: 1-33
- (78) Wu J., Evans N. J., II, Gao Yu, Solomon P. M., Shirley Y. L., & Vanden Bout P. A. 2005, ApJ Letters, 635, L173
- (79) Wu J., Evans N. J. II, Shirley Y. L., & Knez C. 2010, ApJS, 188, 313
- (80) Yao L., Seaquist E. R., Kuno N., & Dunne L. 2003, ApJ, 588, 771