Removal of long-lived 222Rn daughters by electropolishing thin layers of stainless steel
Abstract
Long-lived alpha and beta emitters in the 222Rn decay chain on detector surfaces may be the limiting background in many experiments attempting to detect dark matter or neutrinoless double beta decay. Removal of tens of microns of material via electropolishing has been shown to be effective at removing radon daughters implanted into material surfaces. Some applications, however, require the removal of uniform and significantly smaller thicknesses. Here, we demonstrate that electropolishing m from stainless-steel plates reduces the contamination efficiently, by a factor . Examination of electropolished wires with a scanning electron microscope confirms that the thickness removed is reproducible and reasonably uniform. Together, these tests demonstrate the effectiveness of removal of radon daughters for a proposed low-radiation, multi-wire proportional chamber (the BetaCage), without compromising the screener’s energy resolution. More generally, electropolishing thin layers of stainless steel may effectively remove radon daughters without compromising precision-machined parts.
Keywords:
Radon daughters plate-out, electropolishing of steel surfaces, radiopurity:
23.60.+e, 29.30.Ep1 Introduction
A particularly dangerous contamination for a number of rare-event searches or screening detectors is the deposition of radon daughters from the atmosphere onto detector components made of relatively clean materials such as stainless steel. These radon daughters decay to 210Pb, a low-energy beta emitter with a long, 22-year half-life, and then to 210Bi and the alpha-emitting 210Po. The 210Pb daughter is usually plated onto surfaces or, due to the recoil energy received from 214Po (and possibly 218Po) decay, is implanted into a sub-surface layer of the material in question ( nm for stainless steel).
Electropolishing of stainless steel has been shown to be very effective at removing both 210Pb and 210Po Zuzel and Wójcik (2012). However, such electropolishing has removed significantly more material ( m) than is allowable for many applications. In particular, removing such a large thickness would be unacceptable for removing contamination from the 25 m-diameter (125 m-diameter) stainless-steel wires constituting the anode (cathode) planes of the BetaCage Shutt et al. (2005); Schnee et al. (2007); Ahmed et al. (2011, 2014); Bunker et al. (2013). In this paper we present the test results of electropolishing 30–1200 nm from the surfaces of stainless-steel samples that were artificially contaminated by exposing them to a strong radon source.
2 Preparation and Electropolishing of Samples
Four unpolished (mill finish) 316 stainless-steel samples, 2 in. 2 in. 0.1875 in., were cut from steel stock (McMaster-Carr) and prepared. The shape and size were chosen in order to fit into the chambers of alpha spectrometers and to allow placement directly on top of the window of a gamma spectrometer. Prior to exposure, the samples were scrubbed and rinsed with deionized water followed by a rinse and wipe with alcohol to remove dirt and grease. The stainless-steel samples were placed in a chamber and exposed to radon gas between Oct. 7, 2011 and Nov. 11, 2011 for a total exposure of Bq m-3 day-1. Measurement in an atomic-force microscope indicated a mean surface roughness of about 8.6 m. An additional, smoother sample (#2B finish, 0.4 m surface roughness), 1.5 in. 1.5 in., was exposed under similar conditions in order to explore the dependence of contamination removal on sample surface roughness. After exposure, the exposed surfaces were not cleaned and all handling was done with gloved hands touching only the sides or bottom of each sample.
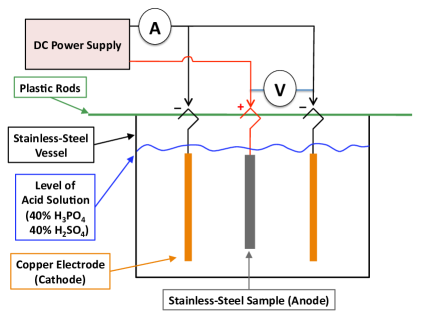
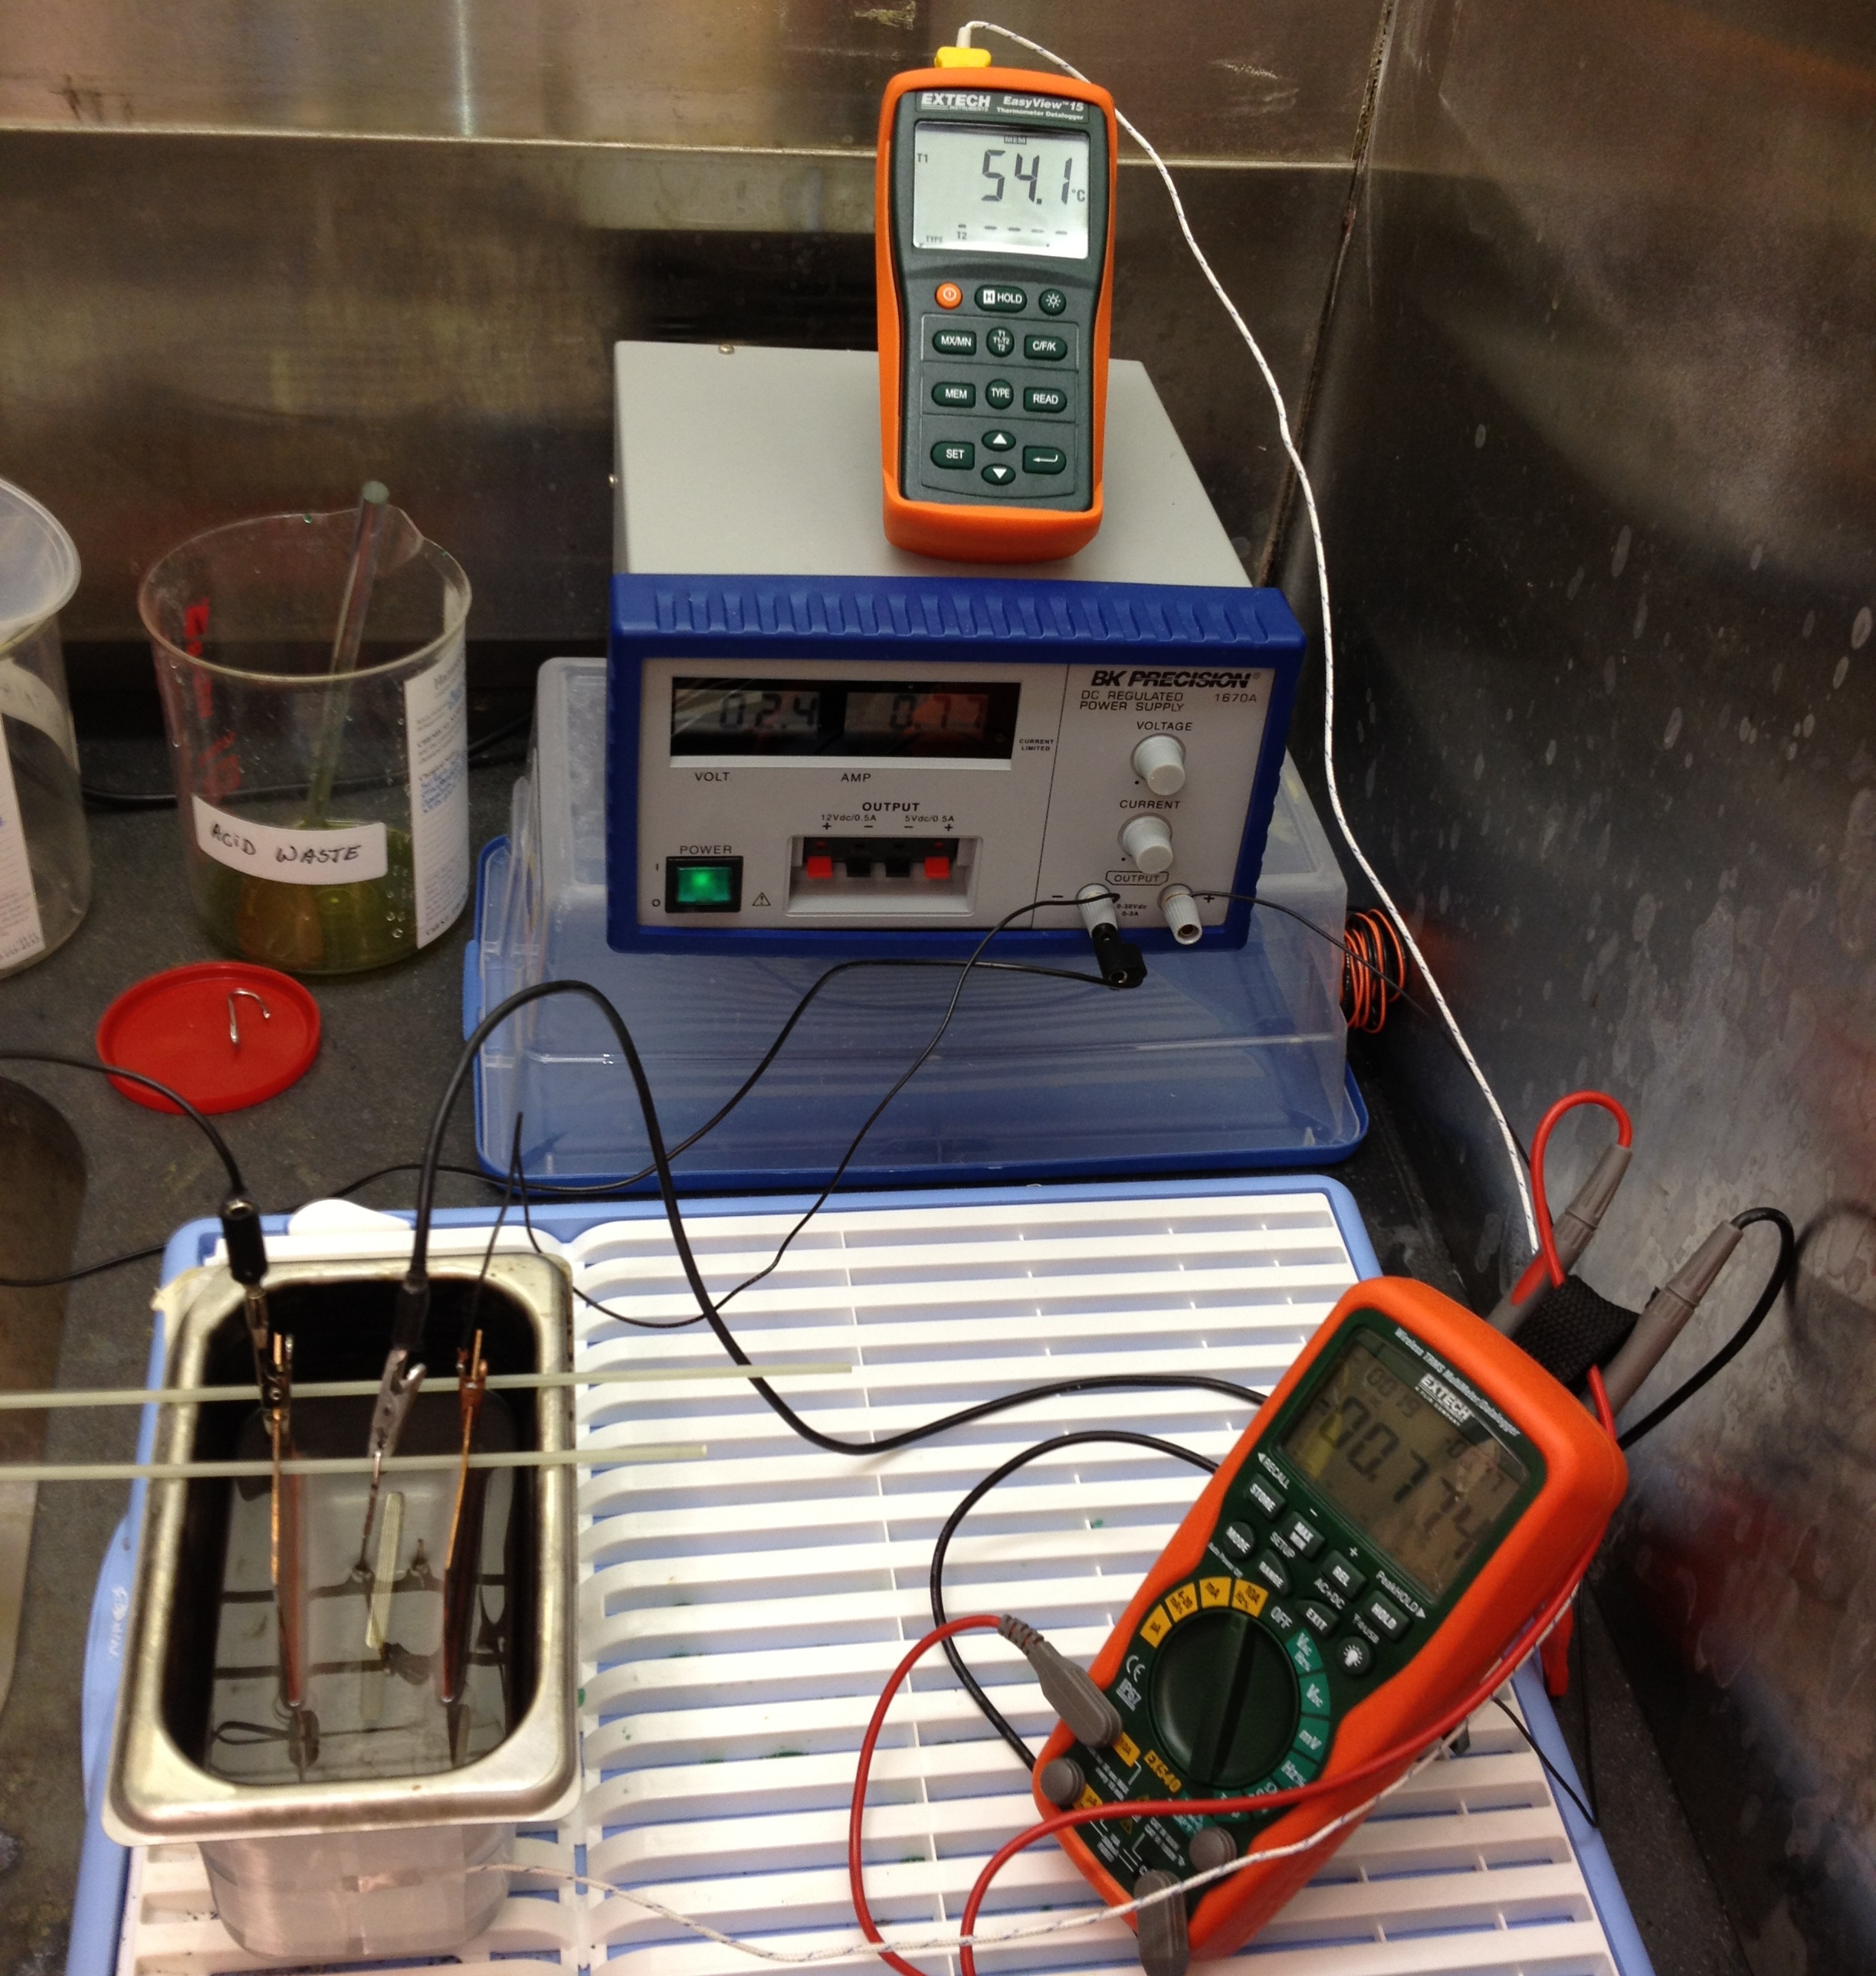
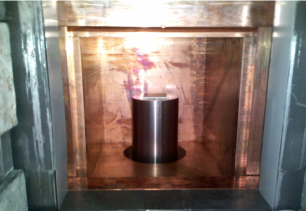
The electropolishing was performed using the simple setup shown in Fig. 1. It consisted of a voltage source, current and voltage meters, and two 100 mm 100 mm square cathodes made out of copper. The applied electrolyte was a mixture of H3PO4 (40%) and H2SO4 (40%). The applied voltage was 2.4 V (DC). Although the current during electropolishing tends to decrease over time, the value was effectively constant ( A) during the short (10 s – 2 m) electropolishing runs performed here. We determined the amount of material removed by weighing the samples with a digital scale (Mettler AE 200) with a precision of 1 mg (with its glass doors closed). Repeated measurements of standards before and after each sample weighing allowed compensation for drifts in the absolute weight scale and estimates of the mass-loss uncertainty. Average removal rates, assuming a stainless steel density g cm-3, were about 4 nm/s for the square samples.
3 Measurement of uniformity and removal of contamination
An alpha spectrometer (ORTEC Alpha Ultra-AS 33.8 mm diameter Si detector) with a background of cpd in the energy region of interest from 5.20–5.35 MeV measured 210Po surface activity. A small distance between the detector and the sample (5 mm) and low operating pressure of 200 mTorr allow for alpha spectroscopy with a high efficiency (13.8%) and good energy resolution, so long as the contamination is on the sample surface (see Fig. 2). The absolute efficiency was taken as the geometrical efficiency of the detector, and checked by comparing the measured rate for a calibrated source to the expected rate based on the calculated geometrical efficiency. However, since final results depend only on relative changes in the signal from before to after cleaning, the uncertainty on the absolute calibration of the detector is ignored here.
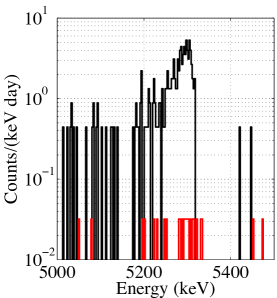
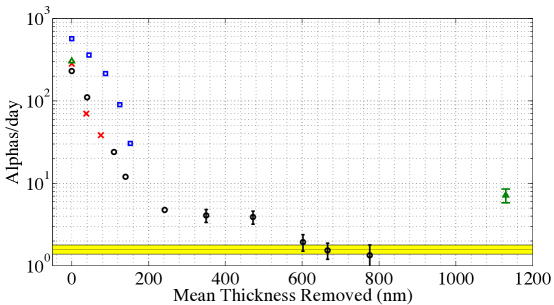
Figure 2 shows the results of the electropolishing on the measured 210Po alpha rates, ignoring (small) corrections for drifts in the digital scale, drifts in the alpha identification efficiency due to gain drifts, and for grow-in of the 210Po over the time to make these measurements. The reduction approximately follows an exponential profile with characteristic mean thickness nm causing a reduction, with similar results for all samples with total rates above 10 alphas/day. For Sample #3, reduction stalled with the alpha rate at about 5 events/day until an improved technique, using a fresh solution of ultra pure water, was used. At that point, the rate on the sample was reduced to a level at or below the chamber background. Contamination in the rinse water may also affect lowest-rate data taken with Sample #1 and the sample with the #2B finish.
A likely reason why only a fraction of the deposited 210Po is removed per 50 nm of material removed is the sample surface roughness. Electropolishing tends to smooth out surfaces by preferentially removing atoms from protrusions, so much of the removed material is likely from parts of the sample deeper than any 210Po. The first data from the smoother sample suggests contamination was removed at a slightly faster rate. Studies in the near future will concentrate on determining the relationship between and surface roughness by electropolishing smoother samples while correcting for systematic effects.
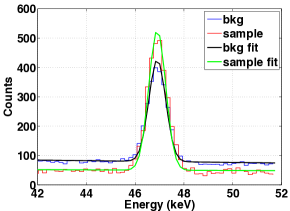
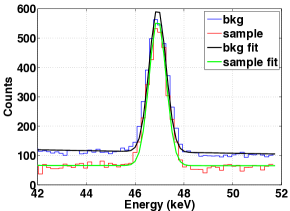
Removal of 210Pb by electropolishing small thicknesses of steel was confirmed by observing the 46.6 keV gamma line with two samples placed directly on top of the 1.6 mm aluminum window of the GOPHER n-type high purity germanium detector, as shown in Fig. 3. GOPHER sits within a high-purity copper-lined lead shield and includes a radon purge unit with sample load-lock. A detailed, custom GEANT4 simulation of the detector sample geometry indicates a 35% efficiency for 46.6 keV gammas originating on the surface of the sample facing the detector window. Samples #1 (with 1.1 m removed) and #2 (control) were counted in the GOPHER HPGe counter for 18 and 14 days respectively. Sample #2 had Bq/m2 210Pb. This measurement, combined with the relative alpha rates of Samples #1 and #2 before Sample #1 was electropolished, allows the 210Pb activity on Sample #1 before electropolishing to be inferred as Bq/m2. Measurement of Sample #1 after electropolishing was consistent with detector backgrounds, indicating an upper limit at the 90% confidence level of 1.1 Bq/m2. The reduction factor due to electropolishing was , consistent with expectations that the reduction of 210Pb would be at least as large as the measured factor of for 210Po for the same Sample #1.
3.1 Uniformity of electropolished wires
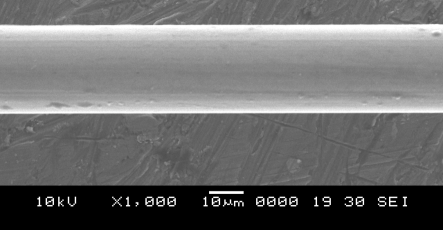
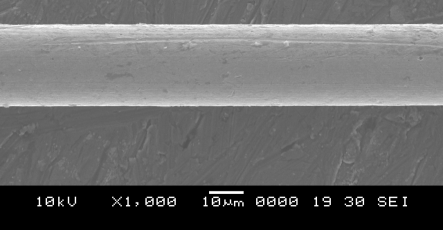
To test the uniformity resulting from electropolishing thin layers of stainless steel, a strand of 25-micron fine wire (California Fine Wire Co.) approximately two inches in length was electropolished in the same setup shown in Fig. 1 for sixty seconds, cleaned with ultra-pure water and isopropyl alcohol, and dried with compressed CO2 gas. The wire was then measured at multiple points along its length using a scanning electron microscope and the GIMP image manipulation program (see Fig. 4). An unelectropolished wire was examined and analyzed for the control. The unelectropolished wire showed a standard deviation nm around its mean diameter m. The electropolished wire had nm and m. The relatively large standard deviation on the unelectropolished wire may indicate that handling causing the wire to deform into an oval cross-section may be the dominant source of measured non-uniformity. In any case, even for this relatively large thickness removed, the resulting uniformity is quite good. In particular, the standard deviation nm would be sufficient to provide % gain variation in a drift chamber, sufficient for the proposed BetaCage Shutt et al. (2005); Schnee et al. (2007); Ahmed et al. (2011, 2014); Bunker et al. (2013).
References
- Zuzel and Wójcik (2012) G. Zuzel, and M. Wójcik, Nuclear Instruments and Methods in Physics Research A 676, 140–148 (2012), URL http://www.sciencedirect.com/science/article/pii/S0168900211022522.
- Shutt et al. (2005) T. Shutt, C. E. Dahl, L. de Viveiros, R. J. Gaitskell, and R. W. Schnee, “Beta Cage: A New, Large-Area Multi-Wire Screening Detector For Surface Beta Contamination,” in Topical Workshop on Low Radioactivity Techniques: LRT 2004, American Institute of Physics Conference Proceedings, Melville, NY, 2005, vol. 785, pp. 79–83.
- Schnee et al. (2007) R. W. Schnee, Z. Ahmed, S. R. Golwala, D. R. Grant, and K. Poinar, “Screening Surface Contamination with BetaCage,” in Topical Workshop on Low Radioactivity Techniques: LRT 2006, American Institute of Physics Conference Proceedings, Melville, NY, 2007, vol. 897, pp. 20–25.
- Ahmed et al. (2011) Z. Ahmed, S. R. Golwala, D. R. Grant, M. Kos, R. H. Nelson, R. W. Schnee, and B. Wang, “Status of BetaCage: an Ultra-sensitive Screener for Surface Contamination,” in American Institute of Physics Conference Series, edited by R. Ford, 2011, vol. 1338 of American Institute of Physics Conference Series, pp. 88–92.
- Ahmed et al. (2014) Z. Ahmed, M. A. Bowles, R. Bunker, S. R. Golwala, D. R. Grant, M. Kos, R. H. Nelson, A. Rider, R. W. Schnee, D. Sotolongo, B. Wang, and A. Zahn, JINST 9, P01009 (2014).
- Bunker et al. (2013) R. Bunker, M. A. Bowles, M. Kos, R. W. Schnee, B. Wang, Z. Ahmed, S. R. Golwala, R. H. Nelson, A. Rider, A. Zahn, and D. R. Grant, “The BetaCage, an Ultra-sensitive Screener for Surface Contamination,” in Topical Workshop on Low Radioactivity Techniques: LRT 2013, edited by L. Miramonti, and L. Pandola, 2013, vol. 1549 of American Institute of Physics Conference Series, pp. 132–135.