Sources of the systematic errors in measurements of
214Po decay half-life time variations at the Baksan deep
underground experiments 111Talk at The
International Workshop on Prospects of Particle Physics: ”Neutrino
Physics and Astrophysics” January 26 - Ferbuary 2, 2014, Valday,
Russia
E.N. Alexeyev†, Yu.M.
Gavrilyuk†, A.M. Gangapshev†, V.V. Kazalov†,
V.V. Kuzminov†, S.I. Panasenko†,‡,
S.S. Ratkevich†,‡
†Baksan Neutrino Observatory INR RAS, Russiaa
‡ V.N.Karazin Kharkiv National University, Ukraine
Abstract
The design changes of the Baksan low-background TAU-1 and TAU-2 set-ups allowed to improve a sensitivity of 214Po half-life () measurements up to the are described. Different possible sources of systematic errors influencing on the -value are studied. An annual variation of 214Po half-life time measurements with an amplitude of and a phase of days was found in a sequence of the week-collected -values obtained from the TAU-2 data sample with total duration of 480 days. 24 hours’ variation of the -value measurements with an amplitude of and phase of hours was found in a solar day 1 hour step -value sequence formed from the same data sample. It was found that the 214Po half-life averaged at 480 days is equal to s.
1 Introduction
At the last time in works intended to search for limits of the realization of the decay constant conservation law, a level of sensitivity not less than was reached for several radioactive isotopes. In the work [1] the authors showed an amplitude of a possible annual variation of the 198Au half-life ( days), that was measured with the relative uncertainty of does not exceeds of the central value. Variations with periods from several hours up to one year were excluded at the level of (95% C.L.) during the measurements of the 137Cs half-life ( days) in the Ref. [2]. The annual variation was excluded at the level of (95% C.L.). Variations of an activity with periods of 3-150 days were excluded at the level of (99.7% C.L.) during the measurement of the 40K activity in the Ref. [3]. It was shown that an amplitude of the annual variation does not exceeds of (95% C.L.). Variations of an activity with periods less then one year were excluded at the level of during the measurement of the 232Th activity in the Ref. [3] too.
A count rate of the detector recording the source radiation was a subject of investigations in the all mentioned works. A high sensitivity of the measurements was reached by using of a relatively high count rate ( s-1), of a control and a stabilization of conditions of the measurements and by an use of additional arrangements for a shield of the set-ups against of outer background.
The reached limitations are multiply exceed amplitude values of of the 32Si and 226Ra count rates of annual variations discussed in the work [4]. The authors examined possibilities of an appearance of such variations as a result of seasonal variations of the detector characteristics or of the one of an annual modulation of the isotope decay rates themselves under the action of an unknown factor depending of the Earth-Sun distance. It is obviously that any conclusions about a possible new physical effect could be made only after complete exclusions of variations caused by the influence of the known terrestrial geophysical, climatic and meteorological factors on source-detector couple count rates.
Unfortunately, not all such factors could be detected and be taken into account during the measurement and data processing. For example, an annual variation with the amplitude of was found as a result of a processing of collected during 500 days data sample of Earth’s surface measurement with 40K source in the Ref. [3]. It was found that this variation corresponded completely to the known annual variation of the cosmic rays intensity and could be explained by a cosmic rays background event contribution to the total detector count rate. A variation with the days period and of amplitude was found in the data collected during 480 days in the underground measurement with the 232Th source. It was found that this variation correlated with a variation of a daily averaged dead time per event and could be explained by a modulation of the RC circuit providing the shaping time of the amplifier.
The weak point of the experiments intended to monitor a stability of a controlled radiation count rate is their high sensitivity to the similar variations of measurement conditions. It seems that this shortcoming becomes unimportant in the case of the decay constant determination based on an direct registration of a nuclear life time between its birth and its decay. The same method was realized by us Ref. [5] for the 214Po which decays with 164.3 s half-life [6] by emitting the 7.687 MeV -particle. This isotope appears mainly in the exited state (%) in the 214Bi -decay. Half-lives of the exited levels does not exceed 0.2 ps [7] and they discharge instantly relative to the scale of the 214Po half-life. Energies of the most intensive -lines are equal to 609.3 keV (46.1% per decay), 1120 keV (15.0%) and 1765 keV (15.9%). So, the -particle and -quantum emitted at the moment of a birth of 214Po nuclear form start-signal and the -particle emitted at the decay moment forms stop-signal. Measurements of “start-stop” time intervals allow one to construct decay curve at an observation time and to determine the half-life time from it’s shape. The 226Ra source ( years) was used as a generator of 214Bi nuclei which arise in the decay sequence of the mother isotope.
The direct measurement of a nuclear life time allows one moreover to study the radioactive decay law itself. The theoretical models discussed in Ref. [8, 9] predict that the decay curves could deviate from the exponential law in the short- and very long-time regions of the time scale. The theoretically predicted [10, 11, 12] so called quantum Zeno effect consisting in a slowing down of the decay rate in a case of constant observations at the decaying object presents a special interest. Experimentally Zeno effect was found in repeatedly measured two-level system undergoing Rabi transitions [13], but not observed in spontaneous decays.
At the first stage of our measurements, a limitation to the possible annual variation amplitude was set at the level of . Factors limiting a sensitivity were revealed and ways of its optimization were designed.
In the present work the fulfilled improvements of the set-ups, of measurement methods and of data processing are described. An analysis of possible sources of systematic errors is performed and obtained results are presented.
2 Method of measurements
The TAU-1 and TAU-2 set-ups used in the Ref. [5] consist of the two scintillation detectors D1 and D2 each. The D1 consisted of two glued discs of a plastic scintillator (PS) with the 18 mm diameter (d) and 0.8 mm thickness (h). A thin transparent radium spot was deposited preliminary in the center of inner surface of a one disc. The detector D1 records -particles from the 214Bi decays and -particles from the 214Po decays. The massive detector D2 consisted of NaI(Tl) crystals destines for -quanta detections.
In the TAU-1 set-up it was used a single NaI(Tl) crystal (d=80 mm, h=160 mm) as D2. The D1 is placed on the end of D2. The light collection is fulfilled from a surface of the PS disc installed on a Teflon reflector.
In the TAU-2 set-up it were used two NaI(Tl) crystals (D2a and D2b with d=150 mm and h=150 mm) placed by ends one to another with the gap of 10 mm. The D1 is placed into a gap between D2a and D2b. The light collection is fulfilled from a lateral side of the PS disc installed into deep narrow well with a reflecting wall.
The measurements were carried out in the underground low background conditions at the Baksan Neutrino Observatory of the Institute for Nuclear Researches RAS (BNO INR RAS, North Caucasis). The TAU-1 set-up was located in the underground laboratory “KAPRIZ” at the depth of 1000 meters of water equivalent in a low background shield made from Pb(10cm)+Fe(15cm)+W(3cm). The time duration of the measurements was equal to 1038 days. The value of a half-life time () deduced from the analysis of the integrated decay curve was found to be equal to () s.
The TAU-2 set-up was located in the low background room in the underground laboratory DULB-4900 [14] at the depth of 4900 meters of water equivalent within the additional shield made from Pb(15 cm). The time duration of the measurements was equal to 562 days. The -value was found to be () s.
As one can see from shown results, both -values agree with the table ones within 1 table limit. However, they differ one from the other at the level of 13 due to our statistics. Such large difference indicates a presence of a systematic error in the experimental results.
The -value equal to [ (stat.) (syst.)] s, that is lying between our values, was measured at the Gran Sasso in a recent work [15].
A possible source of the supposed error could be a small difference of sampling frequencies of the two digital oscilloscope (DO) used for the digital record of pulses. A time duration of reference square-wave pulses from a high stability pulse generator was measured by both DO in order to determine a such possible difference. It was found that difference of measured time durations is not exceeds time-channel for the 3400 time-channels pulse or the uncertainty is not more than .
Later both set-ups were considerably modernized to improve the sensitivity.
In the TAU-1 set-up the single-crystal detector D2 was substituted for the two-crystal detector, that is similar to one used at the TAU-2. The PS discs in the D1 detector were replaced by two silicon surface-barrier semiconductor detectors (SiD) with the diameter of a sensitive region of 25 mm. In the preliminary measurements it was found that the SiD lost forever its working characteristics at the year if an active spot of the source was deposited on the window surface in the way described earlier. The source was made as separate hermetical bag composed of the two plastic film discs with each thickness of 2.5 m and with the active spot deposited on the inner surface of the one disc. The source was installed hermetically between the two SiD.
In the TAU-2 set-up just a similar source was installed between the fresh PS discs in the detector D1 because of a scintillation characteristic degradation of the PS under the active spot as it was also found at the first stage of measurements. The subsequent studies proved that the detection property degradations of the D1-detectors in the both set-ups were excluded. An activity of 226Ra was equal to 50 Bq in the each source.
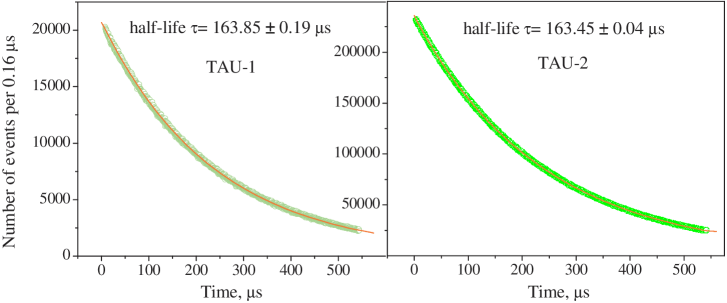
Registrations of the pulses in both set-ups are carried out by the two- channel digital oscilloscope LA-n20-12PCI which is inserted into a personal computer (PC). Pulses are digitized with 6.25 MHz frequency (160 ns/channel). The DO-pulse registration starts by a signal from the D2 which detected 214Bi decay -quanta. A D2 signal opens a record of a pulse sequence within time window of 655.36 s in which the first time interval of 81.92 s represents an event “prehistory” and the last period of 573.44 s represents an event “history”. Duration of a “history” exceeds the three 214Po half-lives. The digitized pulses in the TAU-1 recorded into the PC memory on the whole. Total count rate was equal to s-1. A daily information volume was equal to Gb.
In the TAU-2 set-up an each detected event is analyzed by the “on-line” program. A number of pulses and their time delays are defined for an each event. “Wrong” events are excluded. Only appearance times and amplitude values of pulses attributed to the “right” events were recorded in the PC memory. A complete information for the each event allows to process data in the different pulse amplitude regions in the sequel. A count rate of the “right” events was equal to s-1. A rate of the information accumulation was equal to Mbday-1.
3 Results of measurements at TAU-1.
Spectra of coincident pulses collected by the TAU-1 set-up during 270 hours are shown in Fig.1.
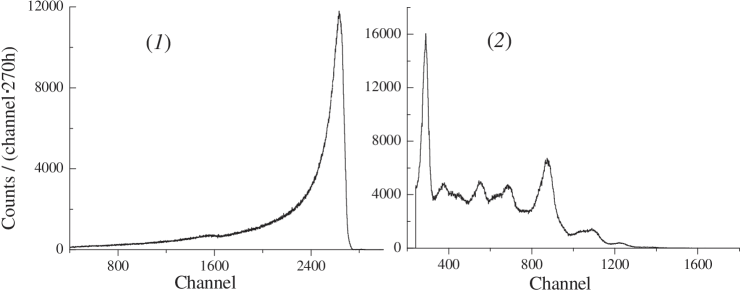
The spectrum 1 represents the data from the detector D1 and the spectrum 2 is the data from the detector D2. An amplitude threshold value of triggering pulses in the D2 channel corresponds to 450 keV. The main peak of the spectrum 1 conforms to the 7.69 MeV -particle from the 214Bi decays. The peaks from decays of the 226Ra (4.79 MeV) and 222Rn (5.49 MeV) are also presented at the spectrum. They were formed mainly as a result of random coincidences of the D2 background pulses with amplitude values above the threshold one and of the D1 -pulses with the corresponding energy that came into the frame of the window duration.
The D2 background is created by a residual radioactivity of the shield and of the detector materials and also by -quanta from decays of the 214Pb appearing in the 226Ra decay sequence. Random coincidences form a temporal-uniform background that is situated under the exponential decay curve which is produced by the true delayed - coincidences from decays of the 214Po nuclei. A small part of random coincidences is created by the 214Po -pulses that have no accompanying -pulses in those cases when a 214Po nucleus appeared as a result of a 214Bi -decay on the ground level (%), or in the cases when the normal 214Po decay was delayed for a time more then the time window duration.
A spectrum of the 214Bi -particle energy-depositions in the SiD makes up a small part of the 214Po -particle energy-depositions because of an absence of a pulse amplitude dependence on particle types. The -particle pulses and -particle pulses are overlapping at short delay times, and in the result amplitude values of summarized pulses will fall into the right slope of the -peak in the spectrum. Owing to this reason, the decay curve constructed for the narrow energy region corresponding to this slope will be enriched in the events with the short delay times in comparison with the lower energy events. These decay curves will show different values of the . The -value will depend on the low delay times and of cut threshold value of a decay curve at a process of its fitting by an approximation curve. It seems that difference of the found -values could be unessential at the appropriate value of the threshold.
In Fig.2 (left panel) it is shown a start-stop delay distribution
obtained as a result of a processing of the data collected in 116 days at the TAU-1 set-up. In addition at these measurements the TAU-1 was shielded with Pb(15 cm)+Cu(8 cm) and was situated near the TAU-2 set-up in the DULB-4900. An algorithm of the ”off-line” program provided the determinations of the maximum positions and of pulses from D1 and from D2, used for the determinations of the delay times. The following step put into operation a correction on the pulse front durations and in order to find start points of the pulses.
A value of the delay time was calculated as . The delay times distribution shown in Fig.2 is approximated by an exponential function in the form
| (1) |
by means of variations of the parameter values a, b and of according to the algorithm of the minimum -square method. A value of the half-life time is found from this approximation. The approximations were repeated many times using different threshold cuts to reveal a possible influence of the -particle pulse in the D1 channel on a determination accuracy of the - delay time measurements. The dependences of the obtained -values on a cut threshold ones (curve 1, left scale) and on the corresponding b-values of background contributions (curve 2, right scale) are shown in Fig.3 (left panel).
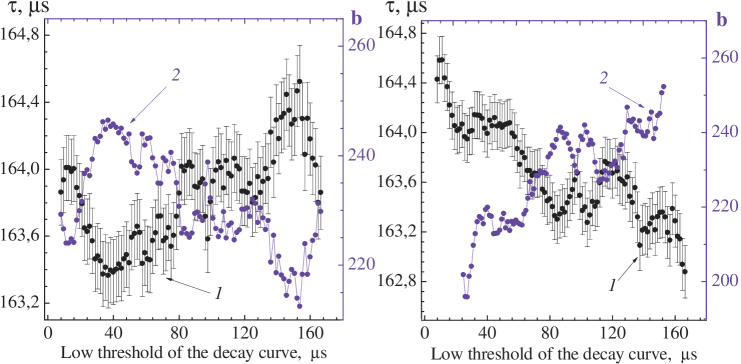
They looks like strictly anti-phased at the used right vertical scales.
In the present experiment before data recording, an event selection realized strictly under the requirement in the presence of one and only one event within time window of s of ”history”. In accordance with statistical laws [16], a distribution of random coincident events (under this selection rule) will be uniform within chosen time interval. This means that an amplitude value of the background contribution does not depend on the delays between the D2 and D1 pulses. So, the observed variations of b-values reflects only ratio changes of exponent-background for concrete part of decay curve due to using formal approximation rules. In the other words, a shape of the decay curve does not described by a single exponent within the time region of 10-30 s at a level of an accuracy of %.
A more precise value of the could be found in a case when the amplitude b of the background contribution would be known. Such possibility was found at the present phase of the experiment during the data analysis.
The method is consists on the measurement of the delays between the D2 start pulses and the preceded D1 pulses within settled time interval, that is from the “prehistory”. A distribution of the delay times for such random events will be the same as for the random event in the “history”. Unfortunately, in the before collected data a determinations the preceded delays were impossible because of the “on-line” PC treatment program of a preliminary event selections excluded such events before the recording. At present time this forbidden is eliminated and all TAU-1 events are collected.
In principle, a difference of the -value measurements obtained at the TAU-1 and TAU-2 set-ups could be explained by the other way. The different gravitation potentials at the KAPRIZ and DULB-4900 laboratories could be a reason of such a difference, if there is any dependence of the -value on values of the gravitation potentials at places on the Earth where the set-ups are situated. A gravity force in the DULB-4900 is less at than the one in the KAPRIZ laboratory due to the gravitation of the rock mass above the deep laboratory as it was measured in the Ref. [17]. This difference is much more than the periodic variations of the Earth’s surface gravitation potential caused by the Sun or by the Moon orbital moving.
In order to check this assumption, the TAU-1 set-up was replaced from the DULB-4900 laboratory into the KAPRIZ one. The conditions of the measurements and data processing were kept in the same way by chance. Time of the data accumulation was equal to 88 days. The results, that are similar to data shown in Fig.3 (left panel), are presented in Fig.3 (right panel). One can find from a comparison of the data in regions of minimums of the -values at 24 s that the -value is equal to s in the DULB-4900 place and is equal to s in the KAPRIZ place. The results are in agreement within the 1.5 interval.
4 Search for long duration variations of the TAU-2 data
A scintillation detector D1 in the TAU-2 has a relative light output equal to [18]. Because of it, the pulses from -particles and -ones have the comparable amplitudes. This circumstance was used to a preliminary selection of the “useful” events by the “on-line” program prepared the data for a PC recording. The record program selects only the events with the two pulses in the D1 channel. The first of them () is in a prompt coincidence and the second one () is in a delayed coincidence with the start pulse () in the D2 channel. The corresponding spectra of the -pulses (spectrum 3) and -pulses (spectrum 2) from the D1 detector and of the -pulses (spectrum 1) of the D2 detector collected at 435 hours are shown in Fig.4.
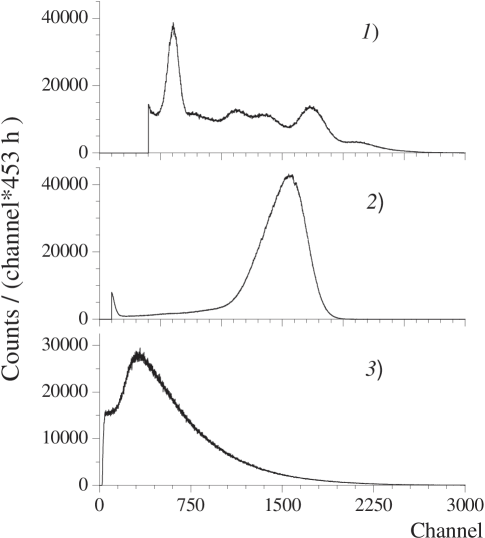
The peak at the channel on the spectrum 2 is formed by the 7.69 MeV -particles. The total time of the data collection is equal to 480 days in the period of October 2012 – January 2014.
A decay curve constructed for the total data set is shown in Fig.2 (right panel). The dependences of the -value measurements (curve 1, left scale) and of the defined b-parameter values (curve 2, right scale) on the cut threshold values are presented in Fig.5 (left panel).
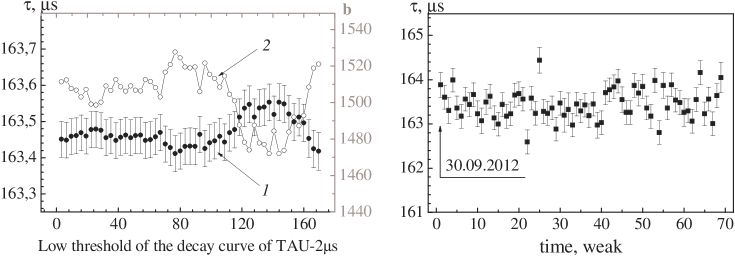
A value of the is equal to at the threshold of 24 s. It is compatible with the -value within 1 interval, that was found in the DULB-4900 experiment with the TAU-l.
The constant linear contributions of 500, 1000 and 1400 were subtracted from the decay curve data to test a dependence of the procedure for the a-, b- and -values definitions on the background contributions. The a-,b- and -values were determined with the standard procedure for each new decay curve. The a- and -values were found to be the same for all three background contributions, and the b-values was reduced exactly by the subtracted constants.
This means that: 1) a shape of a background contribution is really flat since in the opposite case the parameters of the exponent should be changed to compensate an increased contribution of the background nonlinear part; 2) an accuracy of the separation of the experimental decay curve form by the exponential part and by the flat one does not depend on the background values in the treated limits.
The time-continuous data set was divided to the equal duration time intervals to search for possible time variations. The decay curves have been constructed for each data portions and the corresponding -values have been defined. So, the continuous time-interval sequence of the -value measurements within the specified time step has been found. The dependence of the found -values on time with a week time step of the distribution is shown in Fig.5 (rigth panel). The -values were defined by means of a -approximation of the decay- curves, each collected during 7 days, by an exponential function (1). The used time window of delays was s.
There is the statistically more powerful maximum likelihood method for estimation of exponent parameters in experimental data treatments, but in order to use it a value of the background contribution b should be determined by means of an independent direct measurements or of any additional data analysis.
To search for a possible annual variation of the found -data, they were normalized to the averaged values and were compared with a periodical function
| (2) |
where days-1, t – day of year, A – an amplitude of the variation, – a phase shift relative to the 1 January. Here A and are used as trial parameters for to find best fit. The -parameter was varied from 1 to 365 with the step of 1 day. A correlation coefficient between -value sequence and was calculated for the each -value. The maximum value has been reached at days. So, the -phase value of the periodical function was found. Then a choice of A-value corresponding to the minimum was done and was found to be . A maximum of the has achieved on the 22 September. The corresponding dependences are shown in Fig.6 (left panel).
The other natural periodic variations exist which are connected with the rotation of the Earth around its axis. In particular, oscillations with periods of 24 hours in the Sun’s time. Siderial time are related to such phenomena. A -values sequence obtained for the one hour step decay curves putting in the 24 hours Sun’s day averaged from the TAU-2 data collected during 16 month is shown in Fig.6.
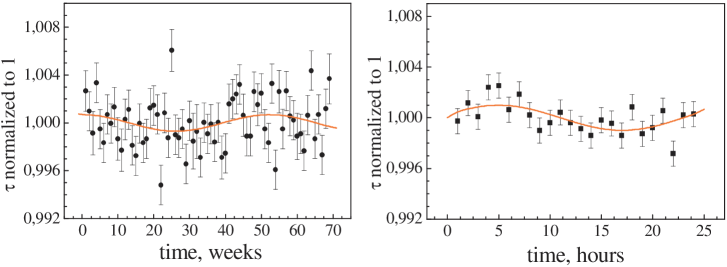
The normalized sequence was approximated by the expression (2), where h-1. A maximum correlation value of was found for the hours, at the for . The corresponding dependences are shown in Fig.6 (right panel). There are no variations in the similar data sequences treated in the sidereal time which exceed statistical dispersions with the values higher than (90% C.L.).
5 Results and discussion
The fulfilled modernization of the TAU-1 and TAU-2 set-ups allowed us to improve considerably a stability of the results and a sensitivity of long duration measurements of a half-life value of the 214Po decay as it follows from the description given above. An assumption that obtained in Ref. [5] % difference of the -values measured at the old-version of TAU-1 and of TAU-2 set-up versions could be connected with the difference of the calibrations of the used digitizers was examined by means of measurements of the stable rectangle pulse durations. It was found that an accuracy of the DO calibrations was not worse than . A hypothesis about possible correlation of -values measured by the old TAU-1 and TAU-2 and of values of gravity in the corresponding underground laboratories was tested. The values of a gravitational acceleration in used two laboratories are differ at . Firstly, a measurement was done with the TAU-1 set-up in one laboratory and than it was repeated in the other one. A weak dependence of the measured -values on decay curve cut thresholds in the low delays region was obtained in the both series. The changes of the -values do not exceeded 3 or for the s threshold changes at the achieved statistical level. A difference of the -values at the threshold of 30 s does not exceeds a value of and this difference is much lower than the one measured in Ref. [5]. A statistic of measurements in the each laboratory should be increased to a further improvement of the estimation accuracy.
A dependence of a -value on a decay curve cut threshold could be explained by small distortions of the exponent form at low delay times due to mistakes of the “off-line” program in processes of determinations of real delays in cases of front overlapping of -pulses and of -pulses. The -value variations at the time delay above s could be connected with statistical deviations of the exponent form since the statistical weights of the such deviations changed at the threshold growth. The approximation program redistributes the exponent part and background line contributions in accordance with these weights. Variations of the -value and the background contribution b are in anti-phase in accordance with expression as it seen in Figs. 3 and 5 (left panel).
It is evidently that contribution b is really constant under any part of the exponent. A steadiness on the b-values of the -algorithm of ORIGIN used for a decay-curve division between the the exponent part and background line part was tested by comparing of the results extracted by the program in the processing of the decay curves obtained as results of constant line subtractions from the primary decay curves. The identical exponent parameters were found in all tested cases. The background values b were found to be equal to the difference of the primary b-value and subtracted constant values. This observation gives a certainty in the interpretation of the data time sequences with different time steps.
The uncertainties of interpretations could arise on account of possible independent changes of the exponent and of the background parameters during a chosen time step under influences of the external reasons. The values of the parameters could be found by different ways, in principle. First, the -value for a long time interval could be calculated as average of the -values for short component time intervals. Second, the parameters could be obtained from the decay curve collected during whole analyzed time-interval by using of a standard approximation procedure. Third, the background contribution b could be excluded from a number of variable parameters before the approximation procedure by using of a constant value obtained by means of a normalization of the total data set b-value to the number of events in the analyzed time interval. A value of a standard deviation will decreased in accordance with the ratio of the time step duration to the total measurement time duration. An adequacy of these approaches was examined for the week step data decomposition. It was found that all methods gave similar results but different in details.
An independent measurement of the background contribution value should be done to obtain the result unambiguity. It was aware of possibility of realization of such measurements by using of delays between random coincide D1-pulses from “prehistory” and starting D2-pulses. Another possibility could be realized by admixing of seldom specially prepared stable generator pulses to the flow of the real pulses. An admixture could be done by direct input of the pulses into the electronic chain or by the pulse lighting of the PMTs.
The amplitude and phase in the annual variation of the -value sequence with the week data step was found to be and days.
In order to check a possible occurrence of cyclical variations with twenty-four hour period, the total data set collected at the 16 months was transformed to the 24 hour data set by summing of the information within the same numbered hour in the repeated 24 hours fragmentation. The transformation was repeated for solar, lunar and stellar times. The twenty-four hour variation with the amplitude and phase hour was found in the studied sequences averaged in the solar time.
There were no any day variations with amplitudes exceeding a statistical data straggling ( at 90% C.L.) in the sidereal time.
It is possible to suppose that the annual variation and the twenty-four hour one can have a common origin. In principle, the found effect of the decay constant variation could be created by variations of the DO sampling frequency; by variations of the delay times of the D1 and D2 pulses due to possible variations of the PMT’s time characteristics under the action of the Earth magnetic field variations; by an unknown physical effect synchronized with the day Earth circulation and with the annual one.
An instability of the DO characteristics could be created by a noticeable changing of an environmental temperature. However, due to the continuous monitoring it was shown that a temperature in the TAU-2 compartment is constant within the limits of C∘. This means that the temperature variations should be excluded from a list of possible reasons of the -variations.
Variations of the supply powers were not considered as an instability source because of all electronic systems feed by stabilized voltages. So, by the discussed reasons it seems not likely that DO characteristics instability could be a reason of the observed -variations.
Possible influences of the Earth’s magnetic field variations to the PMT’s characteristics is supposed to be investigated in the nearest future.
In the result of the treatment of the whole data sample recorded by the TAU-2 set-up during 16 months, the new value of 214Po half-life time averaged over the total observational period was found to be s. The value is compatible with the values from other measurements. Using this new value of decay constant , it is necessary to take into account the mechanisms shown above.
6 Conclusions
The results of analysis of the data obtained with the upgraded TAU-1 and TAU-2 set-ups at the new step of measurements are shown in the presented work. The set-ups are intended to carry out a long-term control of the 214Po half-life constant value. It is shown that the constant feels the twenty-four hour variation and the annual one of an unknown nature. The measurements are in progress.
References
- [1] Hardy J.C., Goodwin J.R. and Iacob V.E. // Appl.Radiat.Isot. 2012. V.70. P.1931; arXiv:1108.5326 [nucl-ex].
- [2] Bellotti E. et al. // Phys. Lett. B. 2012. V.710. P.114; arXiv:1202.3662 [nucl-ex].
- [3] Bellotti E. et al. // ”Search for time modulations in the decay rate of 40K and 232Th and influence of a scalar field from the Sun.” arXiv:1311.7043 [astro-ph.SR]
- [4] Jenkins J.H. et al. // Astropart. Phys. 2009. V32. P.42; arXiv:0808.3283 [astro-ph].
- [5] Alexeyev E.N. et al. // Astropart. Phys. 2013. V46. P.23; arXiv:1112.4362 [nucl-ex].
- [6] S.-C. Wu // Nucl. Data Sheets 2009. V110. P.681.
- [7] Table of Isotopes, Seventh Edition, Edited by Firestone R.B. et al., 8th ed. Willey, New York 1996.
- [8] Gavriljuk Ju.M. et al. // Nucl. Instr. Meth. A 2013. V729. P.576; arXiv:1204.6424 [physics.ins-det].
- [9] Gopych P.M. and Zaljubovsky L.I. // Fiz. Elem. Chast. Atom. Yadra. 1988. V.19. P.785.
- [10] Fonda L. et al. // Rep. Prog. Phys. 1978. V41. P.587.
- [11] Khalfin L.A. // Physics-Uspekhi 1990. V160(10). P.185.
- [12] Misra B. and Sudarshan E.C.G. // J. Math. Phys. 1977. V18. P.756.
- [13] Facchi P. and Pascasio S. // J. Phys. A: Math. Theor. 2008. V41. P.493001.
- [14] Itano W. et al. // Phys. Rev. A. 1990. V.41. P.2295.
- [15] Bellini G. et al. (BOREXINO Collaboration) // Eur. Phys. J. A 2013. V.491. P.92; arXiv:1212.1332v1 [nucl-ex].
- [16] Stochastic processes. Doob J. L. Wiley, New York 1953.
- [17] Medvedev M.N. // ”Report from gravity works in the Baksan Valley in 2013”. Report SAI, Moscow, November 2013.
- [18] Yushkin V.D. and Dzeranov B.D. Scintillation Detectors. M. Atomizdat, 1977.