Hydrodynamic Simulation of Non-thermal Pressure Profiles of Galaxy Clusters
Abstract
Cosmological constraints from X-ray and microwave observations of galaxy clusters are subjected to systematic uncertainties. Non-thermal pressure support due to internal gas motions in galaxy clusters is one of the major sources of astrophysical uncertainties. Using a mass-limited sample of galaxy clusters from a high-resolution hydrodynamical cosmological simulation, we characterize the non-thermal pressure fraction profile and study its dependence on redshift, mass, and mass accretion rate. We find that the non-thermal pressure fraction profile is universal across redshift when galaxy cluster radii are defined with respect to the mean matter density of the universe instead of the commonly used critical density. We also find that the non-thermal pressure is predominantly radial, and the gas velocity anisotropy profile exhibits strong universality when galaxy cluster radii are defined with respect to the mean matter density of the universe. However, we find that the non-thermal pressure fraction is strongly dependent on the mass accretion rate of the galaxy cluster. We provide fitting formulae for the universal non-thermal pressure fraction and velocity anisotropy profiles of gas in galaxy clusters, which should be useful in modeling astrophysical uncertainties pertinent to using galaxy clusters as cosmological probes.
Subject headings:
cosmology: theory – galaxies: clusters: general – methods: numerical1. Introduction
Clusters of galaxies are the largest gravitationally bound objects in the universe and therefore trace the growth of large scale structure. In recent years, X-ray and microwave observations have enabled detailed studies of the structure and evolution of galaxy clusters and significantly improved the use of these systems as powerful cosmological probes (Allen et al., 2011, for a review). However, current cluster-based cosmological constraints are limited by systematic uncertainties associated with cluster astrophysics. Controlling these astrophysical uncertainties is therefore critical for exploiting the full statistical power of ongoing and upcoming cluster surveys, such as Planck111http://www.rssd.esa.int/index.php?project=planck and eROSITA222http://www.mpe.mpg.de/eROSITA.
One of the main challenges in using clusters as cosmological probes lies in the accurate determination of their masses. Cluster mass estimates from X-ray and Sunyaev-Zel’dovich (SZ) observations are based on the assumption that cluster gas is in hydrostatic equilibrium with their gravitational potential, but there have been inconsistencies between the hydrostatic mass and the mass estimated from gravitational lensing (e.g., Zhang et al., 2010; Mahdavi et al., 2013; von der Linden et al., 2014; Applegate et al., 2014). Hydrodynamical simulations suggest that this hydrostatic mass bias arises from non-thermal pressure support in clusters that is not accounted for in current X-ray and SZ cluster mass measurements (e.g., Evrard et al., 1996; Rasia et al., 2006; Nagai et al., 2007b; Piffaretti & Valdarnini, 2008). Simulations also suggest that accounting for the non-thermal pressure support can recover the cluster mass to within a few percent (e.g., Rasia et al., 2004; Lau et al., 2009; Nelson et al., 2012, 2014). To date, it has been widely assumed that the bias in hydrostatic mass is constant with redshift and mass, but it is unclear whether this assumption is valid. For upcoming cluster surveys, which will detect clusters out to , it is necessary to characterize the mass and redshift dependence of the mass bias and its impact on cosmological inferences.
Non-thermal pressure can also affects the interpretation of the angular power spectrum of the thermal SZ signal, originated from the inverse Compton scattering of the CMB photons off hot electrons in galaxy clusters. The amplitude of the angular power spectrum of the thermal SZ signal () is very sensitive to the amplitude of matter density fluctuations () as (Komatsu & Seljak, 2002). Non-thermal pressure is one of the main astrophysical uncertainties since most of the thermal SZ signal comes from integrated thermal pressure from the hot gas in the intracluster and intragroup medium at large radii, where the level of non-thermal pressure is comparable to that of thermal pressure, and where the energy injection from stars and active galactic nuclei are expected to be subdominant. The inclusion of non-thermal pressure support can change the amplitude of the thermal SZ power spectrum by as much as (Shaw et al., 2010; Battaglia et al., 2010; Trac et al., 2011), significantly affecting its constraint on . Since the thermal SZ angular power spectrum gets contributions from galaxy groups and clusters in a wide range of redshifts and mass, a proper understanding of the mass and redshift dependence of the non-thermal pressure support is critical for using the SZ power spectrum and its high-order moment counterparts (Bhattacharya et al., 2012; Hill & Sherwin, 2013) as cosmological probes.
The upcoming ASTRO-H mission, equipped with high-resolution X-ray spectrometer, will measure internal gas motions in galaxy clusters from doppler broadening of emission lines (Takahashi et al., 2010). However, due to its limited sensitivity, the ASTRO-H measurements of the non-thermal pressure will be limited to only the inner regions of nearby massive clusters, and it will be difficult to extend these measurements to the outer regions or high-redshift clusters where the effects of non-thermal pressure are expected to be more significant.
In the absence of observational constraints, hydrodynamical cosmological simulations can serve as guides for characterizing the effects of non-thermal pressure, particularly at large cluster radii and at high redshifts. In this paper we build upon previous works (Shaw et al., 2010; Battaglia et al., 2012) by examining the non-thermal pressure fraction for a mass-limited sample of highly resolved massive galaxy clusters in a wide range of mass, redshifts and dynamical states. We show that the mean non-thermal pressure fraction as well as the gas velocity anisotropy profiles exhibit remarkable universality with redshift and mass, when the cluster mass is defined with respect to the mean mass density of the universe, instead of the critical density. We also find that these profiles show cluster-to-cluster scatter which depends primarily on the mass accretion rate of the clusters, which only affects the normalization of the profiles. We present fitting formulae for these universal profiles. These formulae should useful for characterizing the effects of non-thermal pressure on the hydrostatic mass bias, incorporating their effects in semi-analytic models of thermal SZ power spectrum, and calibrating analytical models of the non-thermal pressure profiles of clusters (e.g., Shi & Komatsu, 2014).
The paper is organized as follows. In Section 2 we give an overview of the different mass definitions and describe our dynamical state proxy; in Section 3 we describe our simulations of galaxy cluster formation; in Section 4 we present our findings; and finally we offer our conclusions and discussions in Section 5.
2. Theoretical Overview
2.1. Cluster Mass Definitions
Galaxy clusters form at the intersections of large-scale filamentary structures in the universe. As such, they have no well-defined physical edge, and we must adopt some convention for determining a boundary for the systems and their enclosed mass. The common approach is to define the boundary of a cluster as a sphere enclosing an average matter density equal to some chosen reference overdensity, , times some reference background density, . The mass of the cluster is then
| (1) |
where is the cluster radius. The two common choices of the background density are the critical density, , and the mean matter density, ,
| (2) | ||||
| (3) |
in the standard CDM spatially flat cosmological model. The reference overdensity, , is usually chosen to be a number close to , correspond to the virial overdensity under the spherical collapse model in the Einstein-deSitter universe where . In the more realistic flat CDM universe, the virial overdensity is not constant and varies with redshift (e.g., Bryan & Norman, 1998).
Conventionally has been adopted as the reference background density for the cluster mass definition: , with or . This is a convenient choice because it depends only on the critical density and does not require additional prior knowledge of . has been most widely used in analyzing Chandra and XMM-Newton clusters, since it corresponds to the radius where these observatories can reliably measure gas density and temperature profiles of the intracluster medium (ICM). is also widely used since it is close to the virial overdensity in the spherical collapse model at .
A recent work by Diemer & Kravtsov (2014) demonstrates that while dark matter density profiles with halos defined with respect to the critical density exhibit more self-similar behavior in their inner regions, adopting the reference density to be the mean matter density results in a more self-similar density profile in the outskirts, where the clusters are more sensitive to the recent mass accretion. Since gas motions are driven by mass accretion and are more significant in the outer regions of clusters, the non-thermal pressure fraction profile is expected to be more self-similar when scaled with . In this paper, we compare the non-thermal pressure fraction profile as well as the gas velocity anisotropy profile using two different mass definitions based on and . For reference, and for our sample at .
2.2. Mass Accretion Rate
We use the mass accretion rate of galaxy clusters to identify their dynamical state at . Following Diemer & Kravtsov (2014) we use the quantity as a proxy of mass accretion rate, such that
| (4) |
where is the mass of the cluster or its most massive progenitor measured at expansion factor . is computed from the difference of each respective quantity between and . The most massive progenitor of each cluster is tracked and identified using merger trees as described in Nelson et al. (2012). A higher means the halo experiences a greater physical mass accretion between and . We note that this definition of mass accretion naturally accounts for physical mass accretion and isolates effects of pseudo evolution in cluster mass (due to evolution of the background reference density , see Diemer et al., 2013), since we are comparing the increase in halo mass between two fixed redshifts.
Also note that the choice of the redshift is arbitrary, and in fact is not the only (or necessarily the best) way of characterizing the mass accretion rate. We will explore alternative methods for quantifying the mass accretion rate in future work. For now, we adopt this definition to aid comparison between our results and the -body results of Diemer & Kravtsov (2014).
3. Simulations
3.1. Hydrodynamical Simulations of Galaxy Clusters
We analyze simulated massive galaxy clusters presented previously in Nelson et al. (2014). We refer the reader to that paper for more details. We briefly summarize the relevant parameters below.
In this work we analyze a high-resolution cosmological simulation of 65 galaxy clusters in a flat CDM model with WMAP five-year (WMAP5) cosmological parameters: , , and , where the Hubble constant is defined as km s-1 Mpc-1 and is the mass variance within spheres of radius 8 Mpc. The simulation is performed using the Adaptive Refinement Tree (ART) -body+gas-dynamics code (Kravtsov, 1999; Kravtsov et al., 2002; Rudd et al., 2008), which is an Eulerian code that uses adaptive refinement in space and time and non-adaptive refinement in mass (Klypin et al., 2001) to achieve the dynamic ranges necessary to resolve the cores of halos formed in self-consistent cosmological simulations. The simulation volume has a comoving box length of Mpc, resolved using a uniform grid and 8 levels of mesh refinement, implying a maximum comoving spatial resolution of kpc.
Galaxy clusters are identified in the simulation using a variant of the method described in Tinker et al. (2008) (see Nelson et al. (2014) for a more detailed description of this method). We selected clusters with and re-simulated the regions, defined as , surrounding the selected clusters with higher resolution. The resulting simulation has effective mass resolution of surrounding the selected clusters, allowing a corresponding dark matter particle mass of . The current simulation only models gravitational physics and non-radiative hydrodynamics. As shown in Lau et al. (2009), the exclusion of cooling and star formation have negligible effect (less than a few percent) on the total contribution of gas motions to the non-thermal pressure support for , the radial range we focus on in this work. We show that our results are insensitive to dissipative physics in Appendix B.
To study the evolution of the non-thermal pressure fraction, we extract halos from four redshift outputs: . At each redshift we apply an additional mass-cut to ensure mass-limited samples at all epochs. The mass-cuts and resulting sample sizes are as follows: 65 clusters with at , 48 clusters with at , 42 clusters with at , and 42 clusters with at .
3.2. Computing the Non-thermal Pressure Fraction
The non-thermal pressure fraction is defined as
| (5) |
where is the Boltzmann constant, is the proton mass, is the mean molecular weight for the fully ionized ICM, and are the mass-weighted 3D velocity dispersion and mass-weighted temperature of the gas averaged over spherical radial shells, respectively.
To compute spherically averaged profiles of the mass-weighted 3D velocity dispersion and mass-weighted temperature we divide the analysis region for each cluster into 99 spherical logarithmic bins from to in the radial direction from the cluster center, which is defined as the position with the maximum binding energy. Our results are insensitive to the exact choice of binning. We follow the procedure presented in Zhuravleva et al. (2013), and we refer the reader to it for the details of the procedure and its impact on the non-thermal pressure measurements. Briefly, for each radial bin we exclude contribution from gas that lies in the high-density tail in the gas distribution, which remove small-scale fluctuations in the non-thermal pressure due to gas substructures while preserving the profiles of the global ICM. In addition, we smooth the profiles by applying the Savitzky-Golay filter used in Lau et al. (2009).
In computing the gas velocity dispersion, we first choose the rest frame of the system to be the center-of-mass velocity of the total mass interior to each radial bin. We rotate the coordinate system for each radial bin such that the -axis aligns with the axis of the total gas angular momentum of that bin. We then compute mean and mean-square gas velocities weighted by the mass of each gas cell. The velocity dispersion is computed as for both the radial and tangential velocity components and . The 3D velocity dispersion is simply .
4. Results
4.1. Universality with Redshift
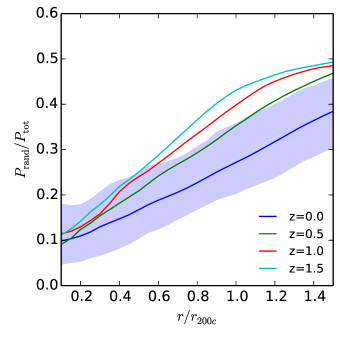
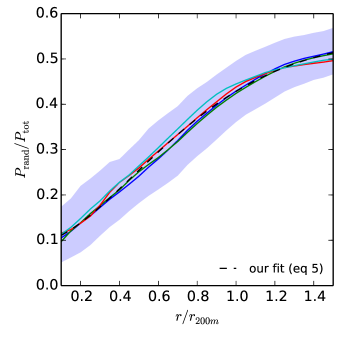
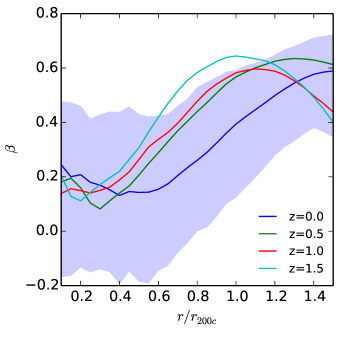
In Figure 1 we present the non-thermal pressure fraction profile, , averaged for our cluster sample at four redshifts . In the two panels we show the evolution of the profiles normalized using two different halo radii and on the left and right, respectively. The shaded regions depict the 1- scatter around the mean for . The scatter is comparable at all redshifts and has been omitted for clarity. For , there is a strong redshift evolution of both the shape and normalization of . At low redshift, the non-thermal pressure fraction is in the inner regions of the clusters, increasing up to outside of . At higher redshift, the non-thermal pressure systematically constitutes a larger fraction of the total pressure support in the systems. Moreover, the profile increases with radius more rapidly, reaching up to of the total pressure at at , twice the fraction at .
In the right panel, we again show the redshift evolution of , however, this time normalizing the profiles using the halo radius . When the halo radius is defined with the mean background density of the universe, the radial dependence of remains, with non-thermal pressure support in the core rising steadily to where the pressure fraction flattens out to pressure support in the cluster outskirts. However, the very strong redshift dependence seen using as the halo radius has completely disappeared. The universality we find in our non-thermal pressure fraction is in agreement with the very weak redshift dependence Battaglia et al. (2012) show in their non-thermal pressure fraction profile, also scaled with .
The simple reason behind this universality with is that the non-thermal pressure fraction is sensitive to the mass accretion rate of the clusters. The rate at which mass is accreting depends on the physical density contrast between the halo and the mean background density, precisely the quantity used in the definition of . We will provide a more detailed explanation of this redshift universality in our follow-up paper.
4.2. Dependence on Mass and Mass Accretion Rate
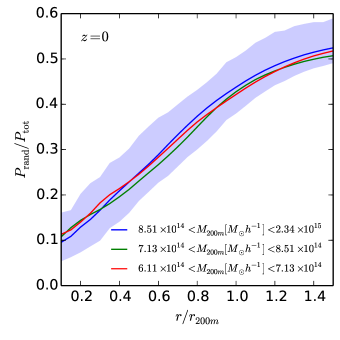
In order to characterize the scatter in the non-thermal pressure fraction profile, we examine the mass and dynamical state dependence of the profile. In Figure 2, we divide the sample into three equal sized mass bins at = 0, shown in red, green and blue from lowest mass to highest mass subsamples, respectively. We find no systematic dependence on mass in the profile. However, it is worth noting that our sample only encompasses the massive end of the cluster population with or correspondingly.
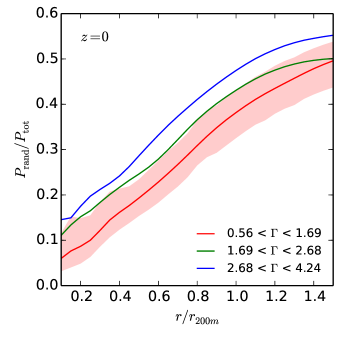
In the left panel of Figure 3, we investigate the dynamical state dependence of the non-thermal pressure fraction at . The mean profiles are shown for three equal sized bins, shown in red, green, and blue lines from the most slowly to most rapidly accreting systems, respectively. The high subsample has systematically higher non-thermal pressure fraction at all radii by than the most slowly accreting subsample. This is consistent with previous works which also find significantly larger fractions of non-thermal pressure in merging or unrelaxed systems (Vazza et al., 2011; Nelson et al., 2012). Given the small mass dependence seen in Figure 2, the small amount of scatter in the profile in Figure 1 is likely dominated by the range of dynamical states of the clusters in the sample. Note, however, that the main differences are in the amplitude of the non-thermal pressure fraction, and we see very little change in the slope of the profile.

4.3. Velocity Anisotropy
In our definition of in Equation (5), we assume the gas velocities in the galaxy clusters are isotropic. In this section we explore the relative importance of the radial and tangential components in the non-thermal pressure fraction by examining the velocity anisotropy parameter ,
| (6) |
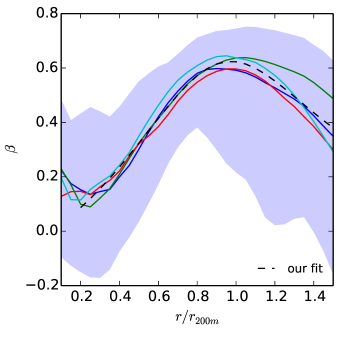
where a positive (negative) value of indicates more radial (tangential) motion. In Figure 4, we examine the redshift evolution of the anisotropy with the cluster radius scaled with respect to (left panel) and (right panel). Similar to the profile, the profile scaled with respect to critical density shows significant redshift dependence. The profile scaled with respect to mean matter density, on the other hand, shows universality across the radial range of . The gas velocities are slightly radial in the inner regions (e.g., at ) and becomes increasingly radial, reaching around .
In the cluster outskirts, the anisotropy decreases as the gas motions become more isotropic again. The apparent drop in is partly due to our definition of the velocity anisotropy in Equation (6), in which we neglected the contributions from coherent motions in both radial and tangential directions. At large radii, there is a coherent radial motion toward the cluster center (e.g., see Figure 1 in Lau et al., 2009), causing (representing the random radial motions) and hence to decrease with radius.
4.4. Fitting Formulae
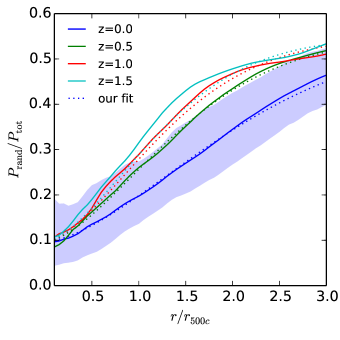
In this section, we provide fitting formulae for the universal non-thermal pressure fraction and gas velocity anisotropy profiles discussed in the previous sections. By using for the halo radius, our universal non-thermal pressure profile is well-described by the following fitting formula,
| (7) |
where the best fit parameters are , , and . This formula provides a good description of the mean profile with the accuracy of about in the radial range of out to . The best fit line is plotted in the right panel of Figure 1. In the Appendix, we also supply the adjusted fitting formula for the scaling of radii with respect to critical. Despite using , we are still able to provide an accurate fit out to , since the formula is based on the universal profile.
As shown in the left panel of Figure 3, the varied mass accretion histories of the clusters in our sample is a major source of scatter in the non-thermal pressure fraction profile. To account for the mass accretion rate, we provide a correction factor for the normalization of our fitting formula at using as a parameter,
| (8) |
where we keep our best fit parameters and obtained earlier by fitting in the radial range of . We use the best fit (Equation (7)) values for the profiles of each of the 65 clusters in our sample, with and fixed at our best fit values, to determine the function of . In the right panel of Figure 3, we show the same three bins as in the left panel but renormalized using Equation (8), fit using the mean value in each bin respectively. While there is some residual variation in the slope of the profile for different mass accretion bins, including this normalization correction factor decreases the scatter at from to , leading to 1- agreement between the adjusted profiles.
Previous attempts to characterize the non-thermal pressure fraction have used the (or ) as the cluster radius and therefore have included an additional factors to account for its strong redshift evolution (Shaw et al., 2010) and mass dependence (Battaglia et al., 2012). We have confirmed that the profiles for our data are well fit by their fitting formulae at in Appendix A.
Lastly, we provide a fitting formula for the universal gas velocity anisotropy profile shown in the right panel of Figure 4. We adopt the following fitting formula,
| (9) |
fit between , where the best fit parameters are , , and . The profile is well fit with the accuracy of about 20% between out to , with the exception of , which is only a robust fit for .
5. Summary and Discussion
In this work we presented the redshift and mass independent non-thermal pressure fraction profile using a mass-limited, cosmologically representative sample of 65 massive galaxy clusters from a high resolution hydrodynamical cosmological simulation. This result is relevant in accounting for the systematic effects of non-thermal pressure on X-ray and microwave measurements of galaxy clusters and cosmological inferences based on these measurements.
We found that the mean non-thermal pressure fraction profile exhibits remarkable universality in redshift and mass when we define the size of cluster halos using the mean matter density of the universe, instead of the critical density. However, we also showed that there is strong dependence in the non-thermal pressure fraction profile on the halo’s mass accretion rate: clusters that are rapidly accreting have an overall higher non-thermal pressure fraction. As such, the mass accretion rate is a major source of systematic scatter in the mean non-thermal pressure fraction profile.
A robust and quantitative proxy for measuring mass accretion rate is therefore needed to account for this effect, especially with the upcoming multi-wavelength cluster surveys where statistical errors will be considerably smaller than systematic uncertainties arising from our ignorance of cluster astrophysics. We note that the current method of characterizing the mass accretion rate using the fractional mass increase between and is by no means unique, and can only be applied to clusters. Future work should focus on developing quantitative measures of the mass accretion rate of halos that can be applied to halos across a wide range of redshifts, and relate these measures to observable proxies of the dynamical states of clusters.
We found no systematic mass dependence in the universal non-thermal pressure fraction profile. But given that our sample contains only massive clusters, the independence in mass should be checked with sample of lower mass halos. Since slowly accreting halos have smaller non-thermal pressure fraction, we expect that lower mass groups and galaxies, which should experience less physical mass accretion than high mass clusters, to have lower non-thermal pressure fraction profile. However, we note that smaller mass halos are more susceptible to non-gravitational physics (such as gas cooling and energy injections from stars and active galactic nuclei) which can influence the net accretion rate into and within the halos in a non-trivial way.
We found that the gas velocity is predominantly radial, with the velocity anisotropy parameter increasing from to from to . Moreover, we found that the velocity anisotropy profile is also universal across redshift when halos are defined using the mean matter density, indicating that gas velocity anisotropy is also a self-similar quantity. This result can be useful since the velocity anisotropy cannot be easily measured in observations, as we can only measure line-of-sight velocities from Doppler width measurements, e.g., with the upcoming ASTRO-H in the near future. Measurements of gas motions tangential to the line-of-sight are possible with resonant scattering but difficult (e.g., Zhuravleva et al., 2011).
We provided fitting formulae for the universal non-thermal pressure fraction and gas velocity anisotropy profiles that work remarkably well within and out to redshift . One application of our fitting formulas is the recovery of total mass of relaxed clusters by accounting for the hydrostatic mass bias. The effect of velocity anisotropy should be included in the mass recovery, since the formalism for the full mass recovery depends on the relative contribution of the radial and tangential components of the non-thermal pressure (Rasia et al., 2004; Lau et al., 2009). We note that while non-thermal pressure motions due to random gas motions are not the only contribution to the hydrostatic mass bias, the other mass terms due to coherent gas rotation and radial gas acceleration contribute typically only a few percent to the total mass bias, and as such are subdominant to the non-thermal pressure due to gas motions (Suto et al., 2013; Lau et al., 2013). Another application of the fitting formula is the assessment of systematic uncertainties in the thermal SZ power spectrum due to non-thermal pressure. The universal, redshift independent profile provided here should make the implementation of non-thermal pressure support in the modeling of the thermal SZ power spectrum robust and straightforward.
While our current simulation does not include radiative cooling, star formation or energy feedback from stars and/or active galactic nuclei, we have examined the effect of these additional physics on the non-thermal pressure fraction and gas velocity anisotropy in group and cluster size halos taken from Nagai et al. (2007a) and found no systematic dependence on gas physics in the radial range of . We note, however, that our simulation does not model plasma effects which can amplify gas turbulence and provide extra non-thermal pressure support (e.g., Parrish et al., 2012). Physical viscosity, on the other hand, can decrease the level of gas turbulence which lowers the non-thermal pressure support. The results presented in this paper based on hydrodynamical simulations serve as baseline for further studies of these effects. Magnetic fields and cosmic rays can also provide additional non-thermal pressure (e.g., Laganá et al., 2010). However, their contributions are expected to be small. The typical magnetic field strength of in the ICM corresponds to magnetic pressure fraction of . Similarly, the ratio of the cosmic ray pressure to total pressure is constrained to , set by the -ray observations of Fermi-LAT (Fermi-LAT Collaboration, 2013). It is important to note, however, that the constraints on the contribution from cosmic rays assume that the cosmic ray distribution follows that of the thermal ICM and, therefore, a flattened distribution of cosmic rays could result in an increased contribution to the ICM energy (e.g., Zandanel & Ando, 2014)
The upcoming ASTRO-H mission will measure gas motions in galaxy clusters and should provide observational constraints on the level of the non-thermal pressure fraction in these systems. However, the observational constraints will be limited to inner regions () of nearby massive clusters, due to the lack of sensitivities in low-density regions in cluster outskirts. Extending these measurements to the outskirts or high-redshift clusters must await the next generation of X-ray missions, such as SMART-X333http://smart-x.cfa.harvard.edu/ and/or Athena+444http://athena2.irap.omp.eu/. Alternatively, kinematic SZ effect can probe internal gas motions of electrons in galaxy clusters (Inogamov & Sunyaev, 2003; Nagai et al., 2003). Since the SZ signal is independent of redshift and linearly proportional to gas density (unlike X-ray emission which is proportional to gas density squared), measurements of the kSZ effect with high-resolution, multifrequency radio telescopes, such as CCAT555http://www.ccatobservatory.org, might enable characterization of the non-thermal pressure in the outer regions of high-redshift clusters.
Previous works have used the definition of cluster mass normalized with respect to the critical density of the universe. In this work, we argue that an alternative definition based on the mean mass density of the universe is a preferred choice for the non-thermal pressure profile as well as velocity anisotropy of gas in clusters. It would be interesting to check whether other gas properties exhibit similar universality when the cluster profiles are normalized with respect to the mean mass density. We will investigate these issues in our next paper and explore their implications for understanding the evolution cluster gas structure and their application to cosmology.
References
- Allen et al. (2011) Allen, S. W., Evrard, A. E., & Mantz, A. B. 2011, ARA&A, 49, 409
- Applegate et al. (2014) Applegate, D. E., von der Linden, A., Kelly, P. L., et al. 2014, MNRAS, 439, 48
- Battaglia et al. (2012) Battaglia, N., Bond, J. R., Pfrommer, C., & Sievers, J. L. 2012, ApJ, 758, 74
- Battaglia et al. (2010) Battaglia, N., Bond, J. R., Pfrommer, C., Sievers, J. L., & Sijacki, D. 2010, ApJ, 725, 91
- Bhattacharya et al. (2013) Bhattacharya, S., Habib, S., Heitmann, K., & Vikhlinin, A. 2013, ApJ, 766, 32
- Bhattacharya et al. (2012) Bhattacharya, S., Nagai, D., Shaw, L., Crawford, T., & Holder, G. P. 2012, ApJ, 760, 5
- Bryan & Norman (1998) Bryan, G. L., & Norman, M. L. 1998, ApJ, 1, 80
- Diemer & Kravtsov (2014) Diemer, B., & Kravtsov, A. V. 2014, ApJ, in press, arXiv:1401.1216
- Diemer et al. (2013) Diemer, B., More, S., & Kravtsov, A. V. 2013, ApJ, 766, 25
- Fermi-LAT Collaboration (2013) Fermi-LAT Collaboration. 2013, ApJ, in press, arXiv:1308.5654
- Evrard et al. (1996) Evrard, A. E., Metzler, C. A., & Navarro, J. F. 1996, ApJ, 469, 494
- Hill & Sherwin (2013) Hill, J. C., & Sherwin, B. D. 2013, Phys. Rev. D, 87, 023527
- Hu & Kravtsov (2003) Hu, W., & Kravtsov, A. V. 2003, ApJ, 584, 702
- Inogamov & Sunyaev (2003) Inogamov, N. A., & Sunyaev, R. A. 2003, Astron. Lett., 29, 791
- Klypin et al. (2001) Klypin, A., Kravtsov, A. V., Bullock, J. S., & Primack, J. R. 2001, ApJ, 554, 903
- Komatsu & Seljak (2002) Komatsu, E., & Seljak, U. 2002, MNRAS, 336, 1256
- Kravtsov (1999) Kravtsov, A. V. 1999, PhD thesis, New Mexico State Univ.
- Kravtsov et al. (2002) Kravtsov, A. V., Klypin, A., & Hoffman, Y. 2002, ApJ, 571, 563
- Laganá et al. (2010) Laganá, T. F., de Souza, R. S., & Keller, G. R. 2010, A&A, 510, A76
- Lau et al. (2009) Lau, E. T., Kravtsov, A. V., & Nagai, D. 2009, ApJ, 705, 1129
- Lau et al. (2013) Lau, E. T., Nagai, D., & Nelson, K. 2013, ApJ, 777, 151
- Mahdavi et al. (2013) Mahdavi, A., Hoekstra, H., Babul, A., et al. 2013, ApJ, 767, 116
- Nagai et al. (2003) Nagai, D., Kravtsov, A. V., & Kosowsky, A. 2003, ApJ, 587, 524
- Nagai et al. (2007a) Nagai, D., Kravtsov, A. V., & Vikhlinin, A. 2007a, ApJ, 668, 1
- Nagai et al. (2007b) Nagai, D., Vikhlinin, A., & Kravtsov, A. V. 2007b, ApJ, 655, 98
- Nelson et al. (2014) Nelson, K., Lau, E. T., Nagai, D., Rudd, D. H., & Yu, L. 2014, ApJ, 782, 107
- Nelson et al. (2012) Nelson, K., Rudd, D. H., Shaw, L., & Nagai, D. 2012, ApJ, 751, 121
- Parrish et al. (2012) Parrish, I. J., McCourt, M., Quataert, E., & Sharma, P. 2012, MNRAS, 419, L29
- Piffaretti & Valdarnini (2008) Piffaretti, R., & Valdarnini, R. 2008, A&A, 491, 71
- Rasia et al. (2004) Rasia, E., Tormen, G., & Moscardini, L. 2004, MNRAS, 351, 237
- Rasia et al. (2006) Rasia, E., Ettori, S., Moscardini, L., et al. 2006, MNRAS, 369, 2013
- Rudd et al. (2008) Rudd, D. H., Zentner, A. R., & Kravtsov, A. V. 2008, ApJ, 672, 19
- Shaw et al. (2010) Shaw, L. D., Nagai, D., Bhattacharya, S., & Lau, E. T. 2010, ApJ, 725, 1452
- Shi & Komatsu (2014) Shi, X., & Komatsu, E. 2014, MNRAS, submitted, arXiv:1401.7657
- Suto et al. (2013) Suto, D., Kawahara, H., Kitayama, T., et al. 2013, ApJ, 767, 79
- Takahashi et al. (2010) Takahashi, T., Mitsuda, K., Kelley, R., et al. 2010, in Society of Photo-Optical Instrumentation Engineers (SPIE) Conference Series, ed. M. Arnaud, S. S. Murray, & T. Takahashi, Vol. 7732, 77320Z, arXiv:1010.4972
- Tinker et al. (2008) Tinker, J., Kravtsov, A. V., Klypin, A., et al. 2008, ApJ, 688, 709
- Trac et al. (2011) Trac, H., Bode, P., & Ostriker, J. P. 2011, ApJ, 727, 94
- Vazza et al. (2011) Vazza, F., Brunetti, G., Gheller, C., Brunino, R., & Brüggen, M. 2011, A&A, 529, A17
- von der Linden et al. (2014) von der Linden, A., Mantz, A., Allen, S. W., et al. 2014, MNRAS, submitted, arXiv:1402.2670
- Zandanel & Ando (2014) Zandanel, F., & Ando, S. 2014, MNRAS, 440, 663
- Zhang et al. (2010) Zhang, Y.-Y., Okabe, N., Finoguenov, A., et al. 2010, ApJ, 711, 1033
- Zhuravleva et al. (2013) Zhuravleva, I., Churazov, E., Kravtsov, A., et al. 2013, MNRAS, 428, 3274
- Zhuravleva et al. (2011) Zhuravleva, I. V., Churazov, E. M., Sazonov, S. Y., Sunyaev, R. A., & Dolag, K. 2011, Astron. Lett., 37, 141
Appendix A A. Fitting the Non-thermal Pressure Fraction Profile with Respect to Critical Density
To date, it has been common to use the critical density to define the radius and mass of galaxy clusters. We therefore provide a conversion for our fitting formula for the universal non-thermal pressure profile defined respect to the mean mass density of the universe, so that it can easily be used with alternative definitions of halos’ radius and mass based on the critical density. This conversion method is adapted from Appendix C in Hu & Kravtsov (2003). The converted fitting formula is expressed as
| (A1) |
where , , and are the best fit parameters given in Section 4.4. The conversion factor is given by
| (A2) |
where is the concentration parameter, and
| (A3) | ||||
| (A4) |
Here is the chosen overdensity with respect to the critical density of the universe, is the normalized Hubble parameter for a flat cosmology, and , , and .
In left panel of Figure 5, we show how our fitting formula recovers the non-thermal pressure fraction measured from simulations at four different redshifts, . To convert between and we use the mean concentration at each redshift bin as calculated from concentration-mass relation in Bhattacharya et al. (2013). We find excellent agreement between our fit and our data in the redshift range of . At our conversion underestimates the true profile out to 2.
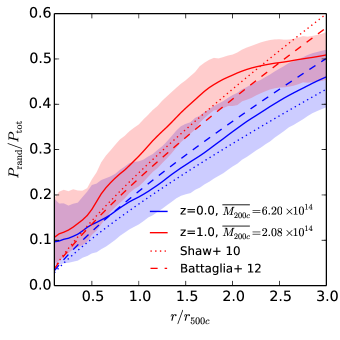
Previous attempts to describe the non-thermal pressure profile used the scale radius . In right panel of Figure 5 we compare our sample to the fitting formula from Battaglia et al. (2012) (dashed line) and Shaw et al. (2010) (dotted line) at two redshifts, and , shown in the blue and red lines, respectively. The Shaw et al. (2010) fitting formula slightly underestimates our results at . At , the fit has approximately the same slope as ours between and , but underestimates the pressure fraction slightly at and overestimates the fraction at the larger radii. The deviation in Shaw et al. (2010) is likely due to the fact that their cluster sample was small (only 16) and heterogeneous. The Battaglia et al. (2012) fitting formula adopts the redshift dependence from Shaw et al. (2010) and adds an additional factor to account for the mass dependence which they calibrate using a larger sample of simulated clusters at . At , this additional factor results in a slight overestimate of the non-thermal pressure fraction out to . At , their fit shows the same redshift dependence as Shaw et al. (2010), but with a lower normalization due to the mass dependence factor, which was only calibrated at .
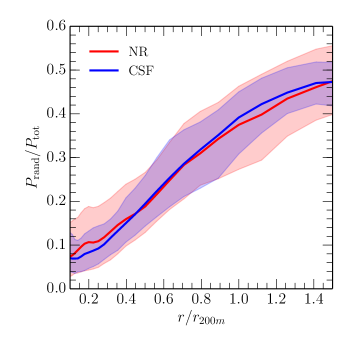
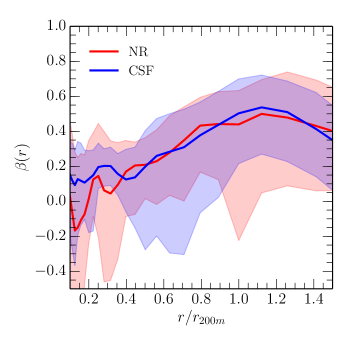
Appendix B B. Effects of Dissipative Physics on the Non-thermal Pressure Fraction and Gas Velocity Anisotropy
In this section we examine the effect of dissipative physics on the non-thermal pressure fraction and gas velocity anisotropy in group and cluster sized systems. We compare profiles for the set of 16 clusters from Nagai et al. (2007a), simulated with two different gas physics: non-radiative (NR) physics; and with radiative cooling, star formation, and supernova feedback (CSF). In Figure 6 we show the mean profiles of the non-thermal pressure fraction and the gas velocity anisotropy for the clusters at . There is no systematic dependence on gas physics in the radial range of . The profiles between the two runs are consistent between each other within 1-. The addition of dissipative physics has little effect on both the non-thermal pressure fraction and the gas velocity anisotropy in this radial range.