The formation of the W43 complex: constraining its atomic-to-molecular transition and searching for colliding clouds
Abstract
Context. Numerical simulations have explored the possibility to form molecular clouds through either a quasi-static, self-gravitating mechanism or the collision of gas streams or lower-density clouds. They also quantitatively predict the distribution of matter at the transition from atomic to molecular gases.
Aims. We aim to observationally test these models by studying the environment of W43, a molecular cloud complex recently identified near the tip of the Galactic long bar.
Methods. Using Galaxy-wide H I and 12CO 1–0 surveys we searched for gas flowing toward the W43 molecular cloud complex. We also estimated the H I and H2 mass surface densities to constrain the transition from atomic to molecular gas around and within W43.
Results. We found three cloud ensembles within the position-velocity diagrams of 12CO and H I gases. They are separated by 20 along the line of sight and extend into the 13CO velocity structure of W43. Since their velocity gradients are consistent with free-fall, they could be nearby clouds attracted by, and streaming toward, the W43 10 potential well. We show that the H I surface density, pc-2, does not reach any threshold level but increases when entering the 130 pc-wide molecular complex previously defined. This suggests that an equilibrium between H2 formation and photodissociation has not yet been reached. The H2-to-H I ratio measured over the W43 region and its surroundings, , is high, indicating that most of the gas is already in molecular form in W43 and in structures several hundreds of parsecs downstream along the Scutum-Centaurus arm.
Conclusions. The W43 molecular cloud complex may have formed, and in fact may still be accreting mass from the agglomeration of clouds. Already in the molecular-dominated regime, most of these clouds are streaming from the Scutum-Centaurus arm. This is in clear disagreement with quasi-static and steady-state models of molecular cloud formation.
Key Words.:
ISM: atoms, ISM: clouds, ISM: evolution, ISM: individual (W43), ISM: structure, stars: formation1 Introduction
The term ‘converging flows’, although applicable to all mechanisms of cloud formation, generally refers to the convergence of H I streams that can naturally be driven by local instabilities in the disk such as those due to gravity, supernova explosions, or spiral shocks (e.g. Koyama & Inutsuka 2000; Heitsch et al. 2005; Vázquez-Semadeni et al. 2007). For the past decade, numerical models have investigated the capability of such colliding flows (Warm Neutral Medium, K) to form cold structures (Cold Neutral Medium, 70 K) through shocks (e.g. Vázquez-Semadeni et al. 1996; Hennebelle & Pérault 1999; Ballesteros-Paredes et al. 1999). However, it is only recently that 3D models have simulated the thermal transition from the atomic to the molecular phase (H I H2) with realistic heating and cooling functions (e.g. Audit & Hennebelle 2005; Glover & Mac Low 2007). Several groups aim at studying in detail the formation of molecular clouds with sufficient resolution to model star formation. Recent 3D numerical simulations now include gravity, magnetic fields, thermal and dynamical instabilities (e.g. Banerjee et al. 2009; Hartmann et al. 2012) and in some cases treat the chemical evolution of the gas (Heitsch & Hartmann 2008; Clark et al. 2012; Inoue & Inutsuka 2012).
Massive giant molecular clouds, or cloud complexes, may alternatively form from the collision/agglomeration of clouds (e.g. Blitz & Shu 1980; Dobbs 2008). Clouds are higher density and more structured media than diffuse H I streams, and so they are mainly composed of cold H I and H2 gas. Cloud-cloud collisions are expected to be the dominant phenomenon in high-density regions of galaxies (e.g. Dobbs 2008) as well as during the late-stage evolution of molecular clouds formed through H I converging flows (e.g. Vázquez-Semadeni et al. 2010). Several groups are studying the formation, evolution, and disruption of massive clouds by spiral waves, bar potentials, and satellite galaxies with hydrodynamic simulations of galaxies able to resolve molecular clouds (e.g. Bournaud et al. 2010; Dobbs & Pringle 2013).
Both colliding flows and cloud-cloud collisions naturally explain the observed rapid onset of star formation once the cloud has formed, which has proven problematic in the past ( yr, Ballesteros-Paredes et al. 1999; Hartmann et al. 2001; Roman-Duval et al. 2009). In these scenarios, molecular clouds are never in a kinematic equilibrium state, as part of the cloud collapses while part of it disperses. A few models have described the formation of molecular clouds by assuming equilibrium between the formation of H2 molecules and their photodissociation (e.g. Andersson & Wannier 1993; Krumholz et al. 2009). In short, these authors applied a simplified version of the chemical modeling of photodissociation regions (e.g. van Dishoeck & Black 1986) to a spherical geometry. However, such an equilibrium may never be reached since its timescale should be yr or even longer (Mac Low & Glover 2012). Non steady-state models have been developed using turbulence and/or colliding streams to enhance and accelerate the formation of H2 molecules behind shocks (e.g. Heitsch et al. 2008; Hennebelle et al. 2008; Koyama & Inutsuka 2000; Clark et al. 2012). These two families of models make different predictions, for the conversion of H I into H2, especially in terms of the lifetime of the process and the mixing of the H2 and H I gases. Indeed, steady-state models assume that an equilibrium between the H I and H2 formation/destruction is rapidly reached. The H I and H2 gases are also assumed to be mutually exclusive, with a sharp transition from H I to H2-dominated media when entering the cloud (e.g Krumholz et al. 2009). As a consequence, equilibrium models predict the existence of a threshold for the atomic gas surface density, at pc-2 for solar metallicity gas according to Krumholz et al. (2009). In contrast, non-steady state models start with an accumulation of H I gas that translates into a mass surface density above this classical threshold. The H2 formation rate, high at the beginning of the molecular cloud formation process, continuously slows down as the cloud becomes fully molecular (e.g. Clark et al. 2012). The H I surface density thus decreases over time, first sharply, then slower and slower, eventually reaching this equilibrium state.
W43 should be a perfect testbed to investigate the formation of molecular clouds and star formation in the framework of dynamical scenarios. At only 5.5 kpc from us, W43 is among the most extreme molecular cloud complexes of the Milky Way (Nguyen Luong et al. 2011b; Zhang et al. 2014). It is massive, 111 The mass and diameter values given in Nguyen Luong et al. (2011b) have been recalculated to account for the refinement of W43 distance, from 6 kpc to 5.5 kpc, by Zhang et al. (2014). within an equivalent diameter of 130 pc, and is highly concentrated into dense star-forming sites (Nguyen Luong et al. 2011b). Despite a velocity dispersion FWHM of , the W43 molecular cloud complex is a coherent and gravitationally bound ensemble of clouds. Moreover, W43 has the potential to form starburst clusters in the near future (SFR, Nguyen Luong et al. 2011b; Louvet et al. 2014). Its densest parts correspond to the Galactic mini-starburst cloud W43-Main (Motte et al. 2003) recently mapped by the Herschel/Hi-GAL and HOBYS key programs (Molinari et al. 2010; Motte et al. 2010). Nguyen-Luong et al. (2013) identified within W43-Main two dense filamentary clouds categorized as ridges following the definition of Hill et al. (2011) and Hennemann et al. (2012). In short, ridges are elongated clouds with very high column density, , over several squared parsecs (see also Nguyen Luong et al. 2011a; Motte et al. 2012). Nguyen-Luong et al. (2013) proposed and Louvet et al. (2014) showed that the W43-MM1 and W43-MM2 ridges are progenitors of young massive clusters. W43 is located near the meeting point of the Scutum-Centaurus (or Scutum-Crux) Galactic arm and the Galactic long bar, a dynamically complex region where collisions are expected (Nguyen Luong et al. 2011b; Carlhoff et al. 2013). Several massive stellar associations, called red supergiant clusters, have also been identified in the neighborhood of W43 (see González-Fernández et al. 2012, and references therein).
In this paper, we attempt to trace back the formation of molecular clouds in the W43 complex. Employing the database described in Sect. 2, we look for gas streams and cloud ensembles at the outskirts of the atomic and molecular complex and characterize its atomic envelope (see Sect. 3). Section 4 follows the transition from atomic to molecular media and discusses the collision probability of gas streams and clouds. Finally, Sect. 5 concludes that the equilibrium relations of the H I into H2 transition do not apply in W43 and that this extreme cloud complex may have been created by the collision of molecular clouds.
2 Observations
The atomic gas data for W43 are taken from the Very Large Array (VLA) Galactic Plane Survey (VGPS222 The full spectral cubes of the VGPS database are available as fits files at http://www.ras.ucalgary.ca/VGPS/. The VLA and GBT are facilities of the National Radio Astronomy Observatory., Stil et al. 2006). VGPS is a survey of the 21 cm continuum and line emission from neutral atomic hydrogen, H I, performed throughout the Galactic plane (, ) by the VLA and combined with short-spacing information obtained with the Green Bank Telescope (GBT). This data set has a spatial resolution of and a velocity resolution of spanning the range -120 to .
To trace the low-density molecular gas, we used the 12CO 1–0 data from the Galactic plane survey made with the CfA 1.2 m telescope333 The CfA telescope is the 1.2 mm Millimeter-Wave Telescope at the Center for Astrophysics, Harvard University. (Dame et al. 2001). These data have a spatial resolution of and a velocity resolution of spanning the velocity range -0.5 to . Note that 13CO data of e.g. the GRS survey (Jackson et al. 2006) trace higher density gas than 12CO and are thus less relevant for our study of the transition from atomic to molecular gas. The main characteristics of the data sets used here are listed in Table 1.
Low-density cloud structures surrounding the W43 complex as defined by Nguyen Luong et al. (2011b) are expected to display optically thin H I and 12CO lines. In contrast, these two lines should be self-absorbed toward the densest parts of W43. H I lines will also be absorbed by the continuum free-free emission of H II regions, seen as pointlike sources within the densest parts of W43.
| Survey | Frequency | HPBW | 1 rms | |
|---|---|---|---|---|
| Tracer | [GHz] | [″] | [] | [K ] |
| VGPSH I | 1.420 | 60 | 1.56 | 1.80 |
| CfA12CO 1–0 | 115.271 | 450 | 0.65 | 0.22 |
3 Results and analysis
Here we discuss the velocity range covered by the 12CO and H I envelope of W43 (see Sect. 3.1), characterize the H I envelope of W43 (see Sect. 3.2), and search for signatures of colliding flows or clouds (see Sect. 3.3).
3.1 Velocity range of the 12CO/H I envelope of W43
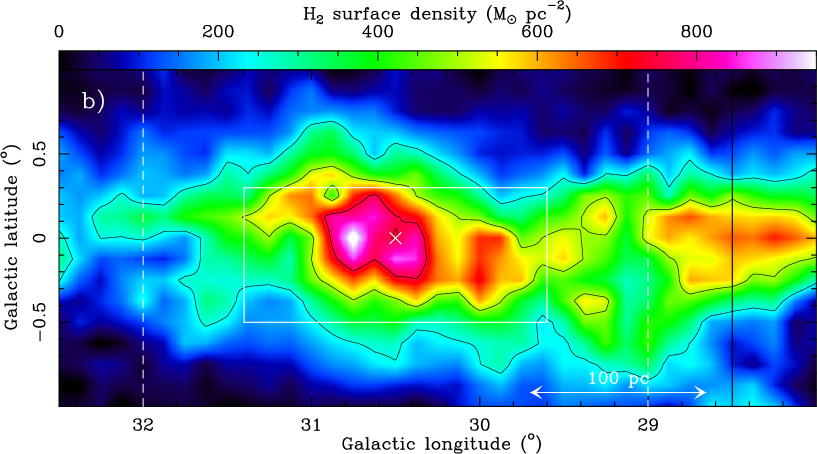
Figure 1 displays the shape of the H I lines of Table 1 summed over areas covering the W43 molecular complex, its 12CO/H I envelope, and the combination of the two. According to Nguyen Luong et al. (2011b), the W43 molecular cloud complex extends in Galactic longitude from to and in Galactic latitude from to . If the 12CO/H I envelope of the complex is also included, the combined region extends from to and . The corresponding areas are outlined in Fig. 2 as white and white-dashed rectangles, and lines integrated over these areas are displayed in Fig. 1 as green and red curves, respectively. Comparison of the H I and 12CO spectra shown in Fig. 1 with the 13CO spectra discussed by Carlhoff et al. (2013) situates the velocity components in the foreground of W43 (mostly within the Sagittarius arm) and the - components in its background. A complete disentangling of CO velocity components in the foreground and background of W43 can be found in Carlhoff et al. (2013, see especially their Fig. 5).
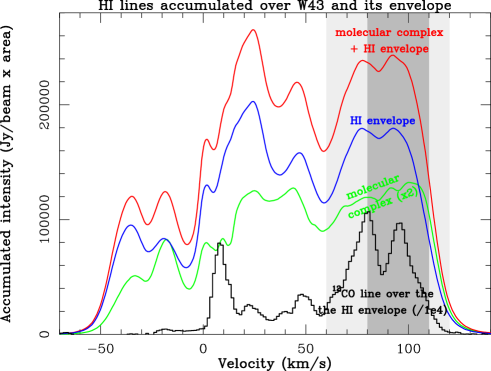
In Fig. 1, the 12CO and H I lines of Table 1, observed toward W43 (green curve) and its surrounding envelope (blue curve) are broad and structured. They happen to be rather well delimited by the 60 and velocities, marking out the the so-called ‘complete velocity range’ of W43. We recall that two velocity ranges have been defined for W43 using 13CO 1–0 data from the GRS survey (Jackson et al. 2006) and the higher-resolution 13CO 2–1 image of the W43-HERO444 The W43-HERO (W43 Hera/EmiR Observation) project is an IRAM 30 m large program, whose description and data can be accessed at: http://www.iram-institute.org/EN/content-page-292-7-158-240-292-0.html large program (Nguyen Luong et al. 2011b; Carlhoff et al. 2013). The main velocity range () traces the central part of the 13CO cloud while the complete range ( ) also includes peripheral lower-density clouds. Since the H I and 12CO 1–0 lines trace lower density gas than 13CO, the velocity range over which they are detected is generally larger.
The H I lines of the envelope surrounding W43 (blue curve) sum up in the range of Fig. 1 into two main velocity components, leading to a combined FWHM. These two velocity peaks are also observed in the 12CO 1–0 line arising from the envelope of W43 (black histogram) and so do not appear to be due to H I self-absorption. Indeed, the shape of H I and CO lines at the highest positive and negative latitudes of the VGPS and CfA data, at , are as complicated as the spectra displayed in Fig 1. The variation of the line shapes when entering the envelope of W43 or W43 itself also do not suggest that they gradually become optically thick. These line shapes provide some evidence that the H I line is optically thin throughout the envelope of W43 and that at least some of the emission from the W43 complex itself is also optically thin. However, this still needs to be confirmed, and will be quantified using a higher-resolution H I emission map with the VLA as well as H I absorption measurements toward radio sources (Bihr et al., in prep.). Assuming that the H I line shape observed for the H I envelope also applies to the W43 molecular complex, one can make a crude estimate of the optical thickness of H I in W43. The lines observed in Fig. 1 display a similar shape over a wide range of velocities, suggesting that the total H I flux integrated over the area of W43 is globally underestimated, but by no more than 20%. Section 3.2 and Fig. 7 more precisely indicate the extent of the W43 central region where the H I line is largely optically thick. Given the above results, we interpret the complicated shape of the H I and 12CO lines of Fig. 1 as reflecting the complex velocity pattern of the W43 region rather than optical thickness. As further discussed in Sect. 3.3 and illustrated in Figs. 3-5, the two velocity peaks observed in Fig. 1 correspond to 12CO/H I cloud ensembles at different velocities.
In the following, we integrate all lines over the velocity range. With a smaller integration range, the velocity investigations and comparison of the H I and H2 surface densities made in Sects. 3.3 and 4 are qualitatively unchanged. As for the absolute values of the 12CO and H I integrated intensities and thus the H2 and H I gas masses, they only decrease by 30% and 40%, respectively, for a integration range.
3.2 A clear H I envelope around W43
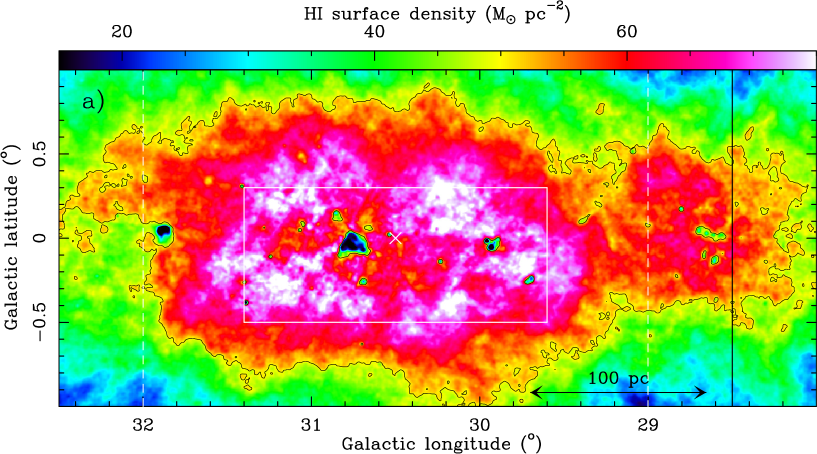
Figure 2 displays the 12CO 1–0 and H I images of the W43 molecular complex and its surroundings, integrated over . The observed H I and 12CO structures correlate quite well along the Galactic plane, out to the outskirts of the W43 complex, which is outlined by a white rectangle: roughly at and . Conversely, the H I and 12CO are anti-correlated in the densest parts of the molecular complex. This corresponds to areas where the 12CO 1–0 brightness increases from 140 K to 200 K in Fig. 2 (i.e. within the seventh contour) while the H I emission decreases from 6000 K (pink ring in Fig. 2) down to 1000 K (blue pixels toward W43-Main). Figure 2 also confirms that the 12CO and H I gases are confined by the midplane pressure of the Milky Way with a width at half maximum of about and , respectively.
Observationally, H2 and H I are known to be intimately linked on all scales, from those of large molecular complexes (e.g. Blitz & Thaddeus 1980; Elmegreen & Elmegreen 1987) to the scales of individual filamentary clouds (e.g. Wannier et al. 1983; Ballesteros-Paredes et al. 1999). Position and velocity coincidences for H I and CO have been noted for various clouds and complexes (e.g. Blitz & Thaddeus 1980; Elmegreen & Elmegreen 1987). Halos of warm H I gas have been found, generally asymmetrically surrounding molecular structures, in the close outskirts of 10 pc filaments/clouds of the nearby Gould Belt clouds (see Wannier et al. 1983; Ballesteros-Paredes et al. 1999; Lee et al. 2012, and references therein). Similar asymmetrical halos were observed by Williams et al. (1995) for the high-mass star-forming molecular cloud complex Rosette and its filaments.
The H I envelope of the W43 molecular complex itself displays an elliptical shape that symmetrically surrounds the molecular complex (see Fig. 2 of the present paper and Fig. 8 of Nguyen Luong et al. 2011b). This envelope, with a median diameter of 270 pc, is far enough from the internal UV fields of the H II regions or OB clusters associated with W43 to feel little influence from them; they would otherwise distort its shape. It also lies far enough from the center of the complex to avoid regions where the cold H I gas co-mixed with molecular gas creates H I self-absorption features that could distort the H I envelope emission. Since the H I envelope has its center close to the Galactic plane, the Galactic interstellar radiation field bathing W43 is expected to be rather isotropic and able to create a symmetrical envelope. The powerful radiation field of RSGC3 could itself distort the W43 envelope at low Galactic longitude if it were not located a few hundred parsecs closer to the Galactic Center (see Fig. 2 and Sect. 4.5). Note that H I envelopes of molecular complexes centered on the Galactic plane are not always symmetric (Schneider, priv. com.). The large size and simple geometry of the W43 H I envelope is therefore rare (see, however, Andersson et al. 1992), making W43 an excellent laboratory to track the transition from the atomic to the molecular medium (see Sects. 4.1–4.2). It also suggests that other processes, such as the formation of molecular clouds in the W43 complex, could be invoked to explain its symmetry on large scales. As proposed in Sect. 4.4, gas could accumulate in front of the long bar and collide to form W43, allowing a symmetric distribution of its H I and H2 gases on hundred parcsec scales. Note that position offsets between H I and H2 are present at smaller scales, as mentioned in Sect. 3.3 below.
3.3 W43, at the meeting point of large-scale cloud ensembles
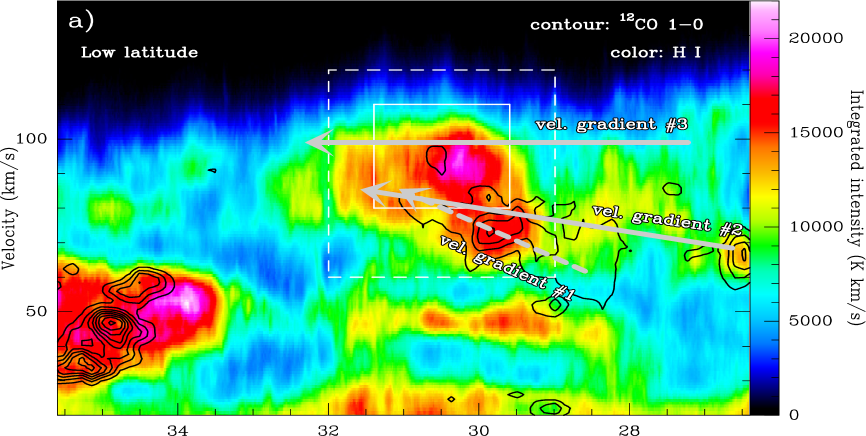
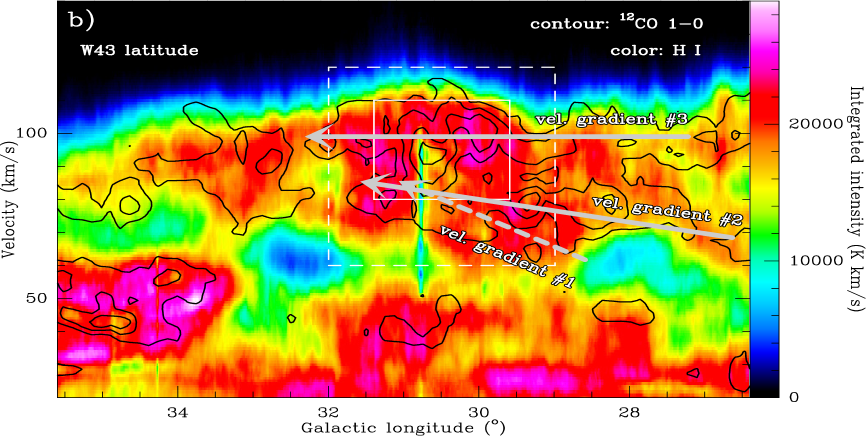
We further investigated the link between the H2 and H I gas in the W43 molecular complex and its surroundings by comparing the 12CO 1–0 CfA and H I VGPS datacubes. Figures 3-4 display the position-velocity diagrams of the W43 molecular complex and its 12CO/H I envelope (area outlined by a white dashed rectangle in Fig. 2) plotted against the Galactic latitude and longitude, respectively. According to the definition of Nguyen Luong et al. (2011b), we used longitude and latitude extents of to , , embracing the 12CO/H I envelope of the 13CO complex. Figures 5a-b complement our investigation of the H I and 12CO datacubes for two other latitude ranges. As in Sect. 3.2, we integrated the 12CO and H I lines over the velocity range.
In Fig. 3a, the 12CO emission displays two peaks within the white rectangle covering the W43 complex, one at 95 and another at 78 , recalling the two velocity peaks of Fig. 1. In addition, there is a component of lower density gas, located at more negative latitude (from to ) and at 75. This component remains prominent in the immediate surroundings of W43 and displays a gradient of 0.2 over 40 pc in the direction of increasing Galactic latitude (see Fig. 3b). This component is associated with a 12CO velocity gradient of 0.1 over 400 pc in the direction of increasing longitude (see Fig. 5a and Fig. 4). It is hereafter labelled as cloud ensemble #1 (see also Figs. 3-5). When approaching the location of W43, the velocity of cloud ensemble #1 becomes closer to the main velocity range of W43. The 12CO dispersion in velocity also becomes narrower (see Figs. 3b and 5a), suggesting that it could be subject to the increasing gravitational influence of W43. This negative latitude component is associated with enhanced H I emission (see Fig. 3b) though the velocity gradients, suggested by the 12CO position-velocity diagrams, are generally not as clearly defined in the H I position-velocity diagrams.
Two other 12CO cloud ensembles, labelled #2 and #3, appear to extend in the direction of increasing Galactic longitude (see Figs. 4 and 5b). They correspond to the two main peaks of the latitude-velocity diagram integrated over the longitude range (see Fig. 3b) and the two line components observed in the range for both H I and 12CO (see Fig. 1). The comparison of Figs. 5a and 5b shows that they are mostly confined within the latitude range of the W43 molecular complex (from to ) and inspection of Fig. 4 shows that they almost disappear in the longitude range. The velocity gradients of these 12CO cloud ensembles are directly linked to the velocity structure of the W43 complex as seen from the 12CO position-velocity diagram of Fig. 5b. This is even more obvious when inspecting the 13CO 1–0 longitude-velocity diagram of Nguyen Luong et al. (2011b, see their Fig. 6) and the higher angular resolution 13CO 2–1 diagram of Carlhoff et al. (2013, see their Fig. 5a). Both authors have proposed that the velocity component observed at is remotely associated with the W43 molecular complex, with a possible distance between them of a few hundred parsecs. Cloud ensemble #2 begins at lower longitude and smaller velocities and reaches the W43 position and velocity range with an approximate velocity gradient of 0.02 over a distance of 450 pc (see Figs. 4 and 5b). The 12CO cloud ensemble #3 is itself found at 97, extending for a distance of 900 pc (from to ), with several clouds peaking in the 92-100 range (see Fig. 4). These two 12CO cloud ensembles are associated with enhancements of the H I emission which generally are located at 5 lower velocities than the 12CO clouds (see Figs. 5a-b).
These three velocity gradients, indicated with arrows in Figs. 3-5, are associated with ensembles of clouds which are clear peaks in the position-velocity diagrams. They are not a direct proof of converging/colliding clouds since they could just underline stable clouds following the structure of the Milky Way in the region surrounding W43. Nevertheless, it is tempting to further check if they could be the remnants of H I gas streams and/or 12CO streaming clouds that could have collided to form the W43 molecular complex.
4 Discussion: Tracing back the formation of the W43 molecular complex
H2 molecules and H I atoms are directly linked by formation and destruction processes. In the diffuse parts of cloud complexes, H I gas forms from the dissociation of H2 molecules by the general interstellar radiation field of the Galactic plane, by the local UV radiation arising from embedded OB clusters, or by cosmic rays. In contrast, the high-density regions of cloud complexes offer enough shielding from H I atoms (cold and hot WNM), H2 molecules, and dust so that H I atoms efficiently turn into H2 molecules on the dust grains surfaces. Observing the formation of H2 gas and molecular clouds from H I in an envelope or streams is therefore a challenge.
4.1 A surface density threshold for the atomic gas?
Hypothetically, if there is equilibrium between the formation and destruction of H2, there should be a steep transition from atomic to molecular gas associated with the saturation of the H I surface density. A value of pc-2 has been observed in extragalactic studies (see e.g. Blitz & Rosolowsky 2006; Bigiel et al. 2008; Wong et al. 2009). Similar saturation levels have recently been found for diffuse and dense Galactic clouds (e.g. Barriault et al. 2010; Lee et al. 2012): pc-2, equivalent to cm-2. The equilibrium model of Krumholz et al. (2009) does predict such a surface density threshold at pc-2 for solar metallicity clouds. In contrast, the dynamical models accrete streams/clouds of H I and H2 gases to form molecular clouds/complexes which are in neither kinematic nor chemical equilibrium. As a consequence, dynamically-formed molecular clouds should display several transitions from atomic to molecular media along each line-of-sight. The model of e.g. Glover et al. (2010) predicts that the H I surface density is high when the cloud is assembling, that it then sharply drops within Myr, but that it may never reach equilibrium by Myr.
To measure the surface density map of atomic gas in W43 (see Fig. 6b), we used the H I VGPS data integrated over the range as in Fig. 2 and Sect. 3.3. We assumed that the H I emission was mainly optically thin and took a distance of 5.5 kpc for W43 and its surroundings. The equation of Spitzer (1978) for the column density turns into the following equation for the H I surface density, , as a function of the H I line brightness, (H I):
| (1) |
Figure 7 assumes elliptical geometry (see Sect. 3.2) and displays the mean H I surface density across the W43 atomic/molecular complex and its surroundings. We computed in rectangular annuli centered at and , with an aspect ratio 3:2, separated by 15 pc and 10 pc along the Galactic longitude and latitude, and reaching up to regions covering the cloud ensembles identified in Sect. 3.3. In regions where the H I lines are clearly optically thick, the surface density of H I is underestimated. Outside these areas, i.e. at the pc radii of Fig. 7, steadily decreases with radius from 82 pc-2 to 36 pc-2. While the gradient of the atomic gas surface density is robust, its absolute value is uncertain by at least a factor of 2. The main reason is that we have estimated by integrating the H I lines over the 13CO velocity range which may not perfectly apply for H I (see Sect. 3.1). Since the line widths of H I and CO gases in clouds are generally found to be similar (e.g. Barriault et al. 2010), a factor of 2 uncertainty seems reasonable. Where the emission is optically thick, this introduces additional uncertainty, especially in the inner parts of W43, at radii smaller than 60 pc.
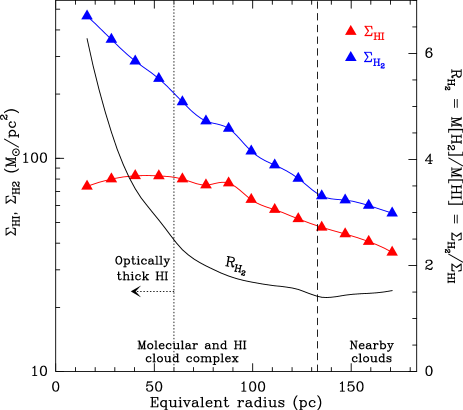
The surface density of the H I gas in W43 is in clear disagreement with previous saturation findings in nearby Galactic clouds (compare the red curve of Fig. 7 to e.g. Lee et al. 2012) and resolved galaxies (Bigiel et al. 2008), as well as with the threshold predicted by Krumholz et al. (2009). Indeed, is about 6.5 times larger than pc-2 and displays a negative radial gradient. The modelled H I threshold pc-2 is strictly valid for the idealized case of a spherical molecular cloud with solar metallicity and where H I and H2 gases are mutually exclusive. Krumholz et al. (2009) extrapolate it to the case of more structured molecular entities, such as molecular complexes composed of several clouds which host OB clusters. They showed that is, to a good approximation, independent of the strength of the interstellar radiation field and sublinearly dependent on the metallicity. The W43 molecular complex, with a slightly higher metallicity (possibly , Nguyen Luong et al. 2011b) and a very strong mean interstellar radiation field ( according to Shibai et al. 1991 and possibly , Schneider, priv. com.), is therefore predicted to display an H I threshold around pc-2. Note that, when focusing on a single 10 pc cloud such as W43-Main, the measured H I surface density decreases by a factor of a few but is still a factor of 3 times larger than pc-2. The large H I surface densities observed here are a consequence of either numerous H2 to H I transitions along each line of sight or a non-steady state formation like that suggested by the Glover & Mac Low (2007) models. In the case of W43, both processes probably need to be taken into account. We recall that the W43 molecular cloud complex remains a coherent and gravitationally bound cloud structure, even if it is structured as several individual clouds and numerous layers of H2 and H I gas.
4.2 The transition from atomic to molecular gas
The transition from atomic to molecular gas can also be traced by the evolution of the H2-to-H I ratio from the diffuse H I envelope to the dense molecular cloud. We estimated the mean H2-to-H I ratio, , throughout W43 and its surroundings by computing the mass surface density ratio of molecular H2 and atomic H I gas. The H I surface density map shown in Fig. 6a and computed from Eq. 1 has been smoothed to the (or 12 pc) resolution of the CfA data. Associated uncertainties are discussed in Sect. 4.1.
We determined the H2 mass surface density from the total intensity of 12CO 1–0 CfA data, , integrated again over . Adopting a value for the CO-to-H2 conversion factor (also known as the X-factor) given by Bloemen et al. (1986), the molecular column density, , is estimated through
| (2) |
With a mean molecular weight of , the mass surface density of molecular gas, , can be computed by the following equation:
| (3) |
Figure 6b gives the surface density map of molecular gas traced by 12CO 1–0. The H2 surface density values are uncertain by at least a factor of two because the X-factor, converting CO emission into H2 mass, is expected to vary across the Milky Way. According to Shetty et al. (2011), the X-factor only makes sense as a cloud-scale average. However, the relations observed in Figs. 7-8 should be secure since cloud properties are investigated through 12CO emission averaged over one to one hundred beams of HPBW pc. Moreover, given that W43 lies in the inner part of the Galactic disk, the amount of CO-dark H2 gas should be minimal. Note that instead of the surface density ratios used by e.g. Lee et al. (2012), we could have computed mass ratios, since they are strictly equal:
| (4) |
where the H2 and H I gas fractions are defined by and .
In Fig. 7, we see that the H2-to-H I ratio smoothly rises with decreasing radii with values of at the outskirts of the complex (i.e. at a radius of 135 pc) and 6 at 16 pc from the center of the complex. Even if we exclude the regions inside which the H I lines are clearly optically thick, and therefore focusing on the outer parts of what we called the H I envelope in Sect. 3.2, we see that the ratio still increases by about a factor of two as we move toward the center of the complex. Figure 7 therefore suggests that H I turns into H2 more efficiently at greater depths within the W43 complex. The surroundings of the W43 complex (called nearby clouds in Fig. 7) display a slight increase of from the 1.5 value measured at the outskirts of the complex. This behavior marks the start of new molecular cloud structures, confirming our definition of the W43 atomic/molecular complex.
The transition from H I-dominated to H2-dominated gas is usually set at either or (see e.g. Lee et al. 2012, and references therein). With either definition, the observed molecular ratio (black curve in Fig. 7) surprisingly suggests that this transition happens outside the H I envelope that we have identified for W43. As previously mentioned, the absolute values of (or ) and (or ) are both uncertain by factors of at least two. Even when accounting for these uncertainties (i.e. corresponding to values of correct to within a factor 4), we cannot reconcile the molecular ratio of Fig. 7 and our picture of a molecular complex surrounded by an H I envelope (see Sect. 3.2). Extending Fig. 7 to larger radii would not make sense since wider annuli would cover gas from other molecular structures observed at greater distances (see Fig. 2 and Sect. 4.3).
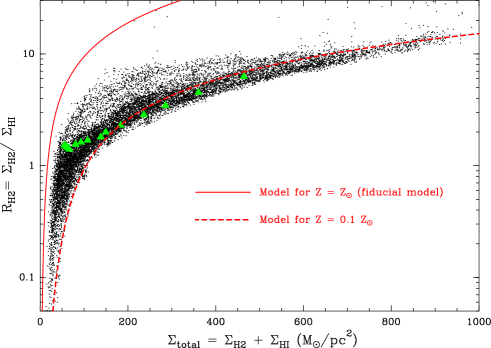
If we take the and curves of Fig. 7 at face value, the W43 complex seems to develop/form in an area globally shielded against the Galactic radiation field. This is in direct agreement with the high global molecular mass fraction of W43 (Nguyen Luong et al. 2011b, 65%,) which follows the general increase with the Galactic radius, observed for other molecular clouds (Elmegreen & Elmegreen 1987). Figure 8 plots the value of for each map point within the rectangle outlined by the black lines in Fig. 2 and therefore containing both the W43 complex and nearby clouds. As a function of their total surface density (), the distribution of points cannot be fit by the fiducial model of Krumholz et al. (2009) with a solar metallicity, and instead requires a much smaller and unrealistic metallicity: rather than the value of found by Nguyen Luong et al. (2011b). It also confirms that the W43 region, including the H I envelope, globally lies in a domain already shielded from external sources of UV radiation. Indeed, Fig. 8 does not trace the turnover between atomic-dominated and molecular-dominated zones observed by Lee et al. (2012, see their Fig. 12) and predicted by Krumholz et al. (2009). The purely-atomic envelope of W43 can be seen at high latitude but seems not to exist within the Galactic disk. This can be explained by the high gas and stellar pressure that should exist in the W43 region. Indeed, Blitz & Rosolowsky (2006) showed that, in galaxies, there is a relation between the combined pressures from stars and gas and the molecular ratio of clouds. Gas structures associated with the velocity gradients found in Sect. 3.3 are molecular and have a complex structure well before any interaction with W43, which argues that they should be called cloud ensembles rather than gas streams.
From Fig. 7, we also see that and simultaneously increase within the outer part of the H I envelope as the radius decreases from 135 pc to 60 pc. This increase of the H I surface density suggests a continuous accumulation of H I gas in this heterogeneous H2/H I structure, even if it is globally shielded from the Galactic field and protected from the UV field of the embedded H II regions. In this scenario the H I and H2 gases are well-mixed, coexisting but far from chemical equilibrium, as proposed by the models of e.g. Heitsch & Hartmann (2008) or Clark et al. (2012). The fact that some H2 is likely being converted back into H I is demonstrated by the strong () and large-scale () C II emission extended over the complete W43 complex, which is most probably associated with its many photodissociation layers (Shibai et al. 1991). The increase in the H2-to-H I ratio itself traces the global formation of molecular clouds thanks to H2 molecules forming and the molecular medium becoming denser. This also happens far from the area already defined as the W43 molecular cloud complex. If confirmed, these two results point toward a dynamical and non-steady state scenario for the formation of the W43 molecular complex.
4.3 Clouds following the Galactic structure/kinematics
We have identified, in the immediate surroundings of the W43 molecular complex, three cloud ensembles associated with structured 12CO and H I emission (see Fig. 4 and Sect. 3.3). With a common distance of 5.5 kpc, these three ensemble of clouds are developing 300 pc away from W43, while their spatial and velocity distributions suggest that they join at the location of the W43 molecular complex (see arrows in Figs. 3-5). To position these clouds in the W43 region, one should remember that W43 is located close to the tangent point of the Scutum-Centaurus arm and probably at/close to its connecting point with the long bar of the Milky Way.
Cloud ensemble #1 originates from longitudes smaller than that of W43 and approaches W43 from below the Galactic plane (see Figs. 3b, 4, and 5a). It could well be a high-latitude cloud attracted by the gravitational potential well of the Galactic plane and W43.
The two main cloud ensembles (#2 and #3) are themselves confined at low latitude and are seen at longitudes smaller than that of W43: from to and from to (see Figs. 3-4). Cloud ensemble #2 follows a velocity gradient close to that found for the leading part of the Scutum-Centaurus arm, shown schematically by a thick gray curve in Fig. 4 (e.g. Vallée 2008; Dame & Thaddeus 2011). Cloud ensemble #3 has a velocity gradient consistent with that of the preceding part of the Scutum-Centaurus arm as defined by Vallée (2008) (see Fig. 4). However, the new model of the Milky Way by e.g. Dame & Thaddeus (2011) stops the spiral structure of the Scutum-Centaurus arm at the location of W43 and starts the long bar a few degrees away (López-Corredoira et al. 2007; Benjamin et al. 2005; Rodríguez-Fernández & Combes 2008). Therefore, cloud ensemble #3 may alternatively correspond to clouds at the tip of the long bar (see also González-Fernández et al. 2012). As shown in Fig. 4, the velocity gradients of cloud ensembles #2 and #3 do not lie on the median location of the Scutum-Centaurus arm modeled with circular orbits (compare the arrows and the thick gray curve). We indeed measured 1 and up to offsets between the observed cloud ensembles and the position-velocity structure predicted by Vallée (2008). Such offsets for a single cloud could easily be explained by streaming motions of gas in and out of the gravitational well of spiral arms. However, in the case of clouds spanning 500 pc along the Galactic plane through and around W43, we favor an explanation related to the interaction with the long bar. Cloud ensembles #2 and #3 could therefore simply follow the structure of the Milky Way without interacting much with each other or with W43. Nevertheless, their location near the tip of the Galactic bar makes them subject to both the spiral arm circular rotation and the solid-body bar elliptical rotation. According to numerical simulations, such locations in galaxies have a high probability of cloud-cloud collision due to orbit crowding (e.g. Rodríguez-Fernández & Combes 2008).
4.4 Clouds streaming toward W43?
With the refined 5.5 kpc distance and the velocity range discussed in Sect. 3.1, we have recomputed the mass of the W43 complex, whose Galactic limits have been set by Nguyen Luong et al. (2011b) (see white rectangle of 130 pc equivalent diameter in Fig. 2). Without any correction for optical thickness, the atomic H I and molecular H2 He gas masses of W43 are and , leading to a total gas mass of . With the same assumptions, the mass of the H I envelope surrounding W43 (see white dashed rectangle of 270 pc equivalent diameter in Fig. 2) is . With of gas, the W43 12CO/H I complex is a large gravitational potential well that may attract nearby molecular clouds of mass. Here we briefly investigate the kinematic state of the three cloud ensembles identified in Sect. 3.3, with the aim of evaluating whether they are streaming toward W43.
The fact that these three cloud ensembles meet at the location of W43 could reflect a real physical interaction. A first argument is that the velocity dispersion measured for W43 is large (FWHM; see Nguyen Luong et al. 2011b) and could better account for agglomeration of clouds than micro-turbulence. Such a phenomenon is called gravitationally driven turbulence in dynamical models of cloud formation (see e.g. Heitsch et al. 2008). Cloud ensembles #1 to #3 could thus be streams that are accreted onto the central W43 region, driven simply by gravity. Such accretion from the ambient surrounding gas, at a late stage in the formation of molecular cloud complexes, has been noted in the numerical models of e.g. Vázquez-Semadeni et al. (2007), Heitsch & Hartmann (2008), and Dobbs (2008).
Velocity gradients of molecular clouds are often interpreted as tracing their specific angular momentum, which can be compared with Galactic rotation models and predictions of cloud formation scenarios (e.g. Imara & Blitz 2011). We do not investigate this idea here since cloud ensembles #1 to #3 are defined on much larger scales than that of individual clouds and ensembles #2 and #3 tend to reflect the velocity structure of the Milky Way (see Sect. 4.3). This last point implies that the major part of the gradients observed in the direction of increasing longitude does not trace the infall velocities of the cloud ensembles onto W43. Since cloud ensemble #1 is mainly observed in the direction of decreasing latitude, its velocity gradient could more meaningfully be compared to its predicted free-fall velocity toward the W43 12CO complex. In fact, the 0.2 gradient over 40 pc of Galactic latitude is consistent with the free-fall velocity of clouds located 200 pc away from the W43 complex. Interestingly, the velocity dispersion of cloud ensemble #1, estimated through 12CO line widths, narrows when approaching W43, with the FWHM decreasing from to (see Fig. 5a), suggesting again that it is attracted by the deep gravitational potential well of W43. We do not see any acceleration of the infall with decreasing distance of the cloud ensemble #1 to W43 but this can easily be covered up by projection and rotation effects as well as cloud inhomogeneities. As for cloud ensembles #2 and #3, they are initially separated by velocities along the line of sight and extend within the W43 complex as velocity structures. The complex structure in velocity of W43 is also testified by its velocity dispersion which is much larger than that of individual cloud ensembles streaming toward it: FWHM for W43 vs. for nearby clouds (see Fig. 4). The velocity jumps observed in the densest parts of the W43 complex such as the W43-Main and W43-South clouds (see Fig. 4) could represent local and abrupt accelerations of the infall.
According to Carlhoff et al. (2013), the W43 13CO molecular complex is stable against Galactic shear. The 12CO/H I cloud complex, which extends to much greater distances (from the white to the white-dashed rectangle in Fig. 2) and the 100 pc ensemble of clouds located at its outskirts (from the white-dashed to the black rectangle in Fig. 2) should be far more sensitive to Galactic shear. Indeed, despite their huge total mass, up to , the large area they cover, pc2, and their velocity range up to lead to a shear parameter of (with Eq. 8 of Dib et al. 2012). In a simple spiral rotation model of the Milky Way, both the envelope and nearby clouds would thus not be linked to W43. However, numerical simulations show that areas in front of galactic bars are locations where clouds sporadically agglomerate (e.g. Athanassoula 1992; Wozniak 2007; Renaud et al. 2013). Other indirect arguments come from extragalactic observational studies that found extreme molecular cloud complexes at the ends of galactic bars (e.g. M83, NGC 1300; see Martin & Friedli 1997, and references therein).
To conclude, we do not find definitive proof that nearby clouds are streaming toward W43, though, as discussed here, numerous factors favor this interpretation. W43, at a special location in the Milky Way, is denser and more dynamic than typical molecular clouds of the Galactic disk. These unusual characteristics have allowed us to identify clouds possibly streaming toward W43. Deeper observations and careful analyses of other cloud complexes may teach us whether cloud agglomeration occurs as frequently as it appears to within numerical simulations (see e.g. Dobbs 2008).
4.5 History of cloud and star formation in the region of W43
Here we try to extrapolate the interpretation that cloud ensembles are streaming toward W43 back to times when the W43 molecular cloud complex was just starting to form. According to numerical models, the special location of W43 in the Milky Way should have promoted its ability to accumulate H I and H2 gas from different structures (e.g. Rodríguez-Fernández & Combes 2008). We have shown, in Sect. 4.2, that most of the H2 molecules form far out of the classical 10–50 pc outskirts of molecular clouds (e.g. Lee et al. 2012) and further even than the 60–135 pc radii (from the center of the complex) taken to be the optically thin part of the H I envelope (see Fig. 7). The W43 molecular cloud complex may therefore have formed through the agglomeration of clouds containing both molecular and atomic gas. The clouds that currently are potentially streaming toward W43 (see Sect. 4.4) display velocity gradients following the Galactic structure. They thus can reasonably be taken as models for the initial cloud flows that created W43 but their surface density could be orders of magnitude higher or lower.
The level of cloud structure and the star formation activity of W43 and its nearby clouds can help define the chronology of the cloud and star formation events in the region. The molecular cloud structure #2 qualifies as ‘pre-star forming’ according to Sawada et al. (2012), who labeled it cloud M-2. They argue that it is not yet structured at high density, with a moderate brightness distribution index, and that it hosts very few H II regions (Anderson & Bania 2009). For comparison, W43 (their cloud H-2) is categorized as an ‘active star-forming complex’ since it has a high brightness distribution index and contains many more H II regions.
Molecular cloud ensemble #3 was not discussed by Sawada et al. (2012). It hosts many H II regions (Anderson & Bania 2009) and an enhanced number of Red Super Giant (RSG) clusters/associations (see e.g. Fig. 9 of González-Fernández et al. 2012). The three main RSG associations of the first quadrant are indeed located around G29.2-0.2 (RSGC3 Alicante7 Alicante10, e.g. González-Fernández & Negueruela 2012), G26.2-0.1 (RSGC2, also called Ste2, see e.g. Negueruela et al. 2012), and G24.6+0.4 (RSGC1 Alicante8, Negueruela et al. 2010). They contain numerous () RSG stars, are thus massive, 2, stellar associations. González-Fernández et al. (2012) locate them at the tip of the long bar of the Milky Way and 6 kpc from the Sun. Their presence at suggests that, 20 Myrs ago, there were several sites of extremely active cloud and star formation located 500 pc downstream of W43 (see Fig. 2). This spatial offset is reminiscent of those found between clouds and star clusters in e.g. the NGC 6951 galaxy (van der Laan et al. 2011). Molecular cloud ensemble #3 is associated with these RSGCs and is one order of magnitude less massive than W43 (see Fig. 2). We thus propose that cloud agglomeration and star formation have started in the cloud complex that was associated with velocity gradient #3. It is now enhanced in W43 mainly owing to clouds infalling from cloud ensemble #2. This chronology is in agreement with numerical simulations of galaxy evolution with a barred potential, which tend to accumulate clouds in spiral leading arms ahead of the bar, form superstar clusters within these cloud complexes and then drag these clusters and clouds within the bar, where they often disrupt (Wozniak 2007; Renaud et al. 2013, in prep.).
5 Summary and conclusions
In order to improve our knowledge of molecular cloud formation, we have initiated an investigation into W43, an extreme molecular cloud and star-forming complex located at a dynamical place within the Milky Way, 5.5 kpc from the Sun. We used an H I and 12CO 1–0 database allowing us to trace back the formation of molecular clouds on 10 pc to 400 pc scales for this region. Our main findings can be summarized as follows:
-
1.
We detected an H I envelope around the W43 molecular cloud (see Fig. 2), confirming the work of Nguyen Luong et al. (2011b). It has an aspect ratio of 3:2 (with the larger axis along the Galactic longitude), an equivalent diameter of 270 pc, and a mass of . Interestingly, such a well-defined and symmetrical envelope is rarely seen around star-forming regions.
-
2.
Three cloud ensembles of H I and 12CO gas develop along hundreds of parsecs, at the outskirts of and within the atomic envelope (see Figs. 3-5). The velocity gradients of these cloud ensembles are used to position them in the W43 region. Cloud ensemble #1 may fall from the high-latitude part of the Galactic disk, #2 seems to originate from the Scutum-Centaurus arm, and #3 may be at the very tip of the long bar. This picture is consistent with W43 being in front of the long bar, a region with crowded orbits known to be efficient in accumulating gas.
-
3.
These three (mostly) molecular ensemble of clouds are separated by 20–40 along the line of sight and converge on the location of W43. The measured velocity gradients extend within the W43 complex as velocity structures, are consistent with free-fall velocities, and display 20 velocity jumps where they merge. The cloud ensembles #1–#3 could thus be streams that are accreted onto the central W43 region, which has a total mass of 10, driven by gravity rather than forced by converging flows of atomic gas.
-
4.
The H I surface density measured throughout the W43 complex is high when compared to the values usually quoted in the literature: pc-2 instead of pc-2. The H I surface density does not show a saturated behavior but rather increases when entering the molecular complex (see Fig. 7). This suggests that W43 is a heterogeneous structure of mixed H2 and H I gas and that equilibrium between H2 formation and photodissociation is not reached. These results thus argue in favor of a non steady-state formation of molecular clouds in W43.
-
5.
The H2-to-H I ratio measured over the complete W43 region is high, , proving that most of the gas is already in molecular form before reaching W43 (see Fig. 8). High-density regions of galaxies, such as the W43 molecular cloud complex, located in what was previously called the molecular ring of the Milky Way, obviously cannot provide constraints on the transition from atomic to molecular material. The formation of such molecular cloud entities is therefore weakly related to the efficiency of turning H I atoms into H2 molecules.
-
6.
We conclude that the W43 molecular cloud complex most probably formed through a dynamical process such as the collision of several clouds, already in a molecular-dominated regime. The geometry and strength of this collision, as well as the molecular ratio and structure of the clouds, should be used to customize colliding cloud models. This is one of the goals of the W43-HERO IRAM large program which uses the IRAM 30 m telescope to determine the diagnostics of colliding clouds and explain the extreme characteristics of the W43 molecular cloud star-forming region.
Acknowledgements.
Part of this work was supported by the French National Agency for Research (ANR) projects ‘PROBeS’ and ‘STARFICH’, numbers ANR-08-BLAN-0241 and ANR-11-BS56-010. This project is carried out within the Collaborative Research Council 956, sub-project A4, funded by the Deutsche Forschungsgemeinschaft (DFG). SG acknowledges support from the DFG via SFB project 881 ‘The Milky Way System’ (sub-projects B1, B2 and B8). This publication made use of the synergy between observers and modellers set up for the large IRAM program W43-HERO. We are grateful to Snezana Stanimirovic and Simon Bihr for useful discussions.References
- Anderson & Bania (2009) Anderson, L. D. & Bania, T. M. 2009, ApJ, 690, 706
- Andersson et al. (1992) Andersson, B.-G., Roger, R. S., & Wannier, P. G. 1992, A&A, 260, 355
- Andersson & Wannier (1993) Andersson, B.-G. & Wannier, P. G. 1993, ApJ, 402, 585
- Athanassoula (1992) Athanassoula, E. 1992, MNRAS, 259, 345
- Audit & Hennebelle (2005) Audit, E. & Hennebelle, P. 2005, A&A, 433, 1
- Ballesteros-Paredes et al. (1999) Ballesteros-Paredes, J., Hartmann, L., & Vázquez-Semadeni, E. 1999, ApJ, 527, 285
- Banerjee et al. (2009) Banerjee, R., Vázquez-Semadeni, E., Hennebelle, P., & Klessen, R. S. 2009, MNRAS, 398, 1082
- Barriault et al. (2010) Barriault, L., Joncas, G., Falgarone, E., et al. 2010, MNRAS, 406, 2713
- Benjamin et al. (2005) Benjamin, R. A., Churchwell, E., Babler, B. L., et al. 2005, ApJ, 630, L149
- Bigiel et al. (2008) Bigiel, F., Leroy, A., Walter, F., et al. 2008, AJ, 136, 2846
- Blitz & Rosolowsky (2006) Blitz, L. & Rosolowsky, E. 2006, ApJ, 650, 933
- Blitz & Shu (1980) Blitz, L. & Shu, F. H. 1980, ApJ, 238, 148
- Blitz & Thaddeus (1980) Blitz, L. & Thaddeus, P. 1980, ApJ, 241, 676
- Bloemen et al. (1986) Bloemen, J. B. G. M., Strong, A. W., Mayer-Hasselwander, H. A., et al. 1986, A&A, 154, 25
- Bournaud et al. (2010) Bournaud, F., Elmegreen, B. G., Teyssier, R., Block, D. L., & Puerari, I. 2010, MNRAS, 409, 1088
- Carlhoff et al. (2013) Carlhoff, P., Nguyen Luong, Q., Schilke, P., et al. 2013, A&A, 560, A24
- Clark et al. (2012) Clark, P. C., Glover, S. C. O., Klessen, R. S., & Bonnell, I. A. 2012, MNRAS, 424, 2599
- Dame et al. (2001) Dame, T. M., Hartmann, D., & Thaddeus, P. 2001, ApJ, 547, 792
- Dame & Thaddeus (2011) Dame, T. M. & Thaddeus, P. 2011, ApJ, 734, L24
- Dib et al. (2012) Dib, S., Helou, G., Moore, T. J. T., Urquhart, J. S., & Dariush, A. 2012, ApJ, 758, 125
- Dobbs (2008) Dobbs, C. L. 2008, MNRAS, 391, 844
- Dobbs & Pringle (2013) Dobbs, C. L. & Pringle, J. E. 2013, MNRAS, 432, 653
- Elmegreen & Elmegreen (1987) Elmegreen, B. G. & Elmegreen, D. M. 1987, ApJ, 320, 182
- Glover et al. (2010) Glover, S. C. O., Federrath, C., Mac Low, M.-M., & Klessen, R. S. 2010, MNRAS, 404, 2
- Glover & Mac Low (2007) Glover, S. C. O. & Mac Low, M.-M. 2007, ApJ, 659, 1317
- González-Fernández et al. (2012) González-Fernández, C., López-Corredoira, M., Amôres, E. B., et al. 2012, A&A, 546, A107
- González-Fernández & Negueruela (2012) González-Fernández, C. & Negueruela, I. 2012, A&A, 539, A100
- Hartmann et al. (2001) Hartmann, L., Ballesteros-Paredes, J., & Bergin, E. A. 2001, ApJ, 562, 852
- Hartmann et al. (2012) Hartmann, L., Ballesteros-Paredes, J., & Heitsch, F. 2012, MNRAS, 420, 1457
- Heitsch et al. (2005) Heitsch, F., Burkert, A., Hartmann, L. W., Slyz, A. D., & Devriendt, J. E. G. 2005, ApJ, 633, L113
- Heitsch & Hartmann (2008) Heitsch, F. & Hartmann, L. 2008, ApJ, 689, 290
- Heitsch et al. (2008) Heitsch, F., Hartmann, L. W., Slyz, A. D., Devriendt, J. E. G., & Burkert, A. 2008, ApJ, 674, 316
- Hennebelle et al. (2008) Hennebelle, P., Banerjee, R., Vázquez-Semadeni, E., Klessen, R. S., & Audit, E. 2008, A&A, 486, L43
- Hennebelle & Pérault (1999) Hennebelle, P. & Pérault, M. 1999, A&A, 351, 309
- Hennemann et al. (2012) Hennemann, M., Motte, F., Schneider, N., et al. 2012, A&A, 543, L3
- Hill et al. (2011) Hill, T., Motte, F., Didelon, P., et al. 2011, A&A, 533, A94
- Imara & Blitz (2011) Imara, N. & Blitz, L. 2011, ApJ, 732, 78
- Inoue & Inutsuka (2012) Inoue, T. & Inutsuka, S. 2012, ApJ, 759, 35
- Jackson et al. (2006) Jackson, J. M., Rathborne, J. M., Shah, R. Y., et al. 2006, ApJS, 163, 145
- Koyama & Inutsuka (2000) Koyama, H. & Inutsuka, S. 2000, ApJ, 532, 980
- Krumholz et al. (2009) Krumholz, M. R., McKee, C. F., & Tumlinson, J. 2009, ApJ, 693, 216
- Lee et al. (2012) Lee, M.-Y., Stanimirović, S., Douglas, K. A., et al. 2012, ApJ, 748, 75
- López-Corredoira et al. (2007) López-Corredoira, M., Cabrera-Lavers, A., Mahoney, T. J., et al. 2007, AJ, 133, 154
- Louvet et al. (2014) Louvet, F., Motte, F., Hennebelle, P., & et al. 2014, A&A
- Mac Low & Glover (2012) Mac Low, M.-M. & Glover, S. C. O. 2012, ApJ, 746, 135
- Martin & Friedli (1997) Martin, P. & Friedli, D. 1997, A&A, 326, 449
- Molinari et al. (2010) Molinari, S., Swinyard, B., Bally, J., et al. 2010, A&A, 518, L100+
- Motte et al. (2012) Motte, F., Bontemps, S., Hennemann, M., et al. 2012, in SF2A-2012: Proceedings of the Annual meeting of the French Society of Astronomy and Astrophysics, ed. S. Boissier, P. de Laverny, N. Nardetto, R. Samadi, D. Valls-Gabaud, & H. Wozniak, 45–50
- Motte et al. (2003) Motte, F., Schilke, P., & Lis, D. C. 2003, ApJ, 582, 277
- Motte et al. (2010) Motte, F., Zavagno, A., Bontemps, S., et al. 2010, A&A, 518, L77+
- Negueruela et al. (2010) Negueruela, I., González-Fernández, C., Marco, A., Clark, J. S., & Martínez-Núñez, S. 2010, A&A, 513, A74
- Negueruela et al. (2012) Negueruela, I., Marco, A., González-Fernández, C., et al. 2012, A&A, 547, A15
- Nguyen-Luong et al. (2013) Nguyen-Luong, Q., Motte, F., Carlhoff, P., et al. 2013, ApJ, 775, 88
- Nguyen Luong et al. (2011a) Nguyen Luong, Q., Motte, F., Hennemann, M., et al. 2011a, A&A, 535, A76
- Nguyen Luong et al. (2011b) Nguyen Luong, Q., Motte, F., Schuller, F., et al. 2011b, A&A, 529, A41
- Renaud et al. (2013) Renaud, F., Bournaud, F., Emsellem, E., et al. 2013, MNRAS, 436, 1836
- Rodríguez-Fernández & Combes (2008) Rodríguez-Fernández, N. J. & Combes, F. 2008, A&A, 489, 115
- Roman-Duval et al. (2009) Roman-Duval, J., Jackson, J. M., Heyer, M., et al. 2009, ApJ, 699, 1153
- Sawada et al. (2012) Sawada, T., Hasegawa, T., & Koda, J. 2012, ApJ, 759, L26
- Shetty et al. (2011) Shetty, R., Glover, S. C., Dullemond, C. P., et al. 2011, MNRAS, 415, 3253
- Shibai et al. (1991) Shibai, H., Okuda, H., Nakagawa, T., et al. 1991, ApJ, 374, 522
- Spitzer (1978) Spitzer, L. 1978, Physical processes in the interstellar medium (Wiley VCH)
- Stil et al. (2006) Stil, J. M., Taylor, A. R., Dickey, J. M., et al. 2006, AJ, 132, 1158
- Vallée (2008) Vallée, J. P. 2008, AJ, 135, 1301
- van der Laan et al. (2011) van der Laan, T. P. R., Schinnerer, E., Boone, F., et al. 2011, A&A, 529, A45
- van Dishoeck & Black (1986) van Dishoeck, E. F. & Black, J. H. 1986, ApJS, 62, 109
- Vázquez-Semadeni et al. (2010) Vázquez-Semadeni, E., Colín, P., Gómez, G. C., Ballesteros-Paredes, J., & Watson, A. W. 2010, ApJ, 715, 1302
- Vázquez-Semadeni et al. (2007) Vázquez-Semadeni, E., Gómez, G. C., Jappsen, A. K., et al. 2007, ApJ, 657, 870
- Vázquez-Semadeni et al. (1996) Vázquez-Semadeni, E., Passot, T., & Pouquet, A. 1996, ApJ, 473, 881
- Wannier et al. (1983) Wannier, P. G., Lichten, S. M., & Morris, M. 1983, ApJ, 268, 727
- Williams et al. (1995) Williams, J. P., Blitz, L., & Stark, A. A. 1995, ApJ, 451, 252
- Wong et al. (2009) Wong, T., Hughes, A., Fukui, Y., et al. 2009, ApJ, 696, 370
- Wozniak (2007) Wozniak, H. 2007, A&A, 465, L1
- Zhang et al. (2014) Zhang, B., Moscadelli, L., Sato, M., et al. 2014, ApJ, 781, 89