The Light Curve Shapes as a Key to Resolving the Origin of Long Secondary Periods in Red Giant Stars
Abstract
We present a study of OGLE light curves of red giant stars exhibiting long secondary periods (LSPs) – an enigmatic phenomenon commonly observed in stars on the upper red giant branch and asymptotic giant branch. We show that the light curves of LSP stars are essentially identical to those of the spotted variables with one dark spot on their photospheres. Such a behavior can be explained by a presence of a dusty cloud orbiting the red giant together with a low-mass companion in a close, circular orbit. We argue that the binary scenario is in agreement with most of the observational properties of LSP variables, including non-sinusoidal shapes of their radial velocity curves.
Subject headings:
stars: AGB and post-AGB – stars: late-type – binaries: close – starspots – stars: variables: other1. Introduction
Long secondary periods (LSPs), observed in at least one third of pulsating red giants and supergiants, are one of the most interesting unsolved problems of modern stellar astrophysics. This phenomenon has been known for decades (O’Connell, 1933; Payne-Gaposhkin, 1954; Houk, 1963) and it is observed in tens of thousands of long period variables (LPVs) in our and other galaxies. The photometric amplitudes associated with the LSPs are in some cases quite large (up to 1 mag in the V band), and radial velocity changes during LSP cycles have been detected, but still we cannot even answer the question of whether we are dealing with intrinsic or extrinsic stellar variability. There are two popular hypotheses explaining the LSP phenomenon. The first one assumes that a red giant star has a low-mass companion which, due to interactions with the circumstellar matter, causes the periodic photometric and spectroscopic variations (Wood et al., 1999; Soszyński, 2007). The second hypothesis assumes that red giant stars exhibit some kind of radial or non-radial pulsations (Hinkle et al., 2002; Wood et al., 2004; Derekas et al., 2006), but currently there is no theoretical pulsation model that satisfactorily explains all the observed features of the LSP variables.
LSPs range from about 200 to 1500 days and are an order of magnitude longer than the typical pulsation periods of semiregular variables (SRVs) and OGLE small amplitude red giants (OSARGs). It is worth noting that LSPs are not observed in Mira variables, which have the largest-amplitude light curves among pulsating red giants. In the period–luminosity (PL) diagram, LSPs form a well-defined sequence (sequence D; Wood et al., 1999), roughly parallel to other PL sequences populated by pulsating red giants. Soszyński et al. (2004) noticed that sequence D partly overlaps and is a direct continuation of sequence E, which is formed by close binary systems (eclipsing and ellipsoidal variables) containing a red giant as one of the components. Sequences D and E overlap in all the studied photometric bandpasses, from visual to infrared (Derekas et al., 2006), which is a strong argument for the binary explanation of the LSPs.
On the other hand, the shapes of the radial velocity curves are interpreted as evidence against the binary scenario. The full velocity amplitudes associated with LSPs range from 2 to 7 km s-1, with a tight clustering around 3.5 km s-1 (Nicholls et al., 2009). Assuming a binary origin of the LSP phenomenon, this velocity amplitude would correspond to a secondary component of brown-dwarf mass. The velocity curves are non-sinusoidal, which may be interpreted as a sign of eccentric orbits. However, most of the observed velocity curves have shapes very similar to each other, which implies similar angles of periastron in the majority of the observed LSP variables. Of course, one may expect that the angles of periastron in randomly selected systems should have a uniform distribution. According to Nicholls et al. (2009), the probability that the observed radial velocity curves are consistent with the uniform distribution of angles of periastron is of the order of , which practically excludes the possibility that the LSP phenomenon is caused by binarity.
Spectroscopic observations gave us information about the changes of the effective temperature during the LSP cycle. The changes are very small, much smaller than expected for radial pulsation (Wood et al., 2004). In turn, nonradial oscillations would be difficult to reconcile with the observed movement of the visible surface of the giant stars during their LSP cycle, which is of the order of 30% of the stellar radius (Nicholls et al., 2009). Another important observational fact was discovered by Wood & Nicholls (2009) – LSP variables are surrounded by significant amounts of cool dust and this circumstellar matter has a non-spherical (clumpy or disk-like) distribution.
In this work we argue that the asymmetric radial velocity curve in an LSP variable may be produced by a low-mass companion in a circular orbit just above the surface of the red giant. Such a companion may be followed by a dusty cloud that regularly obscures the giant and causes the apparent luminosity variations. We present a simple model that, at least qualitatively, well reproduces the light and velocity curves observed for LSP stars.
2. Light curves of LSP stars
The light curves presented in this paper were obtained in the standard I-band by the third phase of the Optical Gravitational Lensing Experiment (OGLE-III; Udalski, 2003). The OGLE-III observations provided 8 years (2001-2009) of continuous, high-quality light curves of the large samples of LPVs in the Magellanic Clouds (Soszyński et al., 2009, 2011) and in the Galactic bulge (Soszyński et al., 2013). In this paper we analyze the photometric observations of giants in the Large Magellanic Cloud (LMC) and Galactic bulge.
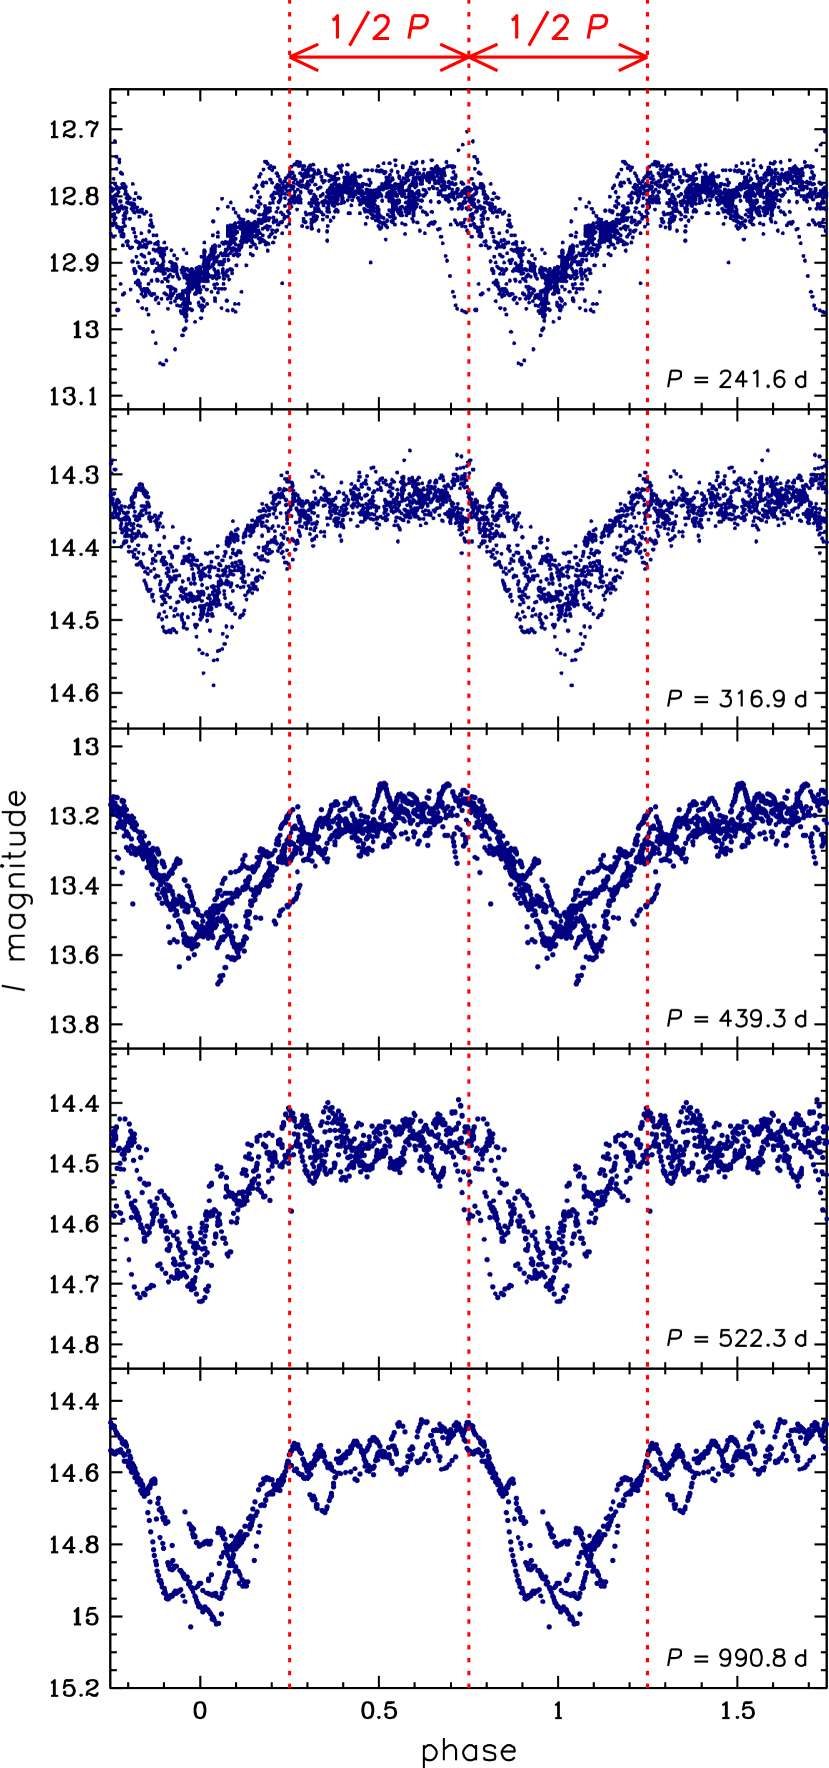
The morphology of the light curves is a characteristic that clearly distinguishes LSP variations from the pulsations that populate PL sequences A′ to C, and from the ellipsoidal variables falling on sequence E. In Fig. 1 we present several I-band light curves of LSP variables from the LMC and bulge. These objects were selected because of their relatively small pulsation amplitudes and quite stable amplitudes of the LSP variations, which allowed us to highlight the typical shape of the LSP light curves. In some sequence D stars the minima of the LSP light curves significantly vary in depth from cycle to cycle, and even in some cases the variations become completely invisible for a period of time (Soszyński, 2007).
Nevertheless, most of the LSP variables, at least those with larger amplitudes, exhibit light curves similar to those presented in Fig. 1. As can be seen, the typical light curve of an LSP variable may be divided into two halves. During one half of the LSP cycle, the brightness of the star does not change at all or it increases slowly with time. During the other half of the LSP, the light curves usually have a triangular shape – the luminosity decreases, reaches a minimum and then increases. Such light curves to some extent resemble detached eclipsing binary systems with orbital periods twice the LSPs. However, this would be incompatible with the spectroscopic observations which show that the velocity curves of sequence D stars vary with periods equal to the LSPs, not twice the LSPs (Nie et al., 2010; Nicholls et al., 2010). Also, a comparison of the LSP light curves with the light curves of real eclipsing binaries (e.g. collected in the OGLE samples: Graczyk et al., 2011; Pawlak et al., 2013) excludes the possibility that sequence D stars are classical eclipsing binary systems (i.e. that they are eclipsed directly by the companion). The “eclipses” are too wide and practically in all cases there are no alternations of deeper and shallower minima that could be interpreted as an effect of the different temperatures of the two stellar components of the system.
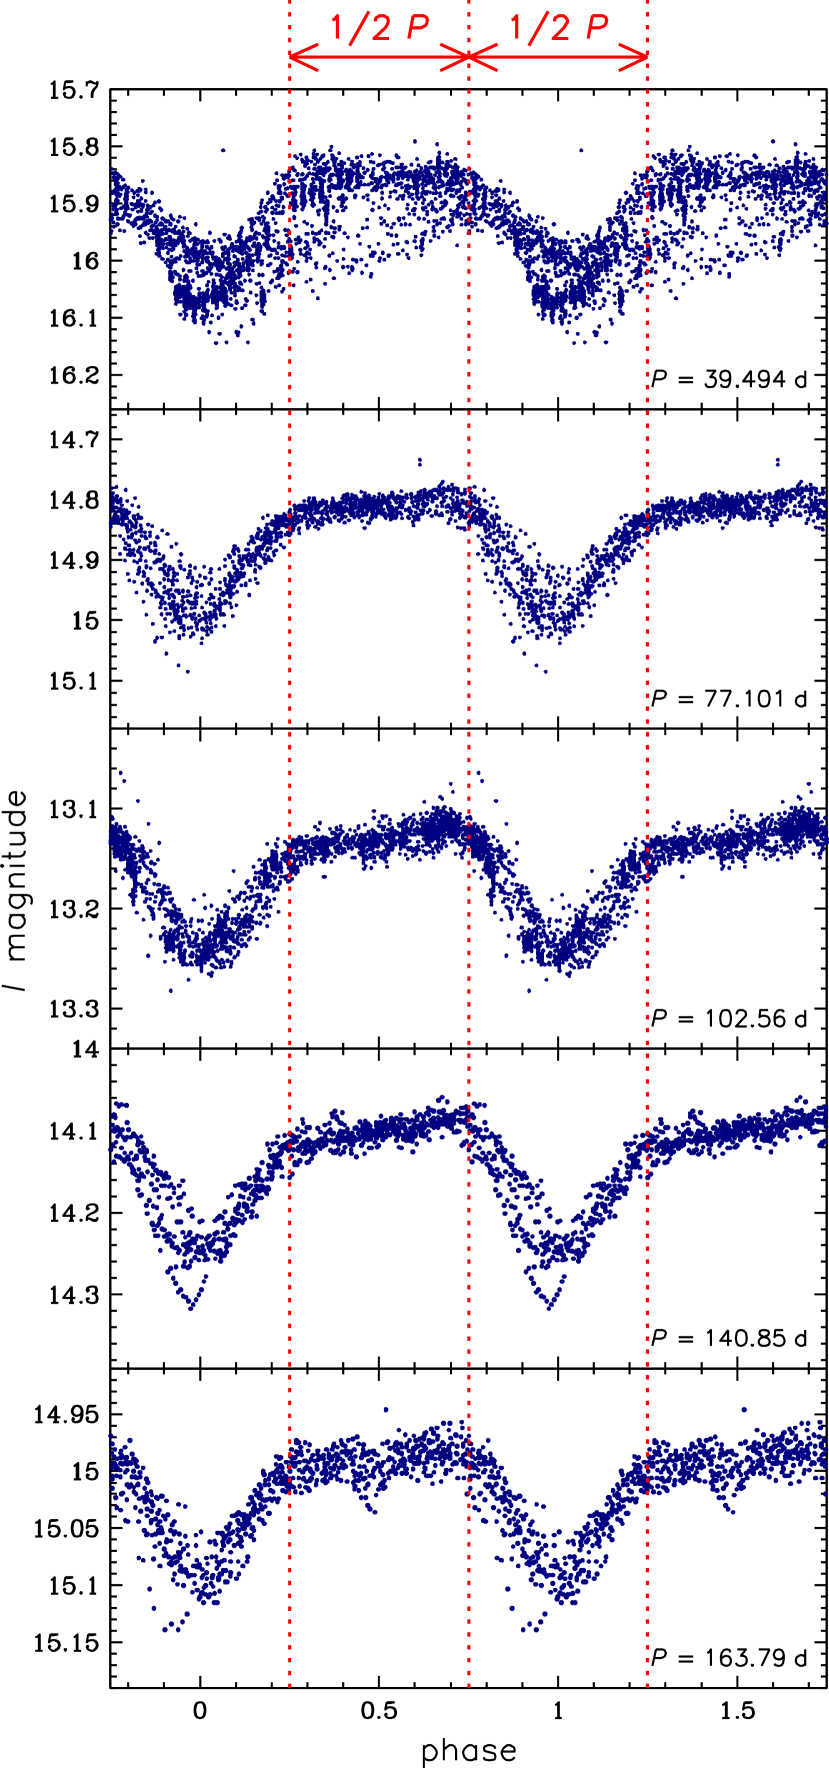
In the OGLE photometric database we found a number of red stars, likely asymptotic giant branch stars, that have similar light curves to the LSP variables, but have shorter periods. A sample of such light curves is shown in Fig. 2. These light curves also can be divided into two, roughly equal parts – one with nearly constant, sometimes slowly increasing brightness, and the second with a symmetric decrease and increase of brightness.
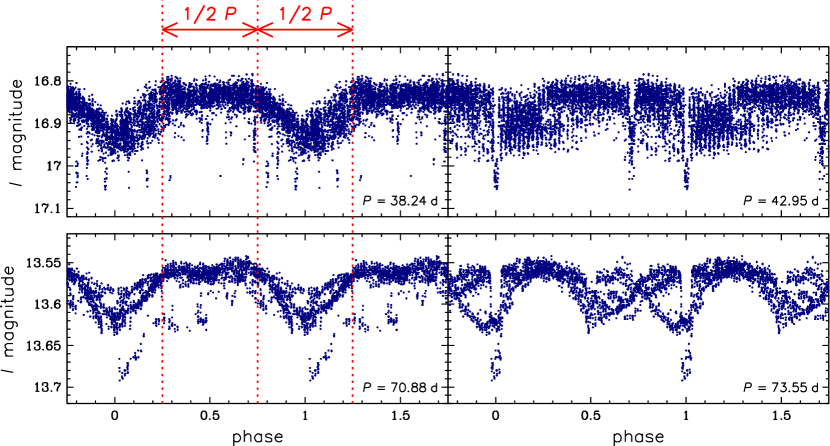
In some cases, light curves of this type additionally show narrow eclipses, indicating that these objects are binary systems. The orbital periods of these systems are similar, but slightly different to the periods of the LSP-like modulation seen in their light curves. Examples of two such stars are presented in Fig. 3. Here, each light curve is shown twice: in the left panels it is folded with the LSP-like period and in the right panel – with the orbital period. Objects presented in Fig. 3 are typical RS Canum Venaticorum variables – binary stars with enormous starspots on their surfaces causing the photometric variations (the so-called distortion waves) with periods slightly different to the orbital periods. The difference between both periods is caused by a differential rotation of the star which slowly changes the position of the starspots relative to the companion. Given the similarity of the light curves shown in Fig. 2 and the left panels of Fig. 3, we interpret such photometric behavior as a result of presence of starspots on the stellar surface, namely single, relatively large, dark spots. When the spot is hidden on the far side of a star, the apparent brightness is nearly constant. When the spot is located on the visible side of a star, we observe the wide minimum, which lasts roughly half of the rotation period.
The morphology of the light curves is not the only observational feature that links spotted variables and LSP stars. Another such characteristic is the ratio of light curve amplitudes measured in blue and red filters. Derekas et al. (2006) studied MACHO light curves of several thousand LPVs and ellipsoidal variables (sequence E stars). In particular they checked the ratios of amplitudes measured for individual objects in the blue and red filters. They noticed that for the ellipsoidal variables the amplitudes in both filters are very similar, which is in agreement with expectations, since ellipsoidal variability is mainly caused by geometric effects. LSP stars have blue-to-red amplitude ratios distinctly larger than ellipsoidal variables and similar to the ratios of amplitudes observed in the pulsating LPVs. For this reason, Derekas et al. (2006) argued for pulsations rather than binarity as the origin of the LSP phenomenon.
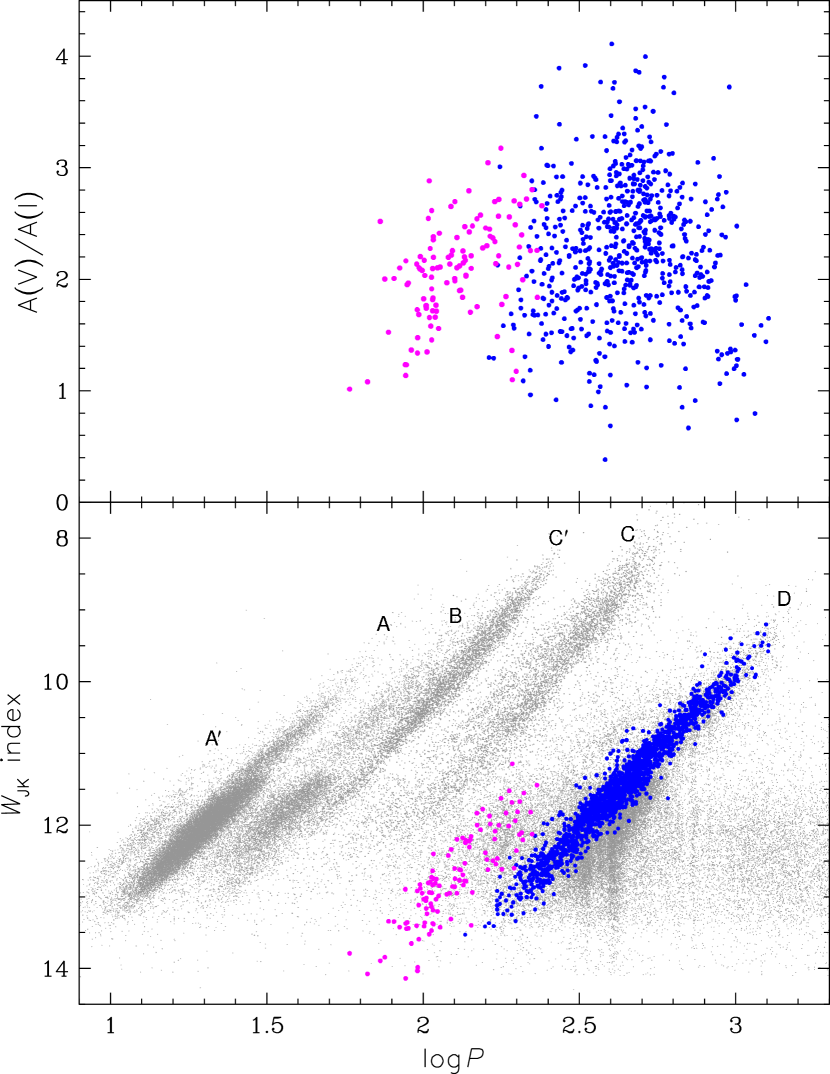
In the upper panel of Fig. 4 we plot the ratios of amplitudes measured within the OGLE survey in the V and I bands against the logarithm of periods. Here we present only those stars that have at least 50 V-band points in the OGLE photometric database. Note that the amplitude ratios are on average very similar for the LSP and spotted variables with median values of equal to 2.2 and 2.1, respectively. The conclusion is that large blue-to-red amplitude ratios may occur not only in the pulsating stars, but also in the spotted variables and probably in other types of stellar variability. Sequence D stars exhibit large values which is one of the many features that distinguish them from ellipsoidal variables (Nicholls et al., 2010).
Another feature that shows similarity between spotted variables and sequence D stars are the PL relations. The LSP variables follow the PL relation (sequence D) which is narrowest in the near-infrared photometric domain, especially if we use the extinction-free Wesenheit index, defined as , where and magnitudes are from the IRSF Point Source Catalog (Kato et al., 2007). In the lower panel of Fig. 4 we present the PL diagram for LSP variables in the LMC overplotted on the PL relations formed by all other LPVs detected in the LMC by the OGLE project (Soszyński et al., 2009). For clarity, we present here only a sample of LSP variables, with well-defined light curves and relatively large amplitudes. On the same diagram we plotted objects classified as spotted variables with one dark spot (with light curves similar to those shown in Fig. 2). Note the PL relationship that is followed by these variables. Periods of the spotted variables are about two times shorter than the periods of sequence D stars of the same luminosity.
The PL relation for spotted red giants can be explained by their fast rotation, close to the break-up velocity, that may limit the relation from the short-period side. The long periods of the PL relation may be limited by the stellar magnetic activity, which is strong in fast rotators and decreases with the increasing rotation periods. Taking this into account, it would be difficult to explain LSPs by the presence of dark spots in the stellar photospheres. The periods of the sequence D stars are longer than the longest periods of spotted variables of the same luminosity. Moreover, spectropolarimetric observations of two nearby LSP stars performed by Wood et al. (2009) did not reveal any signatures of magnetic fields. Finally, as noted by Wood et al. (2004), the starspot scenario would be difficult to reconcile with the observed radial velocity curves of sequence D stars, not only with their amplitudes, but also with the shapes of the velocity curves. A dark spot is visible roughly for a half of the rotation period of a star, so during the other half of the LSP cycle the velocity curve should be flat. It does not agree with the observations which show continuous changes of the radial velocities during the LSP cycle (Hinkle et al., 2002; Wood et al., 2004; Nicholls et al., 2009).
3. A model for the LSP variations
It has been shown above that red giants exhibiting the LSP modulation have similar photometric properties to spotted variables with one dark spot on their photospheres. However, other observational facts argue against the starspots as an explanation of the LSP phenomenon. Given the Wood & Nicholls (2009) discovery that sequence D stars are surrounded by a dust in a non-spherical configuration, we propose a different explanation for the morphology of the LSP light and velocity curves. The same photometric effect can be produced by a dusty cloud orbiting the giant just above its surface and regularly obscuring the star. Such a hypothesis explaining the LSP phenomenon was proposed by Wood et al. (1999) and developed by Soszyński (2007). In this scenario, the red giant has a low-mass companion in the brown-dwarf range. The matter lost by the red giant due to stellar winds follows a spiral pattern with a comet-like tail. Hydrodynamical simulations of a wind-driven accretion flow in binary systems (Theuns & Jorissen, 1993; Mastrodemos & Morris, 1998; Nagae et al., 2004) show that the maximum density of such a dusty cloud is located just behind the secondary component.
The binary hypothesis was ruled out by Wood et al. (2004) and Nicholls et al. (2009) who carried out comprehensive studies of possible mechanisms for the LSP. Within the binary scenario, the non-sinusoidal velocity curves of the LSP variables could be a result of eccentric orbits. The problem with this explanation is that most of the observed velocity curves have similar shapes, which implies similar angles of periastron in these systems, which is inconsistent with the expectation of random orbital orientations. This argues against binarity as the cause for LSPs.
However, this argument may lose its validity, if we assume that the asymmetric radial velocity curves are caused by factors other than eccentricity of the orbits. Even if the orbit is circular, a non-sinusoidal velocity curve may be produced from the non-spherical shape of the giant caused by tidal interactions with its low-mass companion, and from the dusty cloud which in different phases of its orbital cycle may block part of the light in the approaching or declining parts of the stellar disk (the Rossiter-McLaughlin effect). These effects added to the sinusoidal velocity curve produced by motion in the circular orbit may give the observed variations of the radial velocity.
We made a simple model of such a binary system with the Nightfall code111http://www.hs.uni-hamburg.de/DE/Ins/Per/Wichmann/ Nightfall.html, which is designed to model eclipsing binary systems and calculate their synthetic light and velocity curves. We defined a system with a circular orbit and mass ratio . The primary star is a red giant with the Roche lobe fill factor equal to 0.9 and co-rotating with the secondary component, which is small and cool and practically does not contribute to the light emitted by the system. To simulate the cloud with a comet-like tail which periodically obscures the red giant, we defined two dark spots on the stellar photosphere – one located just behind the line connecting both components (the densest part of the cloud) and the second located about from this line (the comet-like tail of the cloud). We tested several different positions, sizes and transparencies of the spots to reproduce the observed features of the LSP stars.
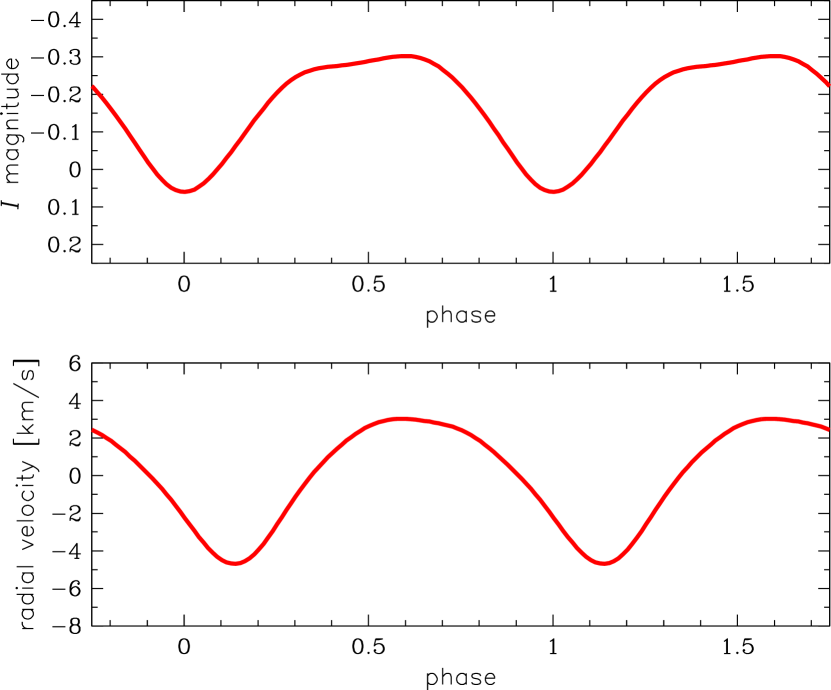
In Fig. 5 we present the simulated light and velocity curves produced by our model. It is immediately obvious that the synthetic curves are very similar to the observed ones. The first spot (the densest part of the cloud) causes the triangular minimum in the light curve which lasts roughly half of the LSP. The second spot (the tail) is responsible for the slow increase in brightness when the main part of the cloud is hidden on the other side of the star. Despite the assumption of the circular orbit, the simulated radial velocity curve is non-sinusoidal and resembles those observed for LSP variables (Hinkle et al., 2002; Wood et al., 2004; Nicholls et al., 2009).
The only inconsistency of our model with the observations is the phase shift between light and velocity curves. In most LSP stars the minimum of the radial velocity precedes the minimum light, although the phase shifts vary from star to star (cf. Fig. 3 in Nicholls et al., 2009). In our model the velocity lags the light by roughly 0.1 in phase. To obtain the velocity curve that precedes the light curve, the dark spots (dusty cloud) should be located at the opposite side of the red giant, i.e. at the longitudes more than from the line connecting the giant and its low-mass companion. It is not obvious if the dusty, comet-like cloud may obscure the stellar surface at these longitudes. Clearly, more advanced modeling and hydrodynamical simulations are needed to solve this problem.
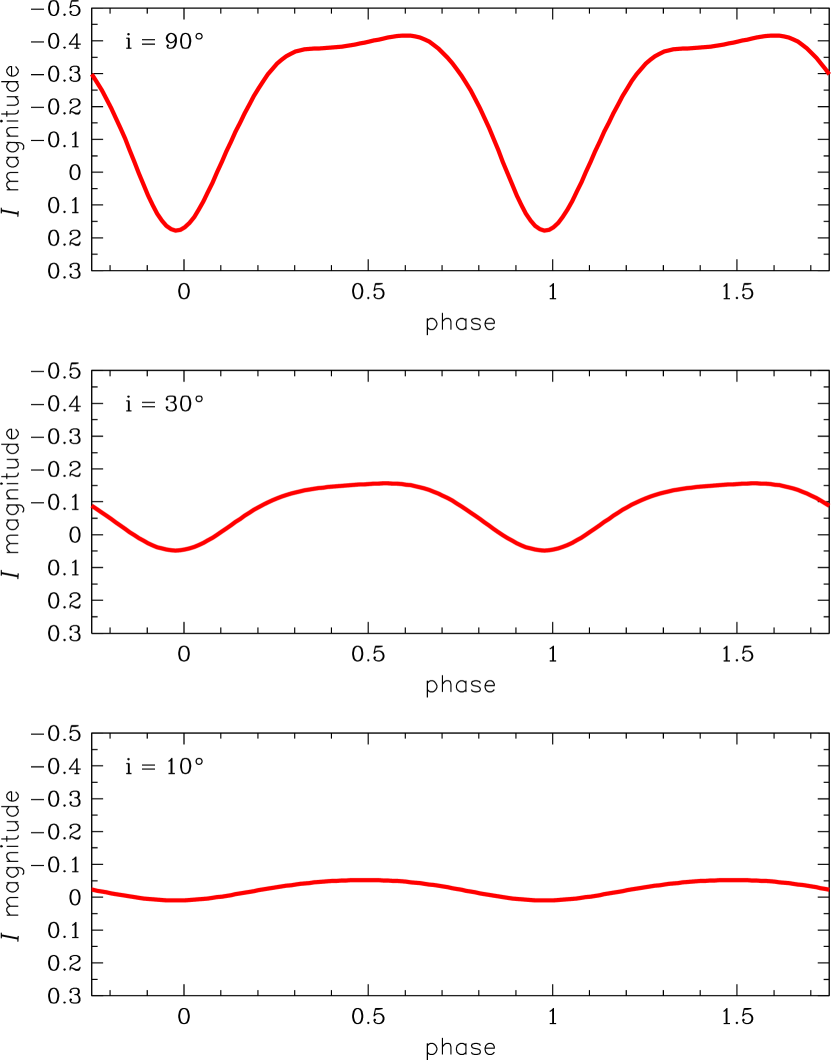
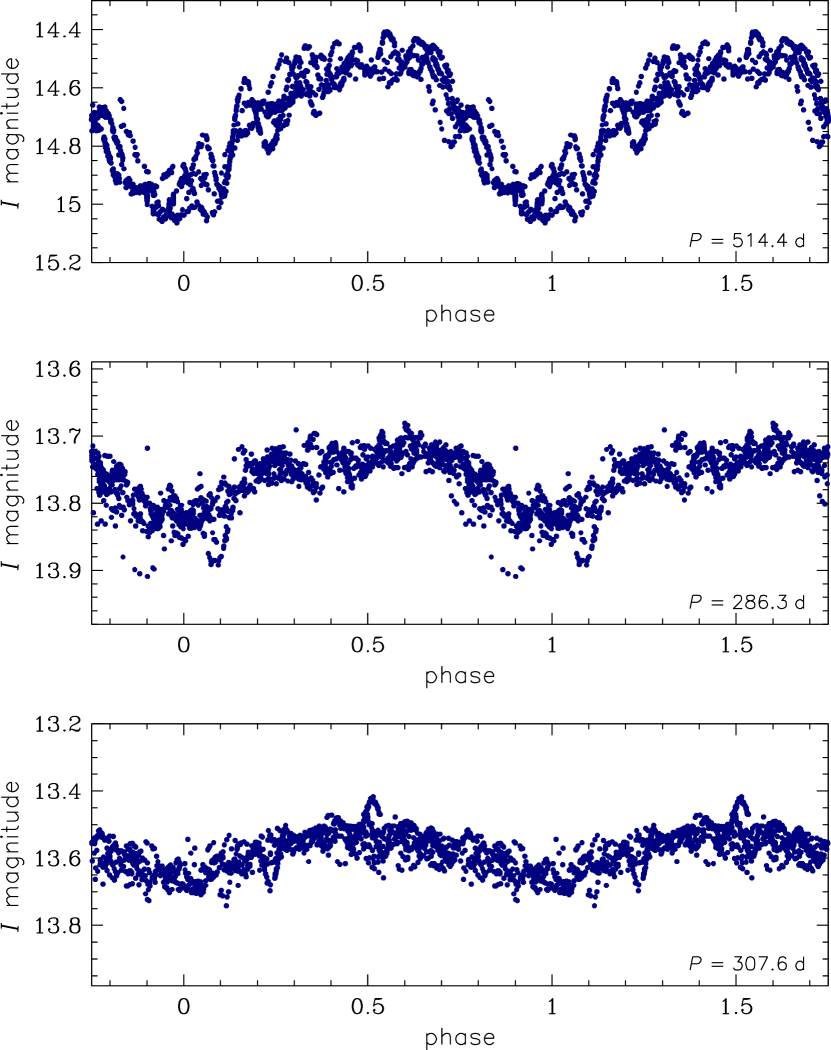
Different sets of physical and observational parameters of the binary model may result in different variants of the LSP light curves. For example, the orbital inclination influences the amplitude and shape of the light curve. In Fig. 6 we show three synthetic light curves of the same system observed with the inclinations , and , while in Fig. 7 we present light curves of three real LSP variables with very similar morphology. To obtain other kinds of LSP light curves, for example those which have a shorter duration of the flat maximum, one should assume a longer and denser tail of the dusty cloud surrounding the red giant.
4. Summary and Conclusions
Obviously, the problem of the LSP origin deserves a much more comprehensive analysis than our simple simulation, but it seems that the binary scenario is the only one that is consistent with virtually all the observational facts known for LSPs. A model with a spiral dusty cloud that follows a low-mass object on a circular orbit around the red giant well reproduces the light and radial velocity variations associated with the LSP modulation. This hypothesis naturally explains the observed large movements of the visible surface of the LSP star (Nicholls et al., 2009), the mid-infrared excess caused by the circumstellar dust around LSP variables (Wood et al., 2009), the lack of significant temperature changes during the LSP cycle (Wood et al., 2004), and the PL relation of the LSPs (sequence D) that is a direct continuation of sequence E formed by close binary systems (Soszyński et al., 2004). Large blue-to-red amplitude ratios (Derekas et al., 2006) just reflect the extinction law produced by dusty material obscuring the giant and depend on the physical properties of this matter. Changes of the amplitudes of the LSP modulation observed in some sequence D stars can be explained by variations of the mass-loss rates, which influence the size and density of the dusty cloud orbiting the red giant. The only unclear feature in our model is the reversed phase shift between the light and velocity curves. This inconsistency can be explained by a specific distribution of the circumstellar matter, but more detailed models are needed to address this problem.
A natural question that arises is the origin of the brown dwarfs in the close orbits of at least 30% of red giant stars. These low-mass objects could be former Jupiter-like planets that accreted part of the matter ejected from the giants due to stellar winds, and increased their masses to the brown dwarf range (Retter, 2005; Soszyński, 2007). If this explanation were true, the LSP giants would be excellent probes of the fraction of planets in different regions of our and other galaxies.
Another issue related to the binary explanation of the LSP phenomenon is the mechanism that keeps the low-mass object near the giant surface for a long time and prevents it being swallowed it by the giant companion. A brief discussion of this problem can be found in Soszyński et al. (2007). We do not have a definitive answer for this question, but we suspect that the low-mass object induces increased mass loss from the giant when its distance is small, which in turn causes the increase of the distance between both components. This feedback mechanism might keep a low-mass companion in a close orbit around a giant for a long time, until the SRV becomes a Mira star, and the changes of the giant radius due to pulsation become very large. Then, the secondary component sinks below the giant surface and it is completely engulfed. Therefore we do not observe LSP modulation in the Mira stars.
As a byproduct of this study, we distinguished a group of red giants with periodic variations which we interpret as caused by a dark spot on their surface. These objects also follow a PL relation, spreading between sequence C (populated by the fundamental-mode pulsators – Miras and SRVs) and sequence D (LSP). Note that Soszyński & Wood (2013) noticed a dim PL sequence located between sequences C and D for somewhat brighter giants. It is not clear if this sequence has something in common with the spotted variables identified in this work. Undoubtedly, both types of stellar activity – starspots and LSPs – deserve special attention in future studies.
Acknowledgments
We are grateful to Wojciech A. Dziembowski, Peter R. Wood and Christine P. Nicholls for carefully reading the manuscript and suggesting important corrections. We thank the anonymous referee, whose insightful comments led to several improvements of the paper. This work has been supported by the Polish National Science Centre grant No. DEC-2011/03/B/ST9/02573. We gratefully acknowledge financial support from the Polish Ministry of Science and Higher Education through the program “Ideas Plus” award No. IdP2012 000162. The research leading to these results has received funding from the European Research Council under the European Community’s Seventh Framework Programme (FP7/2007-2013)/ERC grant agreement no. 246678.
References
- Derekas et al. (2006) Derekas, A., Kiss, L. L., Bedding, T. R., Kjeldsen, H., Lah, P., & Szabó, G. M. 2006, ApJ, 650, L55
- Graczyk et al. (2011) Graczyk, D., Soszyński, I., Poleski, R., et al. 2011, Acta Astron., 61, 103
- Hinkle et al. (2002) Hinkle, K. H., Lebzelter, T., Joyce, R. R., & Fekel, F. C. 2002, AJ, 123, 1002
- Houk (1963) Houk, N. 1963, AJ, 68, 253
- Kato et al. (2007) Kato, D., Nagashima, C., Nagayama, T., et al. 2007, PASJ, 59, 615
- Mastrodemos & Morris (1998) Mastrodemos, N., & Morris, M. 1998, ApJ, 497, 303
- Nagae et al. (2004) Nagae, T., Oka, K., Matsuda, T., Fujiwara, H., Hachisu, I., & Boffin, H. M. J. 2004, A&A, 419, 335
- Nicholls et al. (2009) Nicholls, C. P., Wood, P. R., Cioni, M.-R. L., & Soszyński, I. 2009, MNRAS, 399, 2063
- Nicholls et al. (2010) Nicholls, C. P., Wood, P. R., & Cioni, M.-R. L. 2010, MNRAS, 405, 1770
- Nie et al. (2010) Nie, J. D., Zhang, X. B., & Jiang, B. W. 2010, AJ, 139, 1909
- O’Connell (1933) O’Connell, D. J. K. 1933, Harvard College Observatory Bulletin, 893, 19
- Payne-Gaposhkin (1954) Payne-Gaposhkin, C. 1954, Harvard Annals, 113, No. 4
- Pawlak et al. (2013) Pawlak, M., Graczyk, D., Soszyński, I., et al. 2013, Acta Astron., 63, 323
- Retter (2005) Retter, A. 2005, Bulletin of the American Astronomical Society, 37, 1487
- Soszyński (2007) Soszyński, I. 2007, ApJ, 660, 1486
- Soszyński et al. (2004) Soszyński, I., Udalski, A., Kubiak, M., et al. 2004, Acta Astron., 54, 347
- Soszyński et al. (2007) Soszyński, I., Dziembowski, W. A., Udalski, A., et al. 2007, Acta Astron., 57, 201
- Soszyński et al. (2009) Soszyński, I., Udalski, A., Szymański, M. K., et al. 2009, Acta Astron., 59, 239
- Soszyński et al. (2011) Soszyński, I., Udalski, A., Szymański, M. K., et al. 2011, Acta Astron., 61, 217
- Soszyński et al. (2013) Soszyński, I., Udalski, A., Szymański, M. K., et al. 2013, Acta Astron., 63, 21
- Soszyński & Wood (2013) Soszyński, I., & Wood, P. R. 2013, ApJ, 763, 103
- Theuns & Jorissen (1993) Theuns, T., & Jorissen, A. 1993, MNRAS, 265, 946
- Udalski (2003) Udalski, A. 2003, Acta Astron., 53, 291
- Wood et al. (1999) Wood, P. R., Alcock, C., Allsman, R. A., et al. 1999, in IAU Symp. 191, Asymptotic Giant Branch Stars, ed. T. Le Bertre, A. Lebre, & C. Waelkens (Cambridge: Cambridge Univ. Press), 151
- Wood et al. (2004) Wood, P. R., Olivier, E. A., & Kawaler, S. D. 2004, ApJ, 604, 800
- Wood et al. (2009) Wood, P. R., Marsden, S., Waite, I., & Nicholls, C. P. 2009, in AIP Conf. Proc. 1170, Stellar Pulsation: Challenges for Theory and Observation, ed. J. A. Guzik & P. Bradley (Melville, NY: AIP), 173
- Wood & Nicholls (2009) Wood, P. R., & Nicholls, C. P. 2009, ApJ, 707, 573