Asymptotic expression for the fixation probability of a mutant in star graphs

Fabio A. C. C. Chalub Departamento de Matemática and Centro de Matemática e Aplicações, Universidade Nova de Lisboa, Quinta da Torre, 2829-516, Caparica, Portugal. e-mail:chalub@fct.unl.pt, phone: (++351) 212948388
Abstract

We consider the Moran process in a graph called the “star” and obtain the asymptotic expression for the fixation probability of a single mutant when the size of the graph is large. The expression obtained corrects the previously known expression announced in reference [E Lieberman, C Hauert, and MA Nowak. Evolutionary dynamics on graphs. Nature, 433(7023):312–316, 2005] and further studied in [M. Broom and J. Rychtar. An analysis of the fixation probability of a mutant on special classes of non-directed graphs. Proc. R. Soc. A-Math. Phys. Eng. Sci., 464(2098):2609–2627, 2008]. We also show that the star graph is an accelerator of evolution, if the graph is large enough.

Departamento de Matemática and Centro de Matemática e Aplicações,

Universidade Nova de Lisboa, Quinta da Torre, 2829-516, Caparica, Portugal.

Keywords: Evolutionary graph theory; Moran process; Fixation probability; Asymptotic expansions; Star graph.

1 Introduction

The central question in the mathematical study of population genetics is to understand how gene frequencies vary in time. This topic has a long history, since at least the works of Wright and Fisher [1, 2]. A simpler model was introduced by Moran [3]: in that case a population of constant size n𝑛n of two types evolves in discrete time steps. To each type we attribute a positive number, called fitness. At each time one individual is selected to reproduce with probability proportional to its fitness and one to die (possibly the same one), with probability 1/n1𝑛1/n. The so called Moran process continues until the entire population consists of individuals at a given type. We say that one type has fixated while the other has become extinct. One particularly important question is the fixation probability of a given type 𝔸𝔸\mathbb{A}, i.e., the probability that after a sufficiently long time, type 𝔸𝔸\mathbb{A} reaches fixation; see [4, 5]

The Moran process is a particular case of the so called Birth-Death (BD) processes with selection on the birth. Birth-Death process are a particular case of stochastic process in which the number of individuals of a given type varies at most one per time step, i.e., transitions are allowed only between neighboring sites in an appropriate topology. The “selection at birth” indicates that the removed individual was selected using an equally distributed random variable, while the random variable indicating selection for reproduction is not necessarily identically distributed among all individuals. See, e.g., [5, 6] for further informations on BD processes.

In [7], topology, in the form of a graph, was introduced in the study of population dynamics. Individuals were represented by vertices, while edges represented possible positions for the offspring of individuals in a given vertex. In particular, consider a generic graph where all vertices but one (selected at random) are occupied by a type with fitness 1 (the resident type). The remaining vertex is occupied by a mutant with fitness r>0𝑟0r>0. After a certain fixed time, one of the individuals (resident or mutant) is selected to reproduce with probability proportional to fitness, and its offspring replaces one of the individuals occupying an adjacent vertex, selected with equal probability. This is the so called Moran process on graphs [3, 7]. The invasion probability ρ𝜌\rho is given by the probability that after a sufficiently long time all vertices are occupied by the mutant type (i.e., the mutant has fixed and the resident has become extinct). For a complete graph (all pairs of vertices are connected) with n𝑛n vertices, the invasion probability is given by ρC(r,n):=1r11rnassignsuperscript𝜌C𝑟𝑛1superscript𝑟11superscript𝑟𝑛\rho^{\mathrm{C}}(r,n):=\frac{1-r^{-1}}{1-r^{-n}} if r1𝑟1r\neq 1 and ρC(1,n):=1nassignsuperscript𝜌C1𝑛1𝑛\rho^{\mathrm{C}}(1,n):=\frac{1}{n}. This corresponds to the original problem studied in [3]. We say that a graph is an accelerator of evolution if ρ>ρC𝜌superscript𝜌C\rho>\rho^{\mathrm{C}} if and only if r>1𝑟1r>1. If one of these inequalities is reversed, we say that the graph is a suppressor of evolution. See [5] for a more detailed explanation of concepts used in this article and also for examples of accelerators and suppressors of evolution.

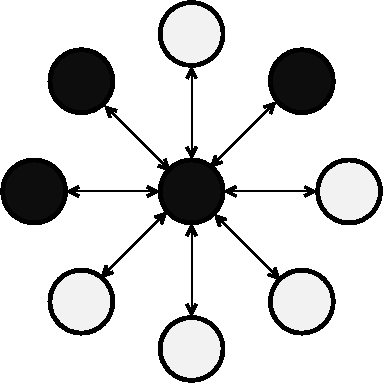
In this article, we study a specific graph, called the “star”. The star is a graph with n+1𝑛1n+1 vertices, labeled from 0 to n𝑛n, where vertex number 0 is called the center and all the others are the leaves. The only edges are between vertex 0 and all other vertices. These edges are bidirectional, see figure 1. In [7], the star graph was introduced as a particular case of a family of graphs, called the “superstar” and parameterized by two natural numbers: k𝑘k, the number of layers and n𝑛n, the number of vertices at layer k+1superscript𝑘1k^{\prime}+1, for any k<ksuperscript𝑘𝑘k^{\prime}<k, connected to any given vertex at layer ksuperscript𝑘k^{\prime}. The first layer has a single vertex, called the center. The star corresponds to k=2𝑘2k=2. According to the conjecture in [7], ρ1rk1rnk𝜌1superscript𝑟𝑘1superscript𝑟𝑛𝑘\rho\approx\frac{1-r^{-k}}{1-r^{-nk}} for n𝑛n\to\infty. However, recently [8] showed that this conjecture is false for k5𝑘5k\geq 5.

We start this article from a previous work (see [9]), where an explicit formula for the invasion probability in stars was derived and study the associated asymptotic expression when n𝑛n, the number of individuals, is large. The aim of this work is to show that the expression for the leading term for n𝑛n\to\infty and fixed r𝑟r in the asymptotic expression of the invasion probability is given by

ρ𝗅𝗈(r,n):=1r21r2ne(r21)/r.assignsubscript𝜌𝗅𝗈𝑟𝑛1superscript𝑟21superscript𝑟2𝑛superscriptesuperscript𝑟21𝑟\rho_{\mathsf{lo}}(r,n):=\frac{1-r^{-2}}{1-r^{-2n}\mathrm{e}^{(r^{2}-1)/r}}. (1)

A precise definition of ρ𝗅𝗈(r,n)subscript𝜌𝗅𝗈𝑟𝑛\rho_{\mathsf{lo}}(r,n) as the leading term of the exact expression in n𝑛n\to\infty and fixed r𝑟r is given in Eq. (3).

Refer to caption
Figure 1: Example of a star graph with n=8𝑛8n=8 (1 center and 8 leaves, totalling 9 vertices). Different colors indicates different occupancies (resident or mutant); links between vertices indicate the edges of the graph.

Note that this expression is different from the one conjectured in [7], discussed above, for the case k=2𝑘2k=2.

In section 2 we discuss the results presented in [9]. In section 3, we rigorously derive Eq. (1) and in section 4, we prove that the star is an accelerator of evolution, if n𝑛n is large enough. We study this problem numerically and present our conclusions in the final section 5.

2 Evolutionary dynamics in the star graph

In [9], the exact expression

ρn(r)=rn+r+n2rnr+1(n+1)[1+nn+rj=1n1(n+rr(nr+1))j]subscript𝜌𝑛𝑟𝑟𝑛𝑟superscript𝑛2𝑟𝑛𝑟1𝑛1delimited-[]1𝑛𝑛𝑟superscriptsubscript𝑗1𝑛1superscript𝑛𝑟𝑟𝑛𝑟1𝑗\rho_{n}(r)=\frac{\frac{r}{n+r}+\frac{n^{2}r}{nr+1}}{(n+1)\left[1+\frac{n}{n+r}\sum_{j=1}^{n-1}\left(\frac{n+r}{r(nr+1)}\right)^{j}\right]}\\ (2)

for the invasion probability of mutant with fitness r𝑟r in a star graph with n𝑛n leaves was found.

We agree with formula (2), however the asymptotic expression found in the same reference when n𝑛n\to\infty seems to not be correct. In particular, the asymptotic expression

nnrnr+1+rn+r(n+1)(1+nn+rj=1n1(n+rr(nr+1))j)11+j=1n11r2j=1r21r2n,𝑛𝑛𝑟𝑛𝑟1𝑟𝑛𝑟𝑛11𝑛𝑛𝑟superscriptsubscript𝑗1𝑛1superscript𝑛𝑟𝑟𝑛𝑟1𝑗11superscriptsubscript𝑗1𝑛11superscript𝑟2𝑗1superscript𝑟21superscript𝑟2𝑛\frac{n\frac{nr}{nr+1}+\frac{r}{n+r}}{(n+1)\cdot\left(1+\frac{n}{n+r}\sum_{j=1}^{n-1}\left(\frac{n+r}{r(nr+1)}\right)^{j}\right)}\approx\frac{1}{1+\sum_{j=1}^{n-1}\frac{1}{r^{2j}}}=\frac{1-r^{-2}}{1-r^{-2n}}\ ,

when n𝑛n\to\infty is wrong (see [9, page 2616]).

3 Asymptotic Expression

In this section, we will show that the associated asymptotic expression for ρn(r)subscript𝜌𝑛𝑟\rho_{n}(r), when n𝑛n\to\infty, is given by

ρn(r)=ρ𝗅𝗈(r,n)(1+𝒪(n1)),subscript𝜌𝑛𝑟subscript𝜌𝗅𝗈𝑟𝑛1𝒪superscript𝑛1\rho_{n}(r)=\rho_{\mathsf{lo}}(r,n)\left(1+\mathop{\mathcal{O}}\left(n^{-1}\right)\right)\ , (3)

where ρ(r,n)𝜌𝑟𝑛\rho(r,n) was defined in Eq. (1).

If r1𝑟1r\neq 1, Eq. (2) can be simplified to

ρn(r)=rn+1n3+n2r+nr+1n2r+nr2+n+r{1+nn+r[n+rr(nr+1)(n+rr(nr+1))n1n+rr(nr+1)]}1.subscript𝜌𝑛𝑟𝑟𝑛1superscript𝑛3superscript𝑛2𝑟𝑛𝑟1superscript𝑛2𝑟𝑛superscript𝑟2𝑛𝑟superscript1𝑛𝑛𝑟delimited-[]𝑛𝑟𝑟𝑛𝑟1superscript𝑛𝑟𝑟𝑛𝑟1𝑛1𝑛𝑟𝑟𝑛𝑟11\rho_{n}(r)=\frac{r}{n+1}\frac{n^{3}+n^{2}r+nr+1}{n^{2}r+nr^{2}+n+r}\left\{1+\frac{n}{n+r}\left[\frac{\frac{n+r}{r(nr+1)}-\left(\frac{n+r}{r(nr+1)}\right)^{n}}{1-\frac{n+r}{r(nr+1)}}\right]\right\}^{-1}\ . (4)

Now, we consider the asymptotic expression of ρn(r)subscript𝜌𝑛𝑟\rho_{n}(r) when n𝑛n\to\infty and r1𝑟1r\neq 1. Note first that

rn+1n3+n2r+nr+1n2r+nr2+n+r=1+𝒪(n1).𝑟𝑛1superscript𝑛3superscript𝑛2𝑟𝑛𝑟1superscript𝑛2𝑟𝑛superscript𝑟2𝑛𝑟1𝒪superscript𝑛1\frac{r}{n+1}\frac{n^{3}+n^{2}r+nr+1}{n^{2}r+nr^{2}+n+r}=1+\mathop{\mathcal{O}}\left(n^{-1}\right)\ .

Furthermore

1+nn+r[n+rr(nr+1)(n+rr(nr+1))n1n+rr(nr+1)]=1+1r21[1(n+rr(nr+1))n1]1𝑛𝑛𝑟delimited-[]𝑛𝑟𝑟𝑛𝑟1superscript𝑛𝑟𝑟𝑛𝑟1𝑛1𝑛𝑟𝑟𝑛𝑟111superscript𝑟21delimited-[]1superscript𝑛𝑟𝑟𝑛𝑟1𝑛11+\frac{n}{n+r}\left[\frac{\frac{n+r}{r(nr+1)}-\left(\frac{n+r}{r(nr+1)}\right)^{n}}{1-\frac{n+r}{r(nr+1)}}\right]\\ =1+\frac{1}{r^{2}-1}\left[1-\left(\frac{n+r}{r(nr+1)}\right)^{n-1}\right] (5)

We also write

n+rr(nr+1)=1r2×1+r1n+11+1rr(n+1)=1r2(1+r21nr+𝒪(n2)).𝑛𝑟𝑟𝑛𝑟11superscript𝑟21𝑟1𝑛111𝑟𝑟𝑛11superscript𝑟21superscript𝑟21𝑛𝑟𝒪superscript𝑛2\frac{n+r}{r(nr+1)}=\frac{1}{r^{2}}\times\frac{1+\frac{r-1}{n+1}}{1+\frac{1-r}{r(n+1)}}=\frac{1}{r^{2}}\left(1+\frac{r^{2}-1}{nr}+\mathop{\mathcal{O}}\left(n^{-2}\right)\right)\ .

Now, we use that

(1+xn+𝒪(n2))n=enlog(1+xn+𝒪(n2))=ex+𝒪(n1)=ex[1+𝒪(n1)].superscript1𝑥𝑛𝒪superscript𝑛2𝑛superscripte𝑛1𝑥𝑛𝒪superscript𝑛2superscripte𝑥𝒪superscript𝑛1superscripte𝑥delimited-[]1𝒪superscript𝑛1\left(1+\frac{x}{n}+\mathop{\mathcal{O}}\left(n^{-2}\right)\right)^{n}=\mathrm{e}^{n\log\left(1+\frac{x}{n}+\mathop{\mathcal{O}}\left(n^{-2}\right)\right)}=\mathrm{e}^{x+\mathop{\mathcal{O}}\left(n^{-1}\right)}=\mathrm{e}^{x}\left[1+\mathop{\mathcal{O}}\left(n^{-1}\right)\right]\ .

and then

(n+rr(nr+1))n1=e(r21)/rr2(n1)(1+𝒪(n1)).superscript𝑛𝑟𝑟𝑛𝑟1𝑛1superscriptesuperscript𝑟21𝑟superscript𝑟2𝑛11𝒪superscript𝑛1\left(\frac{n+r}{r(nr+1)}\right)^{n-1}=\frac{\mathrm{e}^{(r^{2}-1)/r}}{r^{2(n-1)}}\left(1+\mathop{\mathcal{O}}\left(n^{-1}\right)\right)\ . (6)

We put together Eqs. (5) and (6) and find

1+nn+r[n+rr(nr+1)(n+rr(nr+1))n1n+rr(nr+1)]1𝑛𝑛𝑟delimited-[]𝑛𝑟𝑟𝑛𝑟1superscript𝑛𝑟𝑟𝑛𝑟1𝑛1𝑛𝑟𝑟𝑛𝑟1\displaystyle 1+\frac{n}{n+r}\left[\frac{\frac{n+r}{r(nr+1)}-\left(\frac{n+r}{r(nr+1)}\right)^{n}}{1-\frac{n+r}{r(nr+1)}}\right]
=1+1r211r21e(r21)/rr2(n1)(1+𝒪(n1))absent11superscript𝑟211superscript𝑟21superscriptesuperscript𝑟21𝑟superscript𝑟2𝑛11𝒪superscript𝑛1\displaystyle\qquad=1+\frac{1}{r^{2}-1}-\frac{1}{r^{2}-1}\frac{\mathrm{e}^{(r^{2}-1)/r}}{r^{2(n-1)}}\left(1+\mathop{\mathcal{O}}\left(n^{-1}\right)\right)
=11r211r2e(r21)/rr2n(1+𝒪(n1))absent11superscript𝑟211superscript𝑟2superscriptesuperscript𝑟21𝑟superscript𝑟2𝑛1𝒪superscript𝑛1\displaystyle\qquad=\frac{1}{1-r^{-2}}-\frac{1}{1-r^{-2}}\frac{\mathrm{e}^{(r^{2}-1)/r}}{r^{2n}}\left(1+\mathop{\mathcal{O}}\left(n^{-1}\right)\right)
=1r2ne(r21)/r1r2(1+𝒪(n1)).absent1superscript𝑟2𝑛superscriptesuperscript𝑟21𝑟1superscript𝑟21𝒪superscript𝑛1\displaystyle\qquad=\frac{1-r^{-2n}\mathrm{e}^{(r^{2}-1)/r}}{1-r^{-2}}\left(1+\mathop{\mathcal{O}}\left(n^{-1}\right)\right)\ .

Gathering all asymptotic expansions, and using the definition (3), we find expression (1).

4 The star is an accelerator of evolution

Now, let us compare the Moran process in the star and in the complete graph.

For neutral evolution (r=1𝑟1r=1), we have the following simple result:

Lemma 1.

ρn(1)=1n+1=ρC(1,n+1)subscript𝜌𝑛11𝑛1superscript𝜌C1𝑛1\rho_{n}(1)=\frac{1}{n+1}=\rho^{\mathrm{C}}(1,n+1).

Proof.

See Eq. (2) with r=1𝑟1r=1. Equivalently, this result can be proved from Eq. (4) in the limit r1𝑟1r\to 1. ∎

A similar result is valid for a large class of graphs; in particular, it is valid for graphs with at most one root (a root is a vertex with no edge leading to it). However, a single mutant cannot invade a graph with two or more roots, and, in this case, the invasion probability is equal to zero. See [5].

Note that limr1ρ(r,n)=1n11n+1subscript𝑟1𝜌𝑟𝑛1𝑛11𝑛1\lim_{r\to 1}\rho(r,n)=\frac{1}{n-1}\neq\frac{1}{n+1}, showing that the large population limit n𝑛n\to\infty and the weak selection limit r1𝑟1r\to 1 are not interchangeable.

For r1𝑟1r\neq 1, we show that the star is an accelerator of evolution:

Theorem 1.

Consider r>1𝑟1r>1 (r<1𝑟1r<1). Then, for n𝑛n large enough, ρn(r)>ρC(r,n+1)subscript𝜌𝑛𝑟superscript𝜌C𝑟𝑛1\rho_{n}(r)>\rho^{\mathrm{C}}(r,n+1) (<<, respect.), and therefore the star is an accelerator of evolution.

Proof.

We initially see that

limnρ𝗅𝗈(r,n)ρC(r2,n+1)=limn1r2(n+1)1r2ne(r21)/r={r2e(r21)/r>1,r<1,1,r>1.subscript𝑛subscript𝜌𝗅𝗈𝑟𝑛superscript𝜌Csuperscript𝑟2𝑛1subscript𝑛1superscript𝑟2𝑛11superscript𝑟2𝑛superscriptesuperscript𝑟21𝑟casessuperscript𝑟2superscriptesuperscript𝑟21𝑟1𝑟11𝑟1\lim_{n\to\infty}\frac{\rho_{\mathsf{lo}}(r,n)}{\rho^{\mathrm{C}}(r^{2},n+1)}=\lim_{n\to\infty}\frac{1-r^{-2(n+1)}}{1-r^{-2n}\mathrm{e}^{(r^{2}-1)/r}}=\left\{\begin{array}[]{ll}r^{-2}\mathrm{e}^{-(r^{2}-1)/r}>1\ ,&\quad r<1\ ,\\ 1\ ,&\quad r>1\ .\end{array}\right.

On the other hand

ρC(r2,n+1)ρC(r,n+1)=(1r(n+1))(1r2)(1r2(n+1))(1r1).superscript𝜌Csuperscript𝑟2𝑛1superscript𝜌C𝑟𝑛11superscript𝑟𝑛11superscript𝑟21superscript𝑟2𝑛11superscript𝑟1\frac{\rho^{\mathrm{C}}(r^{2},n+1)}{\rho^{\mathrm{C}}(r,n+1)}=\frac{(1-r^{-(n+1)})(1-r^{-2})}{(1-r^{-2(n+1)})(1-r^{-1})}\ .

Taking the limit n𝑛n\to\infty, we find

limnρC(r2,n+1)ρC(r,n+1)={0,r<1,1r21r1=r+1r,r>1.subscript𝑛superscript𝜌Csuperscript𝑟2𝑛1superscript𝜌C𝑟𝑛1cases0𝑟11superscript𝑟21superscript𝑟1𝑟1𝑟𝑟1\lim_{n\to\infty}\frac{\rho^{\mathrm{C}}(r^{2},n+1)}{\rho^{\mathrm{C}}(r,n+1)}=\left\{\begin{array}[]{ll}0\ ,&\quad r<1\ ,\\ \frac{1-r^{-2}}{1-r^{-1}}=\frac{r+1}{r}\ ,&\quad r>1\ .\end{array}\right.

Finally, we write

ρn(r)ρC(r,n+1)=(1+𝒪(n1))×ρ𝗅𝗈(r,n)ρC(r2,n+1)×ρC(r2,n+1)ρC(r,n+1)subscript𝜌𝑛𝑟superscript𝜌C𝑟𝑛11𝒪superscript𝑛1subscript𝜌𝗅𝗈𝑟𝑛superscript𝜌Csuperscript𝑟2𝑛1superscript𝜌Csuperscript𝑟2𝑛1superscript𝜌C𝑟𝑛1\frac{\rho_{n}(r)}{\rho^{\mathrm{C}}(r,n+1)}=\left(1+\mathop{\mathcal{O}}\left(n^{-1}\right)\right)\times\frac{\rho_{\mathsf{lo}}(r,n)}{\rho^{\mathrm{C}}(r^{2},n+1)}\times\frac{\rho^{\mathrm{C}}(r^{2},n+1)}{\rho^{\mathrm{C}}(r,n+1)} (7)

and taking the limit n𝑛n\to\infty, we conclude that

limnρn(r)ρC(r,n+1)={0,r<1,r+1r>1,r>1.subscript𝑛subscript𝜌𝑛𝑟superscript𝜌C𝑟𝑛1cases0𝑟1𝑟1𝑟1𝑟1\lim_{n\to\infty}\frac{\rho_{n}(r)}{\rho^{\mathrm{C}}(r,n+1)}=\left\{\begin{array}[]{ll}0\ ,&\quad r<1\ ,\\ \frac{r+1}{r}>1\ ,&\quad r>1\ .\end{array}\right.

For n𝑛n large enough ρn(r)>ρC(r,n+1)subscript𝜌𝑛𝑟superscript𝜌C𝑟𝑛1\rho_{n}(r)>\rho^{\mathrm{C}}(r,n+1) if and only if r>1𝑟1r>1. ∎

5 Discussion

Despite the fact that the expression conjectured in [7] is wrong for k=2𝑘2k=2 and k5𝑘5k\geq 5, it has been widely used (e.g., [10, 11, 12]). However, exact or asymptotic expressions for k>2𝑘2k>2 have not been found and should be the subject of further investigations. See also [13, 14] for a review of evolutionary graph theory.

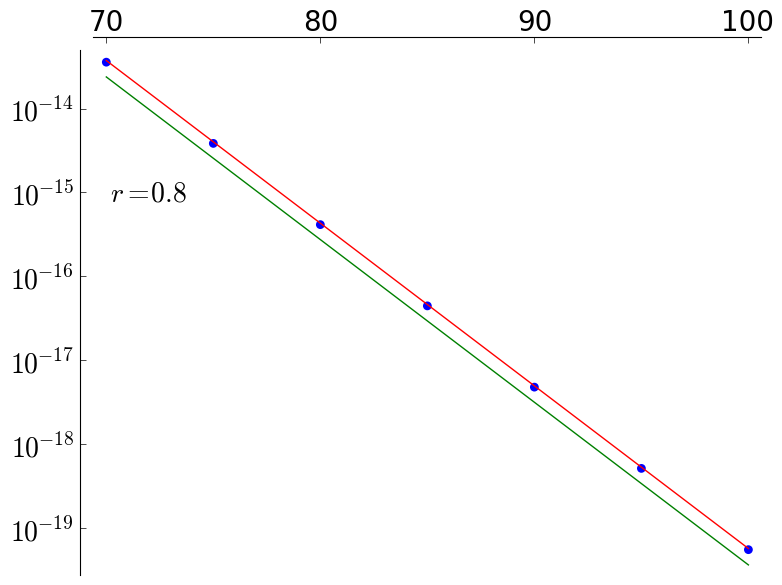
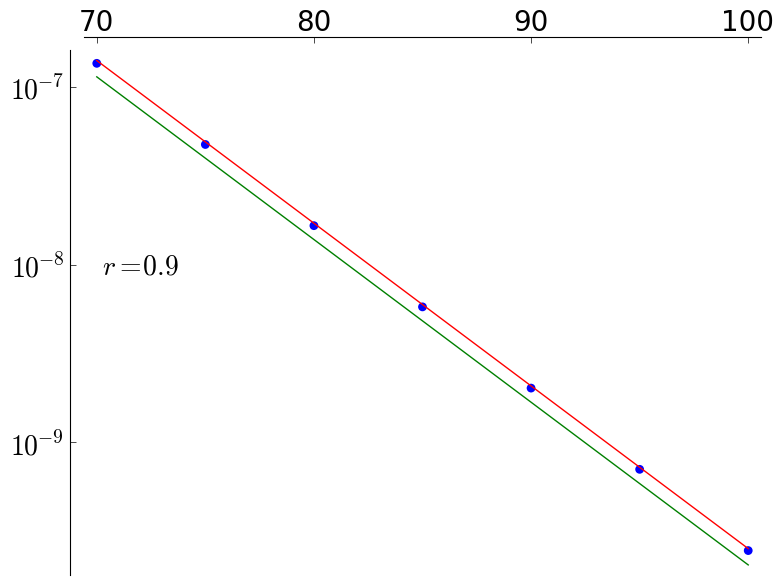
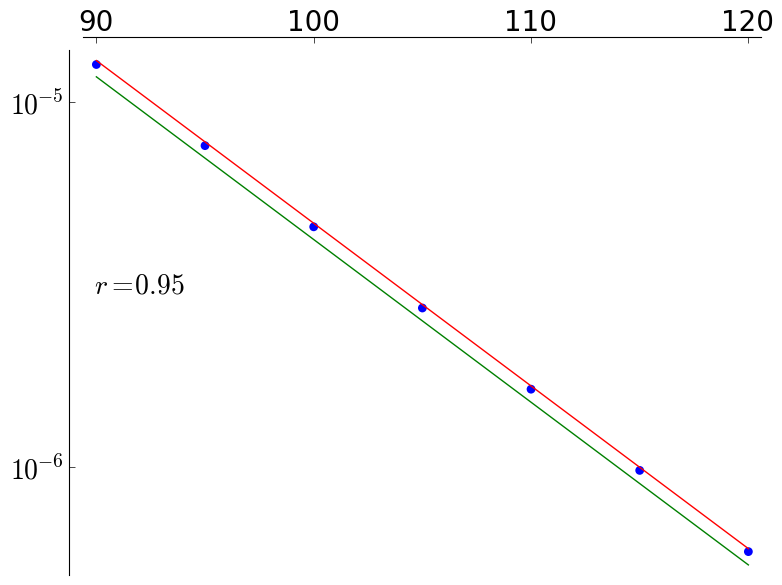
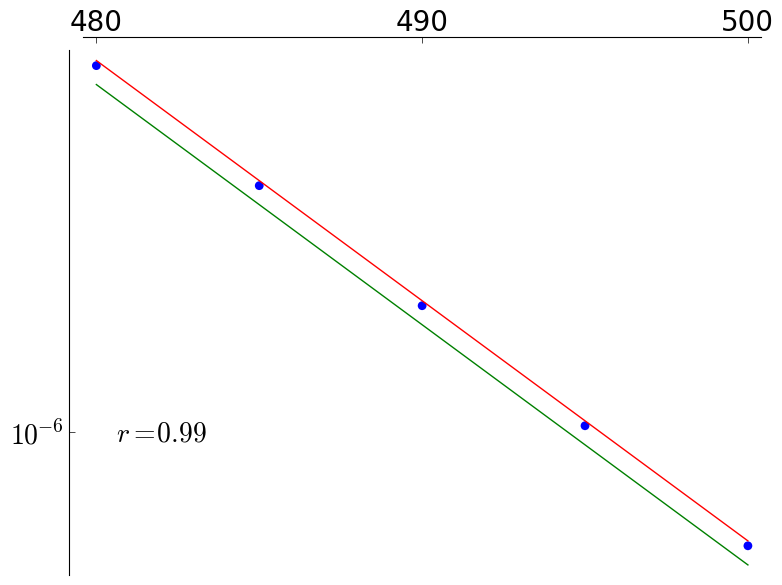
Differences between expression (1) and the expression 1r21r2n1superscript𝑟21superscript𝑟2𝑛\frac{1-r^{-2}}{1-r^{-2n}} given by [9] and [7] are hardly noticeable from the numerical point of view. In fact, for r>1𝑟1r>1, the difference between both expressions are exponentially small, as rn0superscript𝑟𝑛0r^{-n}\to 0 exponentially fast when n𝑛n\to\infty. However, for r<1𝑟1r<1 these differences, despite being small, cannot be neglected. See table 1 and figure 2 for numerical comparisons.

r𝑟r n𝑛n ρn(r)subscript𝜌𝑛𝑟\rho_{n}(r) ρ𝗅𝗈(r,n)subscript𝜌𝗅𝗈𝑟𝑛\rho_{\mathsf{lo}}(r,n) ϵitalic-ϵ\epsilon 1r21r2n1superscript𝑟21superscript𝑟2𝑛\frac{1-r^{-2}}{1-r^{-2n}} ϵitalic-ϵ\epsilon
0.8000.8000.800 500500500 1.08×10971.08superscript10971.08\times 10^{-97} 1.09×10971.09superscript10971.09\times 10^{-97} 0.006290.006290.00629 6.92×10986.92superscript10986.92\times 10^{-98} 0.3580.3580.358
0.8000.8000.800 100010001000 1.33×101941.33superscript101941.33\times 10^{-194} 1.34×101941.34superscript101941.34\times 10^{-194} 0.003200.003200.00320 8.51×101958.51superscript101958.51\times 10^{-195} 0.3600.3600.360
0.9000.9000.900 500500500 5.04×10475.04superscript10475.04\times 10^{-47} 5.06×10475.06superscript10475.06\times 10^{-47} 0.005090.005090.00509 4.10×10474.10superscript10474.10\times 10^{-47} 0.1860.1860.186
0.9000.9000.900 100010001000 8.83×10938.83superscript10938.83\times 10^{-93} 8.85×10938.85superscript10938.85\times 10^{-93} 0.002550.002550.00255 7.17×10937.17superscript10937.17\times 10^{-93} 0.1880.1880.188
0.9500.9500.950 100010001000 3.34×10463.34superscript10463.34\times 10^{-46} 3.35×10463.35superscript10463.35\times 10^{-46} 0.002240.002240.00224 3.03×10463.03superscript10463.03\times 10^{-46} 0.09550.09550.0955
0.9500.9500.950 500050005000 2.06×102242.06superscript102242.06\times 10^{-224} 2.06×102242.06superscript102242.06\times 10^{-224} 0.0004480.0004480.000448 1.86×102241.86superscript102241.86\times 10^{-224} 0.09710.09710.0971
0.9900.9900.990 100010001000 3.85×10113.85superscript10113.85\times 10^{-11} 3.86×10113.86superscript10113.86\times 10^{-11} 0.002030.002030.00203 3.78×10113.78superscript10113.78\times 10^{-11} 0.01790.01790.0179
0.9900.9900.990 500050005000 4.66×10464.66superscript10464.66\times 10^{-46} 4.66×10464.66superscript10464.66\times 10^{-46} 0.0004590.0004590.000459 4.57×10464.57superscript10464.57\times 10^{-46} 0.01950.01950.0195
1.011.011.01 100010001000 0.01970.01970.0197 0.01970.01970.0197 0.002040.002040.00204 0.01970.01970.0197 0.002040.002040.00204
1.051.051.05 100010001000 0.09280.09280.0928 0.09300.09300.0930 0.001970.001970.00197 0.09300.09300.0930 0.001970.001970.00197
1.011.011.01 500050005000 0.01970.01970.0197 0.01970.01970.0197 0.0004840.0004840.000484 0.01970.01970.0197 0.0004840.0004840.000484
1.051.051.05 500050005000 0.09290.09290.0929 0.09300.09300.0930 0.0004100.0004100.000410 0.09300.09300.0930 0.0004100.0004100.000410
Table 1: Invasion probabilities for different values of r𝑟r and n1much-greater-than𝑛1n\gg 1: ρnsubscript𝜌𝑛\rho_{n} indicates the exact value given by Eq. (2); in the third column, we compute the approximate value given by Eq. (1) and its associated error ϵ=|ρ𝗅𝗈(r,n)ρn(r)|/ρn(r)italic-ϵsubscript𝜌𝗅𝗈𝑟𝑛subscript𝜌𝑛𝑟subscript𝜌𝑛𝑟\epsilon=|\rho_{\mathsf{lo}}(r,n)-\rho_{n}(r)|/\rho_{n}(r); the last column indicates the approximation in references [7, 5, 9] and its associated error. Note that for r>1𝑟1r>1, the two approximations are essentially equivalent; for r<1𝑟1r<1 the first approximation is clearly superior. All calculations were performed in Sage v. 5.13.
Refer to caption
Refer to caption
Refer to caption
Refer to caption
Figure 2: (Color online) For different values of n𝑛n (x𝑥x axis), we plot ρn(r)subscript𝜌𝑛𝑟\rho_{n}(r) (blue dots), ρ𝗅𝗈(n,r)subscript𝜌𝗅𝗈𝑛𝑟\rho_{\mathsf{lo}}(n,r) (red line) and 1r21r2n1superscript𝑟21superscript𝑟2𝑛\frac{1-r^{-2}}{1-r^{-2n}} (green line). We use a logarithmic scale in the y𝑦y axis. Note that the red line is consistently a better approximation than the green one with respect to the exact values.

Acknowledgements

This work was supported by CMA/FCT/UNL and FCT/Portugal, under the project UID/MAT/00297/2013. FACCC has also a “Investigador FCT” (FCT/Portugal) grant. FACCC also thanks the careful reading of the manuscript by the referees, in particular an inconsistency pointed out by one of the reviewers that allowed an improvement in the statement and proof of Theorem 1.

References

  • [1] S Wright. Evolution in mendelian populations. Genetics, 16(2):0097–0159, MAR 1931.
  • [2] R. A. Fisher. The Genetical Theory of Natural Selection. Clarendon Press, Oxford.
  • [3] P.A.P. Moran. The statistical processes of evolutionary theory. Clarendon, Oxford, 1962.
  • [4] Arne Traulsen, Martin A. Nowak, and Jorge M. Pacheco. Stochastic dynamics of invasion and fixation. Phys. Rev. E, 74:011909, Jul 2006.
  • [5] Martin A. Nowak. Evolutionary Dynamics: Exploring the Equations of Life. The Belknap Press of Harvard University Press, Cambridge, MA, 2006.
  • [6] Mark Broom and Jan Rychtář. Game-theoretical models in biology. CRC Press, Boca Raton, FL, 2013.
  • [7] E Lieberman, C Hauert, and MA Nowak. Evolutionary dynamics on graphs. Nature, 433(7023):312–316, JAN 20 2005.
  • [8] Josep Diaz, Leslie Ann Goldberg, George B. Mertzios, David Richerby, Maria Serna, and Paul G. Spirakis. On the fixation probability of superstars. Proc. R. Soc. A-Math. Phys. Eng. Sci., 469(2156), AUG 8 2013.
  • [9] M. Broom and J. Rychtar. An analysis of the fixation probability of a mutant on special classes of non-directed graphs. Proc. R. Soc. A-Math. Phys. Eng. Sci., 464(2098):2609–2627, OCT 8 2008.
  • [10] Marcus Frean, Paul B. Rainey, and Arne Traulsen. The effect of population structure on the rate of evolution. Proc. R. Soc. B-Biol. Sci., 280(1762), JUL 7 2013.
  • [11] Chunming Zhang, Yingjiang Wu, Wanping Liu, and Xiaofan Yang. Fixation Probabilities on Complete Star and Bipartite Digraphs. Discrete Dyn. Nat. Soc., 2012.
  • [12] M. Broom, C. Hadjichrysanthou, and J. Rychtar. Evolutionary games on graphs and the speed of the evolutionary process. Proc. R. Soc. A-Math. Phys. Eng. Sci., 466(2117):1327–1346, MAY 8 2010.
  • [13] Benjamin Allen, Martin Nowak. Games on graphs. EMS Surv. Math. Sci., 1:113–151, 2014.
  • [14] Paulo Shakarian, Patrick Roos, and Anthony Johnson. A review of evolutionary graph theory with applications to game theory. Biosystems, 107(2):66–80, FEB 2012.