Optical supernova remnants in nearby galaxies and their influence on star formation rates derived from H emission
Abstract
In this paper we present the most up-to-date list of nearby galaxies with optically detected supernova remnants (SNRs). We discuss the contribution of the H flux from the SNRs to the total H flux and its influence on derived star formation rate (SFR) for 18 galaxies in our sample. We found that the contribution of SNRs’ flux to the total H flux is %. Due to the observational selection effects, the SNRs contamination of SFRs derived herein represents only a lower limit.
keywords:
galaxies: ISM – galaxies: star formation – ISM: supernova remnants – stars: formation.1 Introduction
Understanding and modeling the star formation rates (SFRs) are the central goals of the theory of star formation. SFR is one of the crucial ingredients of cosmological simulations of galaxy formation, and these simulations demonstrate the impact of SFR models on galaxy evolution. The SFR has been a major issue in astrophysics since the 1970 s, and during the last two decades, the cosmic star formation history of the universe has been widely studied in order to better constrain galaxy formation and evolution models.111Some recent models, however, show that galaxies self-regulate – star formation is regulated by stellar feedback (radiation, stellar winds and supernovae) limiting the amount of very dense gas available for forming stars (Hopkins, Quataert & Murray 2011). Large-area surveys and use of larger telescopes have improved our knowledge of SFRs at low to intermediate redshifts (; see Hopkins & Beacom 2006) and beyond that (e.g. Karim et al. 2011, Sobral et al. 2013). These studies show strong decrease of SFR toward present epoch, and they suggest that the star formation activity over the last 11 Gyrs is responsible for producing 95 per cent of the total stellar mass density observed locally.
Determination of SFRs in galaxies through the Hubble sequence provides vital clues to the evolutionary histories of galaxies. Measured SFRs are spread along six orders of magnitude (when normalized by galaxy mass), from almost zero in gas-poor elliptical, disk and dwarf galaxies, up to 100 M, in optically-selected starburst galaxies, or even more in the most luminous infrared starburst galaxies (Kennicutt 1998).
The first quantitative SFRs were derived from evolutionary synthesis models of galaxy colours (Searle, Sargent & Bagnuolo 1973). Further on, more precise diagnostic tools were made using integrated emission-line fluxes (Kennicutt 1983), near-ultraviolet continuum fluxes (Donas & Deharveng 1984), and infrared continuum fluxes (Rieke & Lebofsky 1978). Nowadays, many different properties are used as star formation tracers, with the goal of directly or indirectly targeting continuum or line emission that is sensitive to the short-lived massive stars. Also, different techniques are used depending on whether we measure SFRs for the whole galaxy, or for regions within a galaxy (e.g. molecular clouds). The most common approach for measuring SFRs in resolved regions is to count individual objects (e.g. young stellar objects) or events (e.g. supernovae) that trace the recent star formation. Calibrations of SFR indicators have been made from the X-rays, ultraviolet (UV), via the optical and infrared (IR), all the way to the radio waves, using both continuum and line emission. For the most recent review on the latest achievements in the field see Kennicutt & Evans (2012), as well as the previous review by Kennicutt (1998).
In this paper, we focus on better constraining SFRs from the H emission line. The next section will introduce star formation measurements from this emission line.
1.1 Star Formation Rates from H flux
The nebular emission lines are very effective in re-emitting stellar luminosity, and thus provide direct measurement of young stellar content in the galaxy. This is especially the case for H line, observationally the strongest among the recombination lines from regions of ionized gas surrounding young hot stars (H ii regions). Only stars with masses exceeding 10 Solar masses contribute significantly to the stellar flux which can ionize interstellar medium (ISM). Also, these stars have a lifetime shorter then 20 Myr, so the emission lines give us almost instantaneous SFRs, independent of previous star formation histories. The conversion factor between integrated emission-line luminosity and SFR is computed using stellar evolutionary synthesis models. While calibrations have been published by numerous authors, here we use the calibration from Kennicutt, Tamblyn & Congdon (1994), which assumes solar abundances and the Salpeter initial mass function (IMF) (Salpeter 1955) for stellar masses in range 0.1-100M☉:
| (1) |
where calibration coefficient yields for the Case B recombination at . There is a significant variation among published values for this calibration coefficient (). The differences in coefficient values originate in the usage of different stellar evolution, atmosphere models and IMFs.
The method for deriving SFRs from the H flux is one of the most used methods due to the advantages of optical observations and strength of the H line. The star formation in nearby galaxies can be mapped at high resolution even with small telescopes, and the H line can be detected in the redshifted spectra of starburst galaxies up to (Bechtold et al. 1997, Geach et al. 2008, Sobral et al. 2013).
The main limitations of the method are its sensitivity to uncertainties in extinction and the IMF, and the assumption that all of the massive star formation is traced by the ionized gas. There is a fraction between 15% - 50%, of ionizing radiation which escapes from H ii regions. This can be measured either directly (Oey & Kennicutt 1997), or from the observations of the diffuse H emission in nearby galaxies. In their analysis of diffuse H emission Ferguson et al. (1996) found that diffuse ionized gas is photoionized by Lyman continuum photons which have escaped from H ii regions. Therefore, diffuse H emission should be included when this SFR measurement method is used.
The dominant source of systematic error in SFR measurements from H fluxes is extinction within the galaxy observed. Internal extinction can be corrected by combining H line and IR continuum emission or radio data (Kennicutt et al. 2009), which are not affected by the extinction. Mean extinction values range from A(H)=0.5 mag to A(H)=1.8 mag (see Kennicutt (1998) and James et al. (2005) and references therein), depending on the galaxy type and luminosity. As this extinction correction comes with large uncertainty, and therefore represents a large change (2 - 3 times higher) in derived fluxes, this correction was usually not applied when calculating SFRs. With recent IR surveys (Spitzer, Herschel, WISE), which give estimates on dust amount in nearby galaxies, extinction correction is more commonly considered.
Also, we emphasize the importance of eliminating H flux contaminants when calculating SFRs from H emission. Emission spectra from H ii regions show that very close to the H line, on both sides, are [N ii] lines at 654.8 nm and 658.3 nm. Most of the filters used to extract H line also let some of the [N ii] emission pass through. Using different methods, this problem can be minimized. However, it leaves some uncertainty in derived H fluxes. Using spectroscopic observations, we can calculate the ratio between H and [N ii] lines, and using filter profiles, we can obtain corrections for [N ii] contamination. Another possibility is to use very narrow [N ii] filters for deriving this correction (James et al. 2005). However, because of gradient in [N ii] abundances with change of galactocentric distance, one should be careful when applying any correction. The most commonly used corrections for [N ii] emission for entire galaxies are those derived by Kennicutt (1983) and Kennicutt & Kent (1983). Using Sloan Digital Sky Survey Data Release 4 galaxies (SDSS DR4, Adelman-McCarthy et al. 2006), a simple correction has also been derived by Villar et al. (2008) and presented by Sobral et al. (2012) and is now widely used.
Another origin of H flux contamination are the sources which emit H radiation, but which are not H ii regions surrounding young high-mass OB stars. There is a wide range of such objects which cause overestimate in SFRs: another emission nebulae - planetary nebulae (PNe) and SNRs; active galactic nuclei (AGNs); ultraluminous X-ray sources (ULXs) and their surrounding nebulae; micro-quasars; foreground stars with H emission; superbubbles. None of these types of objects have so far been thoroughly discussed as possible sources of systematic error in H flux-based determination of SFRs.
In some papers, there are efforts to exclude emission from PNe when making catalogues of H ii regions and estimating SFRs. Azimlu, Marciniak & Barmby (2011) did this for M31 galaxy, and when they removed all PNe candidates, they found that PNe were responsible for 1% of the total measured H emission. The problem with PNe, as well as with SNRs, is that they are hard to differentiate from compact H ii regions based on H emission only. Additional observations in narrow band filters can certainly distinguish between different emission nebulae types. Also, PNe are much smaller in sizes, when compared to the majority of H ii regions. HII regions can be compact, the same in size as PNe - smaller than a parsec, if they are excited only by a single star, but H ii regions are generally larger, being excited by multiple young massive stars, or even clusters. On the other hand, SNRs can be also different in sizes, from being compact (few parsecs), to huge (up to the 100pc; Čajko, Crawford & Filipović (2009)), depending on the phase of their evolution, as well as on input energy from SN explosion and surrounding ISM density.
Some AGNs are prominent in H line from their broad-line and narrow-line regions (it depends on the redshift and the inclination angle). But, considering their small size, and certainly a modest number of them which could be detected in the projection of a single galaxy, their contribution to the total H flux of a galaxy would be negligible. On the other hand, there are efforts to exclude AGNs from a sample of star-forming galaxies at some higher redshift, which are studied for SFRs (Garn et al. 2010, Villar et al. 2011).
ULX sources are compact X-ray sources that are located away from the nucleus of their host galaxy, emitting well above the Eddington limit of a 20M☉ black hole (LX erg s-1). Recently, more and more ULX sources have been detected with strange nebular emission surrounding it. Some of them are IC342 X-1 source in IC342 galaxy (Roberts et al. 2003, Abolmasov et al. 2007, Feng & Kaaret 2008), Holmberg IX X-1 in Holmberg IX galaxy (Fabbiano 1988, Gladstone, Roberts, & Done 2009, Moon et al. 2011, Grisé et al. 2011) and MF 16 (nomenclature from Matonick & Fesen 1997) in NGC6946 (Roberts & Colbert 2003). Most likely this nebular emission is coming from the accretion disks. Such nebulae are also prominent in H line and, as such, are potential contaminants of H flux and instantaneous SFRs. Of course, ULX sources can be regarded as tracers of some past SFRs. In NGC6946 galaxy, flux of the MF16 is responsible for 0.1% of the total H flux, as is the case with IC342 galaxy and IC342 X-1 source. On the other hand, as Andjelić (2011) has shown, H derived SFRs for Holmberg IX galaxy can be significantly changed if nebular emission from the ULX is removed from the integrated H flux of the galaxy. Emission from HoIX X-1 is resposible for even 75% of the H emission in this dwarf galaxy. We adopt H flux of this object from Arbutina et al. (2009).
Microquasars are X-ray binary systems, with accretion disk, relativistic jets, and usually with strong and variable radio emission. Also, they can have surrounding emission nebula. Large nebula S26 (from Blair & Long 1997) in the nearby galaxy NGC7793 is a jet-inflated bubble around a powerful microquasar (Pakull, Soria & Motch 2010). H emission from this source is not tracer of a star formation, and it is responsible for 1.15% of the galaxy’s total H emission.
Foreground emission-line stars, such as O and B supergiants and Wolf-Rayet stars exhibit strong optical emission lines, primarily hydrogen Balmer lines. In most of these systems, emission originates from strong stellar winds. While these stars have strong emission, they also have very bright continuum, and therefore they should be easily distinguished from H ii regions. In that sense, foreground emission-line stars could be easily removed from the total H flux and should not represent a source of error in H derived SFRs.
Superbubbles are regions of bright emission which frequently surround OB association. This kind of nebulae is powered by a combination of stellar winds, UV stellar radiation and occasional SN explosions. On the other hand, wind-blown nebulae are related to the H ii regions, but they are ionized due to shock fronts caused by strong stellar winds. Superbubbles are characterized by low velocity shock fronts ( 100 km s-1), while classical SNRs have shock fronts expanding at 100 - 1000 km s-1. With modern observational equipment, superbubbles can be distinguished from the SNRs, mostly upon detection of OB associations inside. In M31 SNR survey, Lee & Lee (2014) separated 44 superbubbles from previous SNR candidates, which represent 1.3% of total H emission of this galaxy, while in M101 galaxy 10 superbubbles represent 0.3% (Franchetti et al. 2012).
The main aim of this paper is to estimate the influence of SNRs’ emission on the H derived SFRs. In order to do so, we assemble current sample of optically detected SNRs in nearby galaxies.
In the next section we discuss optical detection of SNRs. Section 3 gives details on individual galaxies in our sample and SNR detections in those galaxies, while in section 4 we discuss influence of SNRs’ emission on the H derived SFRs. In section 5 we present our conclusions.
2 Optical detection of SNRs
Optical extragalactic searches for SNRs were pioneered by Mathewson & Clarke (1973a). They used the fact that the optical spectra of SNRs have elevated [S ii] 671.7 nm, 673.1 nm to H 656.3 nm emission-line ratios, as compared to the spectra of normal H ii regions. This emission ratio has been used to differentiate between shockheated SNRs (ratios 0.4, but often considerably higher) and photoionized nebulae (0.4, but typically 0.2) (Blair & Long 2004). This is justified through different ways of excitation. For SNRs we have collisional excitation inducted by shocks, rather than by photoionization, which is the case with H ii regions. In typical H ii regions, sulfur exists mainly in the form of S++, yielding low [S ii] to H emission ratios. In the case of SNRs, after the shock wave from an SNR propagates through the surrounding medium and as the material cools sufficiently (when an SNR is in the radiative phase), a variety of ionization states are present, including S+. This is the phase when the SNRs are most prominent in optical wavelengths and when we expect increased [S ii]/H ratios to be observed in SNRs.
The ”classical” definition for detection of an SNR at optical wavelengths is [S ii]/H0.4. Since the [N ii] lines mentioned above may be as strong as 50% of H line, some authors have relaxed the above criterion for identification of an SNR to the condition [S ii]/H0.3. (Dopita et al. 2010a and Leonidaki, Boumis & Zezas 2013).
2.1 Optical observations of SNRs
The optical search for SNRs is usually performed using the narrow band H and [S ii] filters and some continuum filter used to remove contribution from the continuum radiation. Modern instruments, both telescopes and CCDs, have much improved possibilities for this kind of observations in recent 15 - 20 years. That is why we have seen a significant increase in the number of optically detected SNRs in this period. In recent years a significant step forward has been made in making more complete SNR samples for some galaxies, such as M31, M33 and M83. Earlier, most optical detections of SNRs were performed using the photographic plates, which had much lower sensitivity and more difficulties in processing. The largest contribution to the number of optically detected SNRs in this early period can be attributed to D’Odorico, Dopita & Benvenuti (1980) and Mathewson et al. (1983, 1984, 1985). Mathewson and his group gave major contribution to the detection in Magelanic Clouds (MCs), while D’Odorico et al. (1980) observed eight galaxies - NGC6822, IC1613, M31, M33, NGC253, NGC300, NGC2403, IC342. Both of these groups provided only detections of SNRs, without any flux measurements.
Next major contribution to this field was also by two groups of authors - Blair & Long (1997) and Matonick & Fesen (1997). The first group observed two galaxies in Sculptor group - NGC300 and NGC7793, while Matonick & Fesen (1997) observed five nearby spiral galaxies - NGC5204, NGC5585, NGC6946, M81, and M101. Also, the same year Matonick et al. (1997) published observations of spiral galaxy NGC2403.
Matonick & Fesen (1997) used 1.3m McGraw-Hill Telescope at the Michigan-Dartmouth-MIT Observatory. They took sets of three images through each filter, with exposure times ranging from 300 to 1200 s. They also made spectroscopic observations, which they used both to confirm detections and to calibrate H flux for the [N ii] contamination.
Blair & Long (1997) made observations using 2.5m du Pont Telescope at Las Campanas Observatory. They managed 1500s exposure times in H filter (but it should be noted that their filters were with little lower transmittance of 50 - 60%), while exposure times were at least twice as long in [S ii] filter as in H, to permit comparable signal-to-noise ratios in objects having [S ii]/H ratios of . They applied a flat correction of 25% to remove [N ii] contamination from the H images.
Lately, Leonidaki et al. (2013) gave a major contribution to the total number of optically detected SNRs in nearby galaxies. In six galaxies - NGC2403, NGC3077, NGC4214, NGC4395, NGC4449 and NGC5204 they detected more than 400 SNRs. They made multiwavelength analysis of SNRs in these six galaxies, using both their optical and X-ray detections published previously by Leonidaki, Zezas & Boumis (2010). Leonidaki et al. (2013) obtained optical images with the 1.3m Ritchey-Chrétien telescope at the Skinakas Observatory. They used 3600s exposure time in H filter and 7200s in [S ii] filter. In order to estimate the H flux of their objects, they made correction for the [N ii] contamination using the [N ii](6548, 6584)/H ratios from integrated spectroscopy of the galaxies from the work of Kennicutt et al. (2008).
Also, over the last 10 years, there are several studies which used very large telescopes in SNR surveys. This resulted in making several excellent SNR samples in nearby galaxies such as M31, M33 and M83. Lee & Lee (2014) used data provided by the Local Group Survey (LGS; Massey et al. 2006) obtained by 4 m Mayall telescope at Kitt Peak National Observatory (KPNO). For detection of SNRs in M33, Long et al. (2010) used the same telescope, complemented with very deep exposures using 0.9 m Burrell Schmidt telescope. M83 galaxy was observed by using the same 4 m telescope by Blair & Long (2004), but also with HST (Dopita et al. 2010, Blair et al. 2014) and 6.5 m Magellan telescope (Blair, Winkler & Long 2012). This was enough to make M83 the galaxy with the best sample of optically selected SNRs.
2.2 Galaxies with optically identified SNRs
In order to estimate contribution from SNRs to the total H emission used to determine SFRs in a galaxy, we have searched literature for all galaxies which have optically identified SNRs. In total, there are 25 galaxies with optically detected SNRs (excluding the Milky Way). In Table 1, we list all the 25 galaxies which have been searched for optical SNRs, with basic data for each galaxy taken from the Nasa Extragalactic Database, NED222http://ned.ipac.caltech.edu/.
| Galaxy | R.A. | Decl. | Distance | Distance | Major | Minor | Galactic | Incl.∗ | Galaxy | |||
| name | (J2000) | (J2000) | reference | axis | axis | latitude | magnitude | |||||
| (h:m:s) | (d:m:s) | (Mpc) | (′) | (′) | (°) | (°) | (mag) | (mag) | ||||
| LMC | 05:23:34.5 | -69:45:22 | 0.05 | 1 | 645 | 550 | -32.9 | 35 | SB(s)m | 0.9 | 0.272 | |
| SMC | 00:52:44.8 | -72:49:43 | 0.06 | 2 | 320 | 185 | -44.3 | 58 | SB(s)m pec | 2.7 | 0.134 | |
| NGC6822 | 19:44:57.7 | -14:48:12 | 0.50 | 1 | 15.5 | 13.5 | -18.4 | 33 | IB(s)m | 9.31 | 0.855 | |
| NGC185 | 00:38:58.0 | 48:20:15 | 0.62 | 3 | 11.7 | 10.0 | -14.5 | E3 pec | 10.1 | 0.667 | ||
| IC1613 | 01:04:47.8 | 02:07:04 | 0.65 | 4 | 16.2 | 14.5 | -60.6 | 29 | IB(s)m | 9.88 | 0.090 | |
| IC342 | 03:46:48.5 | 68:05:47 | 3.30 | 5 | 21.4 | 20.9 | 10.6 | 25 | SAB(rs)cd | 9.1 | 2.024 | |
| NGC253 | 00:47:33.1 | -25:17:18 | 3.94 | 6 | 27.5 | 6.8 | -87.9 | 85 | SAB(s)c | 8.04 | 0.068 | |
| M31 | 00:42:44.3 | 41:16:09 | 0.79 | 4 | 190 | 60 | -21.6 | 78 | SA(s)b | 4.36 | 0.225 | |
| M33 | 01:33:50.9 | 30:39:37 | 0.84 | 4 | 70.8 | 41.7 | -31.3 | 54 | SA(s)cd | 6.27 | 0.15 | |
| NGC300 | 00:54:53.5 | -37:41:04 | 2.0 | 4 | 21.9 | 15.5 | -79.4 | 45 | SA(s)d | 8.95 | 0.046 | |
| NGC4214 | 12:15:39.2 | 36:19:37 | 2.92 | 7 | 8.5 | 6.6 | 78.1 | 39 | IAB(s)m | 10.24 | 0.079 | |
| NGC2403 | 07:36:51.4 | 65:36:09 | 3.22 | 4 | 21.9 | 12.3 | 29.2 | 57 | SAB(s)cd | 8.93 | 0.145 | |
| M82 | 09:55:52.7 | 69:40:46 | 3.53 | 8 | 11.2 | 4.3 | 40.6 | 69 | I0 edge-on | 9.3 | 0.567 | |
| M81 | 09:55:33.2 | 69:03:55 | 3.63 | 4 | 26.9 | 14.1 | 40.9 | 62 | SA(s)ab | 7.89 | 0.291 | |
| NGC3077 | 10:03:19.1 | 68:44:02 | 3.82 | 9 | 5.4 | 4.5 | 41.6 | 38 | I0 pec | 10.61 | 0.243 | |
| NGC7793 | 23:57:49.8 | -32:35:28 | 3.91 | 6 | 9.3 | 6.3 | -77.2 | 48 | SA(s)d | 9.98 | 0.053 | |
| NGC4449 | 12:28:11.1 | 44:05:37 | 4.21 | 9 | 6.2 | 4.4 | 72.4 | 45 | IBm | 9.99 | 0.053 | |
| M83 | 13:37:00.9 | -29:51:56 | 4.47 | 10 | 12.9 | 11.5 | 31.9 | 28 | SAB(s)c | 8.2 | 0.241 | |
| NGC4395 | 12:25:48.8 | 33:32:49 | 4.61 | 9 | 13.2 | 11.0 | 81.5 | 34 | SA(s)m? | 10.64 | 0.063 | |
| NGC5204 | 13:29:36.5 | 58:25:07 | 4.65 | 9 | 5.0 | 3.0 | 58.0 | 54 | SA(s)m | 11.73 | 0.045 | |
| NGC5585 | 14:19:48.2 | 56:43:45 | 5.7 | 11 | 5.8 | 3.7 | 56.6 | 51 | SAB(s)d | 11.2 | 0.057 | |
| NGC6946 | 20:34:52.3 | 60:09:14 | 5.9 | 12 | 11.5 | 9.8 | 11.7 | 32 | SAB(rs)cd | 9.61 | 1.241 | |
| M101 | 14:03:12.5 | 54:20:56 | 6.7 | 4 | 28.8 | 26.9 | 59.8 | 22 | SAB(rs)cd | 8.31 | 0.031 | |
| M74 | 01:36:41.7 | 15:47:01 | 7.3 | 13 | 10.5 | 9.5 | -45.7 | 20 | SA(s)c | 9.95 | 0.254 | |
| NGC2903 | 09:32:10.1 | 21:30:03 | 8.9 | 14 | 12.6 | 6.0 | 44.5 | 64 | SAB(rs)bc | 9.68 | 0.113 |
∗ From Tully (1988).
Distance references: (1) van den Bergh 2000; (2) Ferrarese et al. 2000; (3) Conn et al. 2012; (4) Freedman et al. 2001; (5) Saha, Claver & Hoessel 2002; (6) Karachentsev et al. 2003a; (7) Tully et al. 2006; (8) Sakai & Madore 1999; (9) Karachentsev et al. 2003b; (10) Thim et al. 2003; (11) Karachentsev, Kopylov & Kopylova 1994; (12) Karachentsev et al. 2004; (13) Sharina, Karachentsev & Tikhonov 1996; (14) Drozdovsky & Karachentsev 2000.
We note that in Table 1 there are galaxies, such as NGC253 and IC342, which do not have published flux estimates for their SNRs, or NGC185 galaxy for which we did not find any published H flux. Also, there are galaxies (such are Large Magellanic Cloud - LMC, Small Magellanic Cloud - SMC, NGC6822 and IC1613) which have not been surveyed for optical SNRs, but have individual detections of SNRs presented in the literature. None of these seven galaxies listed in the first part of Table 1 will not be included in our discussion on SNRs contribution to the H derived SFRs. Anyway, we want to mention a few details on optical detection of SNRs in each of these galaxies, as a guide for future work in this field.
LMC and SMC are the closest neighbors of the Milky Way. Due to their proximity, studies of SNRs in these galaxies began as early as in the 1960s. At the distance of MCs (50 - 60 kpc), SNRs are well resolved, which gives an opportunity for a more in-depth analysis. This is why an increasing number of recent papers on SNRs in MCs are discussing individual objects (e.g. Bozzetto et al. 2012a; Bozzetto et al. 2012b) but through multifrequency analysis (e.g. Bozzetto et al. 2012c; de Horta et al. 2012; Haberl et al. 2012a; Maggi et al. 2012; Bozzetto et al. 2013; Bozzetto et al. 2014).
First detections of SNRs in MCs were done by using a combination of radio and optical techniques (Mathewson & Clarke 1972; Mathewson & Clarke 1973a; Mathewson & Clarke 1973b; Mathewson et al. 1983, 1984, 1985).
Filipović et al. (1998) listed all the discrete radio sources in the Parkes survey of the MCs, and found 32 SNRs and 12 SNR candidates in the LMC, and 12 SNRs in the SMC. Filipović et al. (2005) presented 16 Australian Telescope Compact Array (ATCA) radio SNRs in SMC. Twelve of them have optical long-slit spectra and estimated line ratios presented by Payne et al. (2007). According to Payne, White & Filipović (2008), a revision of the Parkes survey complemented with ATCA data yields 52 confirmed SNRs and 20 candidates in the LMC.
In the X-rays, Williams et al. (1999) published an atlas of ROSAT sources, which contained 31 LMC SNRs, while Haberl et al. (2012b) were the first to cover the full extent of the SMC in X-rays.
Badenes, Maoz & Draine (2010) discussed size distribution of SNRs in MCs. In their paper they tried to collect full sample of SNRs in MCs. They merged two online catalogues to finally obtain 54 confirmed SNRs in LMC and 23 in SMC. The first catalogue they used is an optical catalogue of MC SNRs being assembled as part of the Magellanic Clouds Emission Line Survey (MCELS, Smith, Leiton & Pizarro 2000); the most recent on-line version of this catalogue333http://www.ctio.noao.edu/mcels/snrs/framesnrs.html lists 31 SNRs in the LMC and 11 in the SMC. The second catalogue is presented by the Magellanic Clouds Supernova Remnant Database (Murphy Williams et al. 2010)444http://www.mcsnr.org/; the current version of their catalogue contains 47 confirmed objects in the LMC and 16 in the SMC. Unfortunately, none of these catalogues contain data on optical fluxes.
NGC6822 is one of the nearest dwarf irregular galaxies in the Local Group. Despite its convenient distance, only one SNR has been detected so far. This SNR - Ho12 was first observed by Hodge (1977), and later by D’Odorico et al. (1980) and D’Odorico & Dopita (1983). Kong, Sjouwerman & Williams (2004) published multiwavelength analysis of this SNR.
NGC185 is a dwarf elliptical companion of the Andromeda galaxy, which has undergone recent star formation activity. Gallagher, Hunter & Mould (1984) obtained spectra of NGC185, and found strong [S ii] emission, which originated from an SNR. Later, Martínez-Delgado, Aparicio & Gallart (1999) obtained new H observations of the central region of NGC185, where they also detected this SNR. Finally, Gonçalves et al. (2012) confirmed this object as SNR, using a deep spectroscopy.
IC1613 is a low mass irregular galaxy in the Local Group. The only known SNR in this galaxy is the bright nebula S8 (Sandage 1971). This SNR was observed by numerous authors (D’Odorico et al. 1980, D’Odorico & Dopita 1983, Peimbert, Bohigas, & Torres-Peimbert 1988) but complete multiwavelength analysis was presented by Lozinskaya et al. (1998).
NGC253 is one of the nearest starburst galaxies. SNRs detection in this galaxy is difficult because of the edge-on orientation. Most of SNR surveys in this galaxy have been performed in radio domain (Ulvestad 2000; Lenc & Tingay 2006). In optical, so far there has been only detection of two SNR candidates made by D’Odorico et al. (1980).
IC342 is an almost face-on spiral galaxy of large angular extent. It is heavily obscured by Galactic disk, and this is why it was often avoided for optical observations. D’Odorico et al. (1980) were the first who searched for IC342 SNRs at optical wavelengths. Their paper reported detection of 4 SNRs, but they observed only central part of the galaxy. Vučetić et al. (2013) performed search for SNRs and H ii regions in South-western part of this galaxy through H and [S ii] filters. Until now, Vučetić et al. (2013) have published only detections of H ii regions, while results for SNRs are in preparation.
2.3 Sample selection
From the 25 galaxies which have optical SNRs, we have selected 18 which have been fully or partially surveyed for SNRs in optical wavelengths and which have published flux estimates for SNRs. Those galaxies are listed in the second part of Table 1.
When we look at the morphologies of the galaxies in the sample, 14 of them are spirals and 4 are irregular galaxies. Knowing that the spiral and irregular galaxies are the places where the most star-births are taking place, it is hardly surprising that such galaxies have been chosen to be targets for optical searches for SNRs. Most of the galaxies are with lower inclinations, in order to reduce internal extinction, with the exception of few bright and well-known galaxies, such as M31 and M82. In the same manner, almost all galaxies (except NGC6946) avoid Galactic plane, having Galactic latitudes , in order to reduce Galactic extinction. Also, all of galaxies in our sample have blue apparent magnitude . Considering distances of galaxies in our sample, half of them are in the range between 3 – 5 Mpc. The most distant galaxy with optically detected SNRs is NGC2903, at the distance of nearly 9 Mpc.
We queried Nearby Galaxies Catalog (Tully 1988) to see how many galaxies are there which meet the criteria of our sample – to be spiral or irregular galaxy; to have Mpc, , and . In total, there are 50 galaxies that meet these criteria, while there are 17 within the distance range of 3 – 5 Mpc. Hence, our sample represents roughly 35% of galaxies which could be observed for SNRs. The criteria that are met in our sample are simply a consequence of a bias – observers tend to choose target objects which are closer, brighter and with less extinction. If we extended conditions to cover all inclinations and to reach blue apparent magnitude of , 154 galaxies would be available.
In the sample there are galaxies (like NGC2403, M83 and M101) which have multiple detections of the same SNR by different studies. In such cases, we have taken flux data from the most reliable and most recent observations. Also, in the cases (such are M83 and M101) where there are observations of different parts of the same galaxy, we naturally present SNRs detected in all of the observed parts.
In order to compare fluxes of SNRs with H fluxes of galaxies, we correct fluxes of SNRs for Galactic extinction and [N ii] contamination in the same manner as for fluxes of galaxies (more details in section 4). Such corrected H fluxes are presented in Section 4, while in the next section we give SNRs’ fluxes for each galaxy as they were originally published.
3 Nearby galaxies with optical SNRs
In this section, we review individual galaxies in the sample and their properties. For each galaxy we summarize the history of SNRs detection, especially in optical range, and we specify characteristics of some unusual sources. We have also collected the H fluxes of all optically detected SNRs from each galaxy in the sample (which are, together with coordinates, diameters and [S ii]/H ratios, given in Appendix).
3.1 M31
M31 - Andromeda galaxy is the largest galaxy in the Local Group and the nearest spiral galaxy to the Milky Way. In many properties, this galaxy is very similar to our own, and that is one of the reasons why it is so interesting to us. It should be mentioned that this galaxy has small inclination to the line of sight (), so it is a limiting factor for the number of detectable SNRs. The first discussion on optical SNRs in M31 were made by Kumar (1976). DDO80 detected 19 optical SNRs, while Blair, Kirshner, & Chevalier (1981) reported 18, with 11 of them having measured line fluxes. Braun & Walterbos (1993) observed a large fraction of the spiral arms in the Northeast half of M31 and they detected 52 SNR candidates, both in optical and radio wavelengths. Two years later, Magnier et al. (1995) published 178 SNR candidates, from about one square degree in galactic disk, but they did not measure objects’ fluxes. At radio wavelengths, Dickel et al. (1982) and Dickel & D’Odorico (1984) searched for radio counterparts to the optical identifications, and they were successful in total 8 detections. Kong et al. (2003) and Williams et al. (2004) both detected two SNRs, through all three ranges of interest - radio, optical and X-rays, but with roughly calibrated optical data. In X-rays, Supper et al. (2001) detected 16 SNRs using ROSAT, while 21 were identified with XMM-Newton (Pietsch, Freyberg & Haberl 2005). Lately, Stiele et al. (2011) published catalog of XMM-Newton sources from entire M31, out of which 25 sources were identified as already known SNRs, while additional 31 were classified as SNR candidates. Sasaki et al. (2012) searched the Local Group Galaxy Survey (LGGS555Data from the LGGS are available at http://www.lowell.edu/users/massey/lgsurvey/., Massey et al. 2006) and HST archival images for optical counterparts to the SNRs and SNR candidates from Stiele et al. (2011). They found that 21 X-ray SNRs have an optical counterpart, as well as 20 X-ray SNR candidates. Also, they suggested additional 5 X-ray sources from Stiele et al. (2011) to be SNRs, based on their optical properties.
Just recently, Lee & Lee (2014) presented a survey of optically emitting SNRs in the entire disk of M31 based on H and [S ii] images in LGS. They published a catalogue of 156 SNR candidates in M31. In their survey, they rejected all objects with [S ii]/H, but which also have a number of OB stars in their projection, or have sizes of pc. These objects could be H ii regions or superbubbles. This is how they made 154 previously known SNRs to be non-SNR objects. Out of these 154 non-SNRs, 44 are catalogued as superbubbles. Out of 156 SNRs in the catalogue, 80 objects previously detected by Braun & Walterbos (1993), Magnier et al. (1995) and Sasaki et al. (2012), are confirmed to be SNRs.
Total H flux of 156 SNRs detected in M31 by Lee & Lee (2014) is erg cm-2 s-1.
3.2 M33
M33 is the nearest late-type spiral galaxy in the Local group. Its distance of 840 kpc, moderate inclination () and a low Galactic absorption (AB=0.15 mag, NED) make this galaxy a good target for SNRs search. This could be the reason why M33 is among galaxies with the largest sample of detected SNRs. It is surely a galaxy with the largest sample of SNRs detected both in optical and X-rays. Long et al. (2010) made an enormous contribution to this topic by reporting and giving detailed description of 137 SNRs in X-ray, optical and radio wavelengths. They improved the sample of optical SNRs previously made by Gordon et al. (1998), which consisted of 98 SNRs, detected with Kitt Peak 4 m telescope. Long et al. (2010) primarily presented results of the ChASeM33 survey (Chandra survey, Plucinsky et al. 2008), but they also made a valuable supporting multiwavelength analysis. They used LGGS (Massey et al. 2006) as well as their own optical observations made with 0.6 m Burrell Schmidt telescope, but with very long exposures (5100 s). They made a sample of 137 SNRs, all visible in optical range, out of which 131 SNRs were detected also in X-rays. They made new radio observations with VLA, but in the high-resolution mode in order to complement previous VLA observations made by Gordon et al. (1999). Gordon et al. (1999) detected 53 SNRs, all of which were previously suggested as SNRs based on optical imagery. Long et al. (2010) were successful in detecting small-diameter, young remnants and pulsar-wind nebulae (PWNe) candidates and in some cases they resolved confusion of H ii regions with SNRs.
Based on their optical observations, we found that total H flux from 137 SNRs detected in M33 is erg cm-2 s-1.
3.3 NGC300
NGC300 is a spiral galaxy, member of the Sculptor group of galaxies. NGC300 is very prominent in optical and H due to many large H ii regions which are evidence of ongoing star formation (see Butler, Martínez-Delgado & Brandner 2004). First optical detection of SNR candidates was done by D’Odorico et al. (1980). Later studies (Blair & Long (1997), Pannuti et al. 2000, Payne et al. 2004, Millar et al. 2011) were all, with the exception of Blair & Long (1997), multiwavelength analyses. Blair & Long (1997) performed optical narrowband imaging and spectroscopy and they proposed 28 SNR candidates. Pannuti et al. (2000) presented their VLA observations, in combination with their own optical observations, archival ROSAT X-ray data and optical data from Blair & Long (1997). They reported 17 radio SNR candidates, of which 3 were known from the optical observations. Payne et al. (2004) gave detailed cross-matching of objects previously detected in NGC300 and detections which they made using ATCA and XMM-Newton observations. Finally, Millar et al. (2011) performed spectroscopy for 51 sources chosen from the Blair & Long (1997) and Payne et al. (2004), as well as analysis of archival images from Chandra X-ray observatory. Based on their spectroscopical analysis, Millar et al. (2011) confirmed 22 out of 28 SNR candidates from Blair & Long (1997). In addition, three of them are also visible in radio, and two were detected also in X domain.
Total integrated H line flux density from those 22 confirmed SNRs from Millar et al. (2011) is erg cm-2 s-1.
3.4 NGC4214
NGC4214 is a nearby irregular dwarf galaxy currently experiencing a high level of massive star formation. Combining optical, near-IR, and UV data, Huchra et al. (1983) concluded that it went through a burst of star formation a few times yr ago. This galaxy is one of the several galaxies in which surveys for SNRs have been carried out through X-ray, radio and optical wavelengths. Initially, Vukotić et al. (2005) classified one radio source as SNR from VLA archival observations of NGC4214. Afterwards, Chomiuk and Wilcots (2009) found six more radio SNR candidates, and three more objects denoted as SNR/H ii, also from the VLA observations. Then Leonidaki et al. (2010) performed search for X-ray SNR candidates through archival Chandra images, and suggested 11 sources as SNRs or SNR candidates. The same year, Dopita et al. (2010b) detected all radio SNRs from Chomiuk and Wilcots (2009) using HST telescope. Finally, Leonidaki et al. (2013) detected 92 optical SNRs or SNR candidates, using [S ii]H ratio criterion.
These 92 optical SNR candidates in NGC4214 have a total H flux of erg cm-2 s-1.
3.5 NGC2403
NGC2403 is a spiral galaxy at the distance of 3.22 Mpc and with the inclination angle of around 60∘. This galaxy is the second brightest galaxy in the M81 Group (Karachentsev et al. 2002). It was one of the targets of surveys by Leonidaki et al. (2010) and Leonidaki et al. (2013) for X-ray and optical SNRs. Also, it was target of the DDO80 search, which detected 2 SNRs. Matonick et al. (1997) carried a relatively deep optical search for SNRs in this galaxy. They detected 33 new SNRs, and confirmed two detections of DDO80. VLA observations (Turner & Ho 1994, Eck, Cowan & Branch 2002) found only three radio SNR candidates. Pannuti, Schlegel & Lacey (2007) searched for positional coincidences between their sample of X-ray sources in NGC2403 and 35 SNRs of Matonick et al. (1997) and known radio SNRs in the galaxy. They found only two matches, one with optical SNR, and one with the radio SNR candidate. In addition to that, Leonidaki et al. (2010) found 15 X-ray selected SNRs, while Leonidaki et al. (2013) reported detection of 149 optical SNRs or SNR candidates. All optical SNRs from Matonick et al. (1997), except SNR-1, which was out of the field of view, were detected by Leonidaki et al. (2013).
The total H line flux density of 150 SNRs detected by Leonidaki et al. (2013) and Matonick et al. (1997) in NGC2403 is erg cm-2 s-1. This galaxy is the third by the number of optically detected SNRs, after M83 and M31, but it is the first by the percentage of H flux coming from the SNRs in comparison to total H flux from the galaxy.
3.6 M82
M82 is a member of M81 galaxy group, with a distance of 3.53 Mpc. It is one of the nearest and certainly the best-studied starburst galaxy. The active starburst has continued for almost 20 Myr at a rate of about 10 M. The evidence of such strong star formation are also two (radio) SNe in the last 10 years. Recently, type Ia SN2014J was detected in this galaxy (Fossey et al. 2014). Active starburst region is located in the centre of the galaxy. This region was mostly avoided for optical observations. Dust attenuation of light is restricting optical detection of larger population of compact SNRs in the core of M82, which have been studied at radio wavelengths (Kronberg & Wilkinson 1975; Kronberg, Biermann & Schwab 1985; Huang et al. 1994; Muxlow et al. 1994; Fenech et al. 2008; Fenech et al. 2010). Therefore, no SNRs have been detected at visible wavelengths in M82 until de Grijs et al. (2000) have analyzed HST H narrowband images. In part of the galaxy called M82B, which is considered to be a ”fossil” starburst region, they have detected 10 SNR candidates. Interesting about optical SNR detection from de Grijs et al. (2000) is that it was not based on [S ii]H ratio, but on the conditions that H luminosity of SNR should be less than erg s-1 and that diameter of an SNR should be less than 100pc.
The total H line flux density of 10 SNRs detected by de Grijs et al. (2000) is erg cm-2 s-1.
3.7 M81
M81 is a nearby spiral galaxy, the brightest galaxy in the Group. M81 forms the most conspicuous physical pair with its neighbor, M82, with whom it had a close encounter a few tens of million years ago. The galaxy also contains a low luminosity AGN (Markoff et al. 2008). The only thorough search for SNRs in M81 was done by Matonick & Fesen (1997). In five fields of view, covering the whole disk of this galaxy, and by using the [S ii]H ratio technique, they detected 41 optical SNRs. Ten years earlier, in a search for giant H ii regions in M81 using the VLA at 6 cm and 20 cm, Kaufman et al. (1987) proposed that five sources could be SNRs, according to their spectral indices. The latest paper on SNRs in M81 galaxy was by Pannuti et al. (2007). They searched for X-ray counterparts to optical and candidate radio SNRs using observations made with the Chandra X-Ray Observatory. Their field of view covered only 23 optical and three radio candidate SNRs, but they found no Chandra-detected counterparts.
The total H line flux density of 41 optical SNRs detected by Matonick & Fesen (1997) is erg cm-2 s-1.
3.8 NGC3077
NGC3077 is a nearby dwarf galaxy, member of the M81 galaxy group. The tidal interaction between galaxies in this group leads to enhanced star formation (Walter et al. 2002). Concerning SNRs, firstly there were only three X-ray candidates which were detected using Chandra observations (Ott, Martin & Walter 2003). Rosa-Gonzales (2005) found that one of these sources coincides with one of radio sources they reported. Later, Leonidaki et al. (2010) detected 5 SNRs candidates, using archival Chandra images, and among their five detections two were already known (from Ott et al. 2003) and three were new. Finally, Leonidaki et al. (2013) detected 24 optical SNRs in NGC3077, of which one had both optical and X counterparts.
Here we also mention Garland, tidal arm, located eastward of the galactic centre, where VLA HI observations (Walter et al. 2002) showed that 90 % of atomic hydrogen around NGC3077 is located. Also, Karachentsev & Kaisin (2007) reported that Garland has the highest SFR per luminosity among 150 galaxies of the Local volume with known SFRs. For those reasons, Andjelić et al. (2011) searched for optical SNRs in Garland, but they found no such candidates.
The total H line flux density of 24 optical SNRs detected by Leonidaki et al. (2013) in NGC3077 is erg cm-2 s-1.
3.9 NGC7793
NGC7793 is a member of nearby Sculptor Group, with a distance of 3.91 Mpc and an inclination angle of 50∘ (Tully 1988). Its spiral pattern is nearly lost in a general confusion of H ii and star formation regions. The SNR population of NGC7793 has been well studied through optical, radio and X surveys (Blair & Long 1997, Pannuti et al. 2002, Pannuti et al. 2011). According to these searches, there are 32 detected SNRs (or SNR candidates) in total. First, Blair & Long (1997) reported detection of 28 SNRs based on optical search through narrowband H and [S ii] filters. Afterwards, Pannuti et al. (2002) detected five new radio SNR candidates, and two SNRs from Blair & Long (1997) list using their own VLA observations. They also examined archival ROSAT satellite data and found no additional SNR candidates, but it should be kept in mind that the search for SNRs in this range is complicated by the presence of considerable diffuse X-ray emission throughout the entire disk of this galaxy. Finally, Pannuti et al. (2011) improved X-ray data for NGC7793 using Chandra observatory, but they only found one SNR previously detected in radio, and one SNR - S11 (from Blair & Long 1997) detected both at optical and radio wavelengths. Another interesting object in this galaxy is SNR candidate S26 from Blair & Long 91997). This is now a known microquasar with surrounding nebula, studied by several authors (Pakull et al. 2010, Soria et al. 2010, Dopita et al. 2012). It is an extended region with diameter of approximately 260 pc, and with high [S ii]H ratio, prominent in H line, but not a tracer of star formation.
Blair & Long (1997) pointed that NGC7793 is galaxy with not so obvious a ”gap” between [S ii]H ratios for H ii regions and SNRs, which could lead to numerous contaminations or misidentification of optical SNRs.
The total integrated H line flux density from 26 SNRs for Blair & Long (1997) is erg cm-2 s-1.
3.10 NGC4449
NGC4449 is a Magellanic-type irregular galaxy with several areas of recent star formation, including the nucleus and the bar. This galaxy is known for an extensively studied Cas A-like SNR, which has been observed through all wavelengths (optical: Balick & Heckman 1978; Blair, Kirshner & Winkler 1983; X-rays: Patnaude & Fesen 2003; radio: Seaquist & Bignell 1978; Lacey, Goss & Mizouni 2007). This SNR was the only optical SNR in NGC4449 until recently, when Leonidaki et al. (2013) detected additional 69 optical candidate SNRs. In radio domain, Chomiuk & Wilcots (2009) contributed 7 new SNR detections, which were all also detected in optical by Leonidaki et al. (2013). In X-rays, Summers et al. (2003) observed NGC4449 using Chandra observatory, and they suggested two sources to be SNRs, while other 8 were classified as SNR/XRB (X-ray binary). Using the same Chandra observations, Leonidaki et al. (2010) suggested that 4 objects should be SNRs or SNR candidates. All of these 4 objects were also detected as optical SNR candidates (Leonidaki et al. 2013).
The total H line flux density of 70 optical SNRs detected by Leonidaki et al. (2013) in NGC4449 is erg cm-2 s-1.
3.11 M83
M83 is a grand-design spiral galaxy, with a starburst nucleus and active star formation. Its almost face-on orientation gives us an opportunity to have a detailed view of the processes of star formation and destruction. It had six SNe in the last century, which makes it second only to NGC6946. That is why we should not be surprised that this galaxy is the one with the highest number of optically detected SNR candidates. The first who searched for optical SNRs in M83 were Blair & Long (2004). They made observations by using 4 m Blanco telescope at the Cerro Tololo Inter-American Observatory and found 71 candidate SNRs. They also searched for X-ray counterparts to their optical detections from Soria & Wu (2003) and found 15 position matches. Two years later, Maddox et al. (2006) published VLA observations of M83, and they found four sources that matched optical SNRs from Blair & Long (2004). Later on, Dopita et al. (2010), by using a Wide Field Camera (WFC) on HST, detected 60 SNRs in one field of view. Of those 60 SNRs, one is a historical remnant, 40 are detected in a classical way by using [S ii]H ratio in the disk region of M83, while other 19 were detected in “nuclear” region (300 pc). SNRs in nucleus were detected based on enhanced [O ii] line, and only 4 of them had measured H fluxes. Among detections of Dopita et al. (2010), there were 12 SNRs from Blair & Long (2004). The largest contribution to the number of observed optical SNRs in M83 was made by Blair et al. (2012) (see also erratum to this paper by Blair et al. 2013). They observed the full extent of the galaxy, using Magellan I 6.5 m telescope under conditions of excellent seeing and with extremely deep exposures of 70 minutes. They detected 225 ISM-dominated SNRs in M83, using [S ii]H ratio technique, with additional 33 [OIII] selected objects, which could be candidates for ejecta-dominated SNRs. They confirmed all but three SNRs from Blair & Long (2004), and 25 out of 40 disk SNRs from Dopita et al. (2010). Blair et al. (2012) also searched for X-ray counterparts to their optical SNRs, and found that 65 of 225 ISM-dominated SNRs have X-ray counterparts, as well as five ejecta-dominated SNRs. Just recently, Blair et al. (2014) presented an expanded HST survey of M83. They reported detection of 26 new SNRs. It should be mentioned that in all of these three papers (Blair & Long 2004, Dopita et al. 2010, Blair et al. 2012, Blair et al. 2014) extensive analysis of physical and statistical parameters of the SNRs sample in M83 is given.
The total H flux from 296 SNRs in M83 which have measured H fluxes – 225 ISM-dominated and 33 ejecta-dominated from Blair et al. 2012; 12 disk SNRs and 4 nuclear from Dopita et al. (2010), which are not detected by Blair et al. (2012), and 22 from Blair et al. (2014) – is erg cm-2 s-1.
3.12 NGC4395
NGC4395 is a nearby irregular starburst galaxy, hosting the least luminous Seyfert nucleus. This galaxy may host one radio candidate SNR, upon its non-thermal radio spectrum from VLA observations (Sramek 1992, Vukotić et al. 2005) and because of its positional coincidence with H ii region from Roy et al. (1996). Unfortunately, this object was out of the Chandra field in which Leonidaki et al. (2010) suggested two X-ray SNRs. At optical wavelengths, Leonidaki et al. (2013) found 47 candidate SNRs, although their observations did not cover the full extent of the galaxy. Among these detections there was one X-ray candidate (from Leonidaki et al. 2010), while the other was out of the field of view. The only radio candidate SNR in this galaxy was also detected, but it had [S ii]H ratio less than 0.3.
The total H line flux density of 47 optical SNRs detected by Leonidaki et al. (2013) in NGC4395 is erg cm-2 s-1.
3.13 NGC5204
NGC5204 is a nearby Magellanic-type galaxy, a member of the M101 group of galaxies. In the literature, most of the studies are focused on the ULX source NGC5204 X-1, close to the centre of the galaxy and its optical counterpart. In this galaxy, there are only optical SNR detections. First, Matonick & Fesen (1997) detected three optical SNR candidates, while recently, Leonidaki et al. (2013) confirmed these three detections and added 33 possible new SNRs. In X-rays, Leonidaki et al. (2010) searched through archival Chandra images for SNRs in this galaxy, but they found no such candidates.
The total H line flux density of 36 optical SNRs detected by Leonidaki et al. (2013) in NGC5204 is erg cm-2 s-1.
3.14 NGC5585
NGC5585 is a late-type spiral galaxy in the M101 group. The only paper which discussed SNRs in this galaxy is Matonick & Fesen (1997). They found only 5 optical SNRs. Among these 5 SNRs, there is one interesting object, SNR 1, with extremely large dimensions - pc. This candidate SNR is similar to the already mentioned microquasar S26 in NGC7793, although it is twice smaller in size. Unfortunately, there are no additional observations of this unusual object that could reveal its true nature.
The total integrated H line flux density for 5 SNRs in NGC5585 from Matonick & Fesen (1997) is erg cm-2 s-1.
3.15 NGC6946
NGC6946 is a nearby (d=5.9 Mpc) late type spiral galaxy hiding a mild starburst nucleus (Turner & Ho 1983). This galaxy could be interesting for SNRs search because there are nine historical SNe up to date in this galaxy (Barbon et al. 2010). The first detected SNR in NGC6946 was MF16 (from Matonick & Fesen 1997) and the detection was done by ROSAT X-ray observatory (Schlegel 1994) by following optical observations by Blair & Fesen (1994). The first systematic search for SNRs was performed by Matonick & Fesen (1997) in optical wavelengths. They discovered 27 optical SNR candidates. The same year Lacey, Duric & Goss (1997) published their VLA observations of NGC6946, and suggested 37 objects as possible SNRs. More recently, Pannuti et al. (2007) have found, using their Chandra observations, six X-ray counterparts to candidate radio SNRs, and no counterparts to the optical SNRs.
Due to its large dimensions (100 pc) and its ultra high X-ray luminosity, there are many papers debating true nature of MF16 source. Blair, Fesen & Schlegel (2001), based on HST observations through narrowband filters, suggested that this object could be a result of multiple SN explosions, close temporally and spatially. Afterwards, Roberts & Colbert (2003) suggested upon Chandra observations that extraordinary X-ray luminosity of the MF16 arises from a black hole X-ray binary and that this object is ULX source.
The total integrated H line flux density from 26 SNRs in NGC6946 from Matonick & Fesen (1997) is erg cm-2 s-1.
3.16 M101
M101 is a nearly face-on ( inclination) giant spiral galaxy at a distance of 6.7 Mpc. This galaxy is one of the well studied for SNRs. The first major search for SNRs in M101 was performed by Matonick & Fesen (1997), when they reported detection of 93 SNRs. With five fields of view, they covered the full size of the galaxy. Before that, one candidate radio SNR in M101, NGC5471B, a part of a giant H ii region, was known (Skillman 1985; Sramek & Weedman 1986; Yang, Skillman & Sramek 1994). Afterwards, Pannuti et al. (2007) searched for X-ray counterparts to optically identified SNRs from Matonick & Fesen (1997). Their observations covered 44 SNRs, and they found that six of them are visible also in X-rays. The latest paper on SNRs in M101 was the one by Franchetti et al. (2012) who used archival HST H images for 55 of the 93 SNR candidates identified by Matonick & Fesen (1997) and conducted detailed analysis of their physical structure and nature. Also, they used deep Chandra X-ray mosaic of M101 made by Kuntz & Snowden (2010) to search for X-ray emission of SNR candidates and found that 21 of the 55 SNR candidates in their study have X-ray counterparts. They also checked if the rest 38 SNRs from Matonick & Fesen (1997), which do not have HST images, radiate in X-rays, and they found that 11 of them have X-ray counterparts. From HST images, they found that ten objects, out of 55 SNRs from Matonick & Fesen (1997), are actually superbubbles, and another ten are OB/H ii associations. These ten we excluded from the list of SNRs in M101.
Finally, in order to estimate H flux from SNRs in M101, we combine the results from Matonick & Fesen (1997) and Franchetti et al. (2012). We have taken H fluxes for 38 SNRs from Matonick & Fesen (1997), and for 35 SNRs Franchetti et al. (2012). Total integrated H line flux density for 73 SNRs and in M101 is erg cm-2 s-1.
3.17 M74
M74 (NGC628) is a face-on spiral galaxy at a distance of 7.3 Mpc and is the brightest member of a small M74 group of galaxies. This galaxy has been well studied for its star-forming properties (Leievre & Roy 2000, Elmegreen et al. 2006). M74 also had three SN explosions in the last twelve years. SNRs at optical wavelengths in this galaxy were detected by Sonbas et al. (2010). They detected nine SNRs in this galaxy. Previously, M74 was observed in X-rays using the Chandra and XMM-Newton data by Soria, Pian & Mazzali (2004). Sonbas et al. (2010) found three matches between their SNR candidates and X-ray sources from Soria et al. (2004).
The total integrated H line flux density for 9 SNRs in M74 from Sonbas et al. (2010) is erg cm-2 s-1.
3.18 NGC2903
NGC2903 is a late-type barred spiral galaxy at a distance of 8.9 Mpc. It is also known as a “hot-spot” galaxy, because of its numerous bright nuclear condensations (Sersic 1973) which are believed to be OB associations and clusters. The only SNRs search in this galaxy was performed by Sonbas, Akuyz & Balman (2009). They detected five optical SNR candidates. Besides that, Tsai et al. (2006) reported in their subarcsecond-resolution VLA imaging of NGC2903 that one of seven detected discrete radio sources could be an SNR.
The total integrated H line flux density for 5 SNRs in NGC2903 from Sonbas et al. (2009) is erg cm-2 s-1.
4 Discussion
In previous section we gave an overview on the achievements in optical detection of SNRs in nearby galaxies, as well as some notice on detection of SNRs at other wavelengths. In our sample, we present 18 galaxies which have been surveyed for optical SNRs.
In Table 2 we give the number and total H flux of optical SNRs in each galaxy from our sample. Also, we present data taken from Kennicutt et al. (2008) which give total H flux of the galaxy, which can be used to estimate SFR (according to equation (1)). Kennicutt et al. (2008) have published “An H imaging survey of galaxies in the local 11 Mpc volume”, which provided us with the H fluxes for 18 galaxies in our sample. Fluxes from Kennicutt et al. (2008) are corrected for Galactic foreground extinction and [N ii] contamination. In Table 2 we give values used in Kennicutt et al. (2008) for these corrections. We applied these same corrections for SNRs’ fluxes taken from literature. In the cases where H fluxes for SNRs given in original work have been previously corrected for Galactic foreground extinction and [N ii] contamination, we recalculate fluxes in order to make them corrected in the same manner as was done by Kennicutt et al. (2008). In order to remove [N ii] contamination from fluxes we used integrated [N ii] 6548, 6583/H ratio from Kennicutt et al. (2008) and the procedure presented in Vučetić et al. (2013), which takes into account different filter transmittance at position of each of these three emission lines. No internal extinction correction was done to any of the fluxes presented in this paper.
| Galaxy | Num. of | Fraction | FSNRs | FSNRs | LSNRs | [N ii]/H ∗ | ∗ | Fgal ∗ | Lgal ∗ | R | R | Ref. |
|---|---|---|---|---|---|---|---|---|---|---|---|---|
| name | optical | surveyed | (erg cm-2 s-1) | (%) | (erg s-1) | ratio | (mag) | (erg cm-2 s-1) | (erg s-1) | (%) | (%) | |
| SNRs | ||||||||||||
| (1) | (2) | (3) | (4) | (5) | (6) | (7) | (8) | (9) | (10) | (11) | (12) | (13) |
| M31 | 156 | 1 | 371.9 | / | 2.8 | 0.54 | 0.18 | 360.4 | 26.9 | 1.0 | 12 | 1 |
| M33 | 137 | 1 | 544.6 | / | 4.6 | 0.27 | 0.18 | 383.0 | 32.4 | 1.4 | 12 | 2 |
| NGC300 | 22 | 1 | 23.1 | 22 | 1.1 | 0.2 | 0.06 | 31.6 | 15.1 | 0.7 | 34 | 3 |
| NGC4214 | 92 | 1 | 178.0 | 2 | 18.2 | 0.16 | 0.05 | 15.2 | 15.5 | 11.7 | 14 | 4 |
| NGC2403 | 150 | 0.88 | 620.7 | 1 | 77.0 | 0.29 | 0.17 | 48.6 | 60.3 | 12.8 | 13 | 4,5 |
| M82 | 10 | 0.07 | 2.7 | 5 | 0.4 | 0.3 | 0.4 | 78.8 | 117.5 | 0.1 | 17 | 6 |
| M81 | 41 | 1 | 18.8 | / | 3.0 | 0.51 | 0.24 | 37.3 | 58.9 | 0.5 | 12 | 7 |
| NGC3077 | 24 | 1 | 28.3 | 6 | 5.0 | 0.38 | 0.25 | 5.5 | 9.5 | 5.2 | 18 | 4 |
| NGC7793 | 27 | 1 | 28.8 | / | 5.3 | 0.25 | 0.08 | 20.8 | 38.0 | 1.4 | 12 | 8 |
| NGC4449 | 71 | 1 | 121.6 | 2 | 25.8 | 0.23 | 0.04 | 24.2 | 51.3 | 5.0 | 14 | 4 |
| M83 | 296 | 1 | 653.0 | / | 156.0 | 0.53 | 0.21 | 74.4 | 177.8 | 8.8 | 12 | 9,10,11 |
| NGC4395 | 47 | 0.73 | 27.2 | 3 | 6.9 | 0.19 | 0.04 | 4.5 | 11.5 | 6.0 | 15 | 4 |
| NGC5204 | 36 | 1 | 23.6 | 4 | 6.1 | 0.13 | 0.03 | 3.1 | 8.1 | 7.5 | 16 | 4 |
| NGC5585 | 5 | 1 | 6.9 | / | 2.7 | 0.18 | 0.03 | 2.1 | 8.1 | 3.3 | 12 | 7 |
| NGC6946 | 26 | 0.95 | 12.1 | / | 5.0 | 0.54 | 1.54 | 69.2 | 288.4 | 0.2 | 12 | 7 |
| M101 | 73 | 0.98 | 35.0 | / | 19.2 | 0.54 | 0.02 | 39.8 | 213.8 | 0.8 | 12 | 7,12 |
| M74 | 9 | 0.83 | 9.4 | / | 6.0 | 0.4 | 0.21 | 11.6 | 74.1 | 0.8 | 12 | 13 |
| NGC2903 | 5 | 1 | 4.9 | / | 4.6 | 0.56 | 0.1 | 12.4 | 117.5 | 0.4 | 12 | 14 |
∗ From Kennicutt et al. (2008).
References: (1) Lee & Lee 2014; (2) Long et al. 2010; (3) Millar et al. 2011; (4) Leonidaki et al. 2013; (5) Matonick et al. 1997; (6) de Grijs et al. 2000; (7) Matonick & Fesen 1997; (8) Blair & Long 1997; (9) Dopita et al. 2010; (10) Blair et al. 2013; (11) Blair et al. 2014 (12) Franchetti et al. 2012; (13) Sonbas et al. 2010; (14) Sonbas et al. 2009.
Table 2 shows us that the percentage of H emission originating from the SNR contamination is within the range of 0.1–13%. From Column (11) of Table 2 we see that six out of seven highest values in this column originate from the paper by Leonidaki et al. (2013), and are within the range of 5–13%. Such a high percentage of around 10% is not a negligible source of error in determined SFRs. The situation that six out of seven highest values are coming from the same group of authors does introduce doubt in their plausibility. It could be that the source of this high efficiency in the detection of SNRs in Leonidaki et al. (2013) is because they used a somewhat milder [S ii]H criterion for SNR detection. This lower criterion was also used in Dopita et al. (2010). Also, we add to this that Leonidaki et al. (2013) detected 150 SNRs in NGC2403, while Matonick et al. (1997) detected only 35. When we compare differences in telescopes and exposure times used by these two groups, it is expected to have two times higher detection efficiency by Matonick et al. (1997) than by Leonidaki et al. (2013). Although, one should have in mind that Matonick et al. (1997) used a stronger [S ii]H criterion.
M83 galaxy is the third on the list of the highest percentage of SNR H emission contamination – 9%. This galaxy boasts the largest number of optical SNRs (296), and is the best sampled for optical SNRs among all galaxies. It is not something to be surprised at, when one knows that M83 was observed with 4 m Blanco telescope (Blair & Long 2004), then with HST (Dopita et al. 2010, Blair et al. 2014) and with Magellan I 6.5m telescope with very long exposures (Blair et al. 2012). For this reason, we think that the percentage similar to the one found in M83 is expected to be somewhat closer to the real contribution of the SNRs emission to the total H emission in spiral galaxies.
We emphasize that in our estimates of the H fluxes from SNRs in each galaxy, we have taken fluxes from both confirmed SNRs (confirmed either spectroscopically or by observations through other wavelengths) and SNR candidates, which have been classified only upon the [S ii]H ratio criterion. This could lead to the overestimation of percentage R, considering that there might be numerous false identifications of SNR candidates.
In Column (3) of Table 2 we present what fraction of angular extension of a galaxy has been covered with observations for optical SNRs. The majority of galaxies have been fully covered, four of them have been more than 80% covered, while M82 galaxy has only a small fraction of disk observed for SNRs. In galaxies which have not been fully observed, only the outer parts of galactic surface have not been covered. If we assume that SNe follow radial distribution of gas and dust in galaxy (Hatano, Branch & Deaton 1998), then we expect that the number of SNe, as well as the number of SNRs, will rapidly decrease as we move away from the galactic center. In this context, as only the outer parts of galaxies have not been observed, we do not expect a major change of number of SNRs and their total H flux if the whole galactic surface were to be observed. Only in the case of M82 the change would be significant, but due to a large internal extinction in that galaxy, it is hard to estimate the number of SNRs that would be detected in the galaxy as a whole.
Another very important question which we discuss here is how we can compare data collected in very different studies, with different flux sensitivities and from different galaxies.
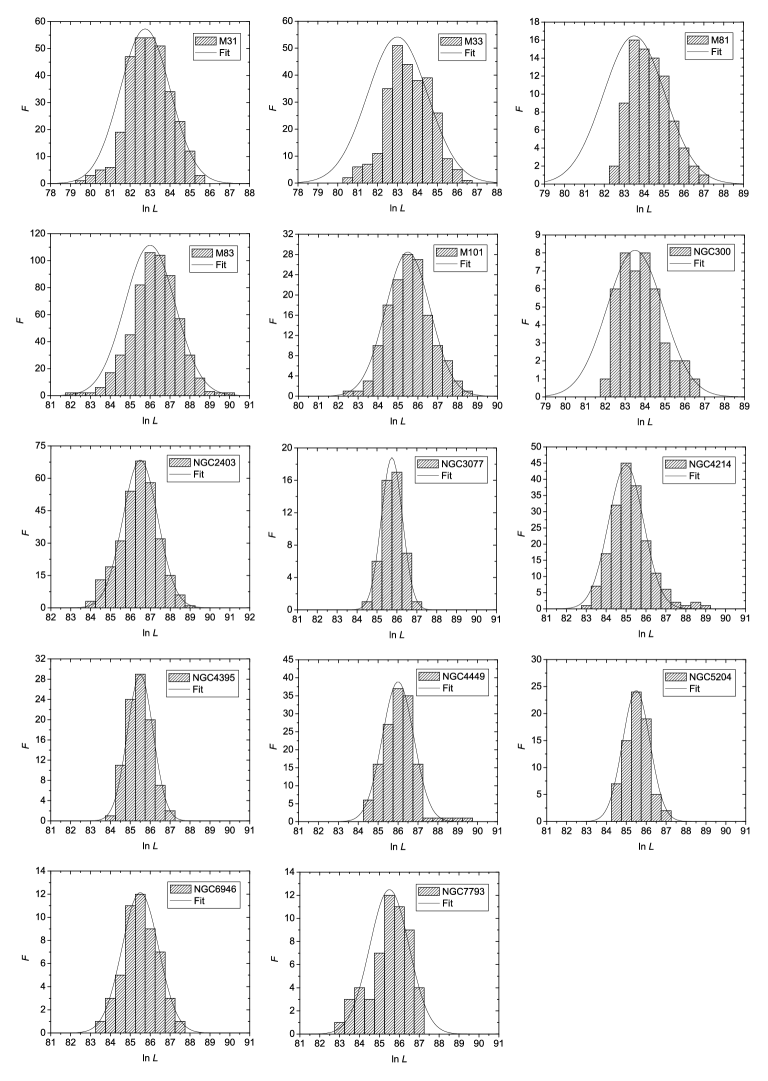
In order to discuss the completeness of the samples, we have to assume some number distribution function of SNRs with respect to flux or luminosity – we shall choose luminosity so than we can compare different samples. If this distribution is log-normal i.e. normal or gaussian in the logarithmic scale, , then from the fit we can estimate the number of missing SNRs , where and are the corrected and detected number of SNRs, and their contribution to the total H luminosity. is the natural logarithm of luminosity which corresponds to the maximum of the distribution i.e. the mean and is the standard deviation of normal distribution.
It is usually assumed that a sample is complete for high fluxes (or luminosities) up to the maximum (Leonidaki et al. 2013; Matonick & Fesen 1997). While it is quite likely that we will detect all bright and luminous objects, we can still miss the extended low surface-brightness (and thereby luminous) SNRs. However, we will assume that these are rare.
We have thus fitted only the right-hand side of the observed distributions, excluding local minima and bars which are lower than their left-hand side counterparts and keeping the mean i.e. fixed. We could do this only for 14 galaxies from our sample, which have enough SNRs detected in order to have the distribution of the number of SNRs over luminosities. The results are given in Fig 1 and Table 3. When fit parameters and have been found we can obtain the corrected total luminosity of SNRs which is actually the mean of the log-normal distribution
| (2) |
where .
Now we can also obtain ratio of H luminosity coming from the SNRs to the total H luminosity of the galaxy, which is corrected for possible incompleteness of the SNR sample – R∗. If we compare uncorrected R and corrected R∗ (from Table 3) we can see that there is the biggest change in values for M33 and NGC4214 galaxies, but highest value of 13% of SNR contamination is not changed.
| Galaxy | ln | ln | (erg s-1) | (erg s-1) | R | R∗ | |||||
|---|---|---|---|---|---|---|---|---|---|---|---|
| M31 | 156 | 181 | 6 | 79.51 | 82.75 | 1.26 | 0.05 | 2.76 | 3.47 | 1.03 | 1.29 |
| M33 | 137 | 205 | 15 | 80.53 | 83 | 1.51 | 0.11 | 4.60 | 7.13 | 1.42 | 2.20 |
| M81 | 41 | 64 | 3 | 82.89 | 83.5 | 1.55 | 0.07 | 2.99 | 3.90 | 0.50 | 0.66 |
| M83 | 296 | 355 | 10 | 82.12 | 86 | 1.27 | 0.07 | 1.56 | 1.78 | 8.78 | 10.00 |
| M101 | 73 | 80 | 4 | 82.61 | 85.5 | 1.12 | 0.05 | 1.91 | 2.03 | 0.88 | 0.95 |
| NGC300 | 22 | 29 | 2 | 82.43 | 83.5 | 1.42 | 0.09 | 1.11 | 1.46 | 0.73 | 0.96 |
| NGC2403 | 150 | 151 | 3 | 84.06 | 86.5 | 0.88 | 0.03 | 7.71 | 8.20 | 12.77 | 13.60 |
| NGC3077 | 24 | 25 | 1 | 84.87 | 85.75 | 0.53 | 0.01 | 4.96 | 5.01 | 5.18 | 5.24 |
| NGC4214 | 92 | 98 | 4 | 83.28 | 85 | 0.88 | 0.04 | 1.82 | 1.19 | 11.71 | 7.66 |
| NGC4395 | 47 | 47 | 2 | 84.25 | 85.5 | 0.65 | 0.02 | 6.88 | 7.87 | 6.02 | 6.86 |
| NGC4449 | 71 | 77 | 6 | 84.73 | 86 | 0.79 | 0.08 | 2.57 | 2.35 | 5.03 | 4.58 |
| NGC5204 | 36 | 42 | 2 | 84.56 | 85.5 | 0.69 | 0.03 | 6.12 | 7.22 | 7.50 | 8.89 |
| NGC6946 | 26 | 28 | 1 | 83.63 | 85.5 | 0.92 | 0.03 | 5.05 | 5.80 | 0.17 | 0.20 |
| NGC7793 | 27 | 31 | 4 | 83.42 | 85.5 | 0.99 | 0.11 | 5.30 | 6.86 | 1.39 | 1.80 |
We can see that, according to the fit, only in galaxies M33, M81 and NGC300 there is a significant number of low luminous SNRs missing. However, because of the characteristics of log-normal distribution, is not very different from uncorrected total H luminosity of SNRs, neither for these three nor for all other galaxies. For two galaxies, NGC4214 and NGC4449, is slightly smaller than , which is due to the existence of very bright SNRs in these galaxies i.e. the distribution can not be approximated with a single gaussian.
Even if the real distribution over luminosities is indeed gaussian (in the logarithmic scale), which may be an overly simplistic assumption, because of the selection effects and sensitivity limits, the observed mean i.e. the logarithm of luminosity which corresponds to the maximum of the distribution may not be the true mean , which in reality may be shifted to lower luminosities. In principle, we may expect that if the sensitivity limit i.e. the minimum luminosity is far from , the mode i.e. mean is well determined. To test this, we have looked for a possible correlation between the corrected ratio of H luminosity coming from the SNRs to the total H luminosity of the galaxy R∗ and in spirals – galaxies with high should then have a more reliable (and higher) R. However, no evident correlation can be seen from Fig. 2. We have also checked if there is any correlation between R∗ and galaxy properties - inclination and galaxy type, but again without much success (Figs. 3 and 4).


4.1 SNR contamination and SN type
If we discuss different types of SN explosions and the remnants they leave, we assume that remnants of type Ia SNe are not as easily detectable as those of type II or Ib/c. Type Ia SNe have a possible tendency to occur in the low-density regions of a galaxy and leave no optically detectable remnants. Similarly, Balmer-dominated SNRs which are thought to be related to type Ia SNe (van den Bergh 1988) will be missed by optical searches using [S ii]/H0.4 criterion. Study on SN rate by Mannucci et al. (2005) found that there is about 25% of type Ia explosions in spiral and irregular galaxies. This is in good agreement with Lee & Lee (2014), who suppose that 23% of all optical SNRs in M31 originated from type Ia events. Furthermore, Braun & Walterbos (1993) estimated that about half of all core-collapse SNe (type II or Ib/c), will happen in associations and leave no detectable remnant. With these assumptions, we would be able to optically detect only about one third of all SNRs. This occurs since only a few SNRs are observed inside H ii regions and because optical search appears biased against detecting large and faint SNRs. Although SNRs are rarely detected inside H ii regions and stellar associations, there must certainly be SNRs inside such objects (remnants of type II and Ib/c SNe). There is evidence that SNRs are often associated with giant H ii regions – in 30 Doradus giant H ii region in LMC (Ye 1988), in SMC (Ye, Turtle & Kennicutt 1991), in NGC4449 (Kirshner & Blair 1980). Even though SNRs embedded in an H ii region are not separated from the associated region, we expect that there must be some contribution from such SNRs to the total H radiation, which should increase influence of SNR contamination on SFRs.
The selection effects that affect detection of SNRs are related to an observational fact that the optical SNRs on average lie in regions of lower gas density. Due to this they are biased against star forming regions, which typically tend to have higher than average gas density (for details on this observational bias see Pannuti et al. 2000). Taking this into account, we emphasize that derived percentages of the H emission from the SNRs to the total H fluxes used to estimate SFRs in the galaxies represent only a lower limit.
5 Conclusions
Out of 25 nearby galaxies with observed SNRs in optical range, we have presented details on SNRs detection for our sample of 18 galaxies. We have discussed the contribution of the H fluxes from the SNRs to the total H flux and its influence to the derived SFR for each galaxy in the sample. We have found that the average SNR contamination to the total H flux and derived SFRs for analysed nearby galaxies is %. The highest SNR contamination is about 13%. M83 galaxy is best sampled for optical SNRs and it has 9% of SNRs in total H emission. We expect that percentages similar to this one should be close to the real contribution of the SNRs emission to the total H emission in spiral galaxies. Due to the selection effects, the SNR H contamination obtained in this paper represent only a lower limit.
Acknowledgments
We are grateful to Miroslav Filipović for useful comments and suggestions, Dragana Momić for careful reading and correction of the manuscript and to the anonymous referee for a comprehensive report that helped us improve it significantly. This research has been supported by the Ministry of Education, Science and Technological Development of the Republic of Serbia through project No. 176005 ”Emission nebulae: structure and evolution” and it is a part of the joint project of Serbian Academy of Sciences and Arts and Bulgarian Academy of Sciences ”Optical search for supernova remnants and H ii regions in nearby galaxies (M81 group and IC342)”. This research has made use of the NASA/IPAC Extragalactic Database (NED) which is operated by the Jet Propulsion Laboratory, California Institute of Technology, under contract with the National Aeronautics and Space Administration, and NASA’s Astrophysics Data System Bibliographic Services.
References
- Abolmasov (2007) Abolmasov P., Fabrika S., Sholukhova O., Afanasiev V., 2007, Astrophysical Bulletin, 62, 36
- Adelman-McCarthy et al. (2006) Adelman-McCarthy J. K. et al. 2006, ApJS, 162, 38
- Andjelić (2011) Andjelić M. M., 2011, Serb. Astron. J., 183, 71
- Arbutina et al. (2009) Arbutina B., Ilić, D., Stavrev K., Urośević D., Vukotić B., Onić D., 2009, Serb. Astron. J., 179, 87
- Azimlu, Marciniak & Barmby (2011) Azimlu M., Marciniak R., Barmby P., 2011, AJ, 87, 1165
- Badenes, Maoz & Draine (2010) Badenes C., Maoz D., Draine B. T., 2010, MNRAS, 407, 1301
- Balick & Heckman (1978) Balick B., Heckman T., 1978, ApJ, 226, L7
- Barbon et al. (2010) Barbon R., Buondi V., Cappellaro E., Turatto M., 2010, VizieR Online Data Catalog 102024
- Bechtold et al. (1997) Bechtold J., Yee H. K. C., Elston R., Ellingson E., 1997, ApJL, 477, L29
- Blair & Fesen (1994) Blair W. P., Fesen R. A., 1994, ApJ, 424, 103
- Blair & Long (1997) Blair W. P., Long K. S., 1997, ApJS, 108, 261
- Blair & Long (2004) Blair W. P., Long K. S., 2004, ApJS, 155, 101
- Blair, Kirshner, & Chevalier (1981) Blair W. P., Kirshner R. P., Chevalier R. A., 1981, ApJ, 247, 879
- Blair, Kirshner, & Winkler (1983) Blair W. P., Kirshner R. P., Winkler P. F., 1983, ApJ, 272, 84
- Blair, Fesen & Schlegel (2001) Blair W. P., Fesen R. A., Schlegel E. M., 2001, AJ, 121, 1497
- Blair, Winkler & Long (2012) Blair W. P., Winkler P. F., Long K. S., 2012, ApJS, 203, 8
- Blair, Winkler & Long (2013) Blair W. P., Winkler P. F., Long K. S., 2013, ApJS, 207, 40
- Blair et al. (2014) Blair W. P. et al., 2014, ApJ, 788, 55
- Bozzetto et al. (2012a) Bozzetto L. M., Filipović M. D., Crawford E. J., De Horta A. Y., Stupar M., 2012, Serb. Astron. J., 184, 69
- Bozzetto et al. (2012b) Bozzetto L. M., Filipović M. D., Urošević D., Crawford E. J., 2012, Serb. Astron. J., 185, 25
- Bozzetto et al. (2012c) Bozzetto L. M. et al., 2012, MNRAS, 420, 2588
- Bozzetto et al. (2013) Bozzetto L. M. et al., 2013, MNRAS, 432, 2177
- Bozzetto et al. (2014) Bozzetto L. M. et al., 2014, MNRAS, 439, 1110
- Braun & Walterbos (1993) Braun R., Walterbos R. A. M., 1993, A&AS, 98, 327
- Butler, Martínez-Delgado & Brandner (2004) Butler D. J., Martínez-Delgado D., Brandner W., 2004, AJ, 127, 1472
- Chomiuk & Wilcots (2009) Chomiuk L., Wilcots E. M., 2009, AJ, 137, 3869
- Conn et al. (2012) Conn A. R. et al., 2012, ApJ, 758, 11
- CČajko, Crawford & Filipović (2009) Čajko K. O., Crawford E. J., Filipović M. D., 2009, Serb. Astron. J., 179, 55
- de Horta et al. (2012) de Horta A. Y. et al., 2012, A&A, 540, 25
- Dickel & D’Odorico (1984) Dickel J. R., D’Odorico S., 1984, MNRAS, 206, 351
- Dickel et al. (1982) Dickel J. R., D’Odorico S., Felli M., Dopita M. A., 1982, ApJ, 252, 582
- D’Odorico & Dopita (1983) D’Odorico S., Dopita M. A., 1983, in Supernova remnants and their X-ray emission; Proceedings of the Symposium, Venice, Italy, 1982, Dordrecht, D. Reidel Publishing Co., p. 517
- D’Odorico et al. (1980) D’Odorico S., Dopita M. A., Benvenuti P., 1980, A&AS, 40, 67
- Donas & Deharveng (1984) Donas J., Deharveng J. M., 1984, A&A, 140, 325
- Dopita et al. (2010a) Dopita M. A. et al., 2010, ApJ, 710, 964
- Dopita et al. (2010b) Dopita M. A. et al., 2010, Ap&SS, 330, 123
- Dopita et al. (2012) Dopita M. A., Payne J. L., Filipović M. D., Pannuti T. G., 2012, MNRAS, 427, 956
- Drozdovsky & Karachentsev (2000) Drozdovsky I. O., Karachentsev I. D., 2000, A&AS, 142, 425
- de Grijs et al. (2000) de Grijs R., O’Connell R. W., Becker G. D., Chevalier R. A., Gallagher J. S., 2000, AJ, 119, 681
- Eck, Cowan & Branch (2002) Eck C. R., Cowan J. J., Branch D., 2002, ApJ, 573, 306
- Elmegreen et al. (2006) Elmegreen B. G., Elmegreen D. M., Chandar R., Whitmore B., Regan, M., 2006, ApJ, 644, 879
- Fabbiano (1988) Fabbiano G., 1988, ApJ, 325, 544
- Fenech et al. (2008) Fenech D. M., Muxlow T. W. B., Beswick R. J., Pedlar A., Argo M. K., 2008, MNRAS, 391, 1384
- Fenech et al. (2010) Fenech D. M., Beswick R. J., Muxlow T. W. B., Pedlar A., Argo M. K., 2010, MNRAS, 408, 607
- Feng & Kaaret (2008) Feng H., Kaaret P., 2008, ApJ, 675, 1067
- Freedman et al. (2001) Freedman W. L. et al., 2001, ApJ, 553, 47
- Ferguson et al. (1996) Ferguson A. M. N., Wyse R. F. G., Gallagher J. S., Hunter D. A., 1996, AJ, 111, 2265
- Filipović et al. (1998) Filipović M. D., Haynes R. F., White G. L., Jones P. A., 1998, A&AS, 130, 421
- Filipović et al. (2005) Filipović M. D., Payne J. L., Reid W., Danforth C. W., Staveley-Smith L., Jones P. A., White G. L., 2005, MNRAS, 364, 217
- Fossey et al. (2014) Fossey J., Cooke B., Pollack G., Wilde M., Wright T., 2014, Central Bureau Electronic Telegrams, ed. Green D. W. E., 3792, 1
- Franchetti et al. (2012) Franchetti N. A. et al., 2012, AJ, 143, 85
- Franchetti et al. (2012) Franchetti N. A. et al., 2012, AJ, 143, 85
- Gallagher , Hunter & Mould (1984) Gallagher J. S. III, Hunter D. A., Mould J. R., 1984, ApJ, 281, L63
- Garn et al. (2010) Garn T. et al., 2010, MNRAS, 402, 2007
- Geach et al. (2008) Geach J. E., Smail I., Best P. N., Kurk, J., Casali M., Ivison R. J., Coppin, K., 2008, MNRAS, 388, 1473
- Gladstone, Roberts, & Done (2009) Gladstone J. C., Roberts T. P., Done C., 2009, MNRAS, 397, 1836
- Gonçalves et al. (2012) Gonçalves D. R., Magrini L., Martins L. P., Teodorescu A. M., Quireza C., 2012, MNRAS, 419, 854
- Gordon et al. (1998) Gordon S. M., Kirshner R. P., Long K. S., Blair W. P., Duric N., Smith R. C., 1998, ApJS, 117, 89
- Gordon et al. (1999) Gordon S. M., Duric N., Kirshner R. P., Goss W. M., Viallefond, F., 1999, ApJS, 120, 247
- Grisé et al. (2011) Grisé F., Kaaret P., Pakull M. W., Motch C., 2011, ApJ, 734, 23
- Haberl et al. (2012a) Haberl F. et al., 2012, A&A, 543, 154
- Haberl et al. (2012b) Haberl F. et al., 2012, A&A, 545, 128
- Hatano, Branch & Deaton (1998) Hatano K., Branch D., Deaton J., 1998, Apj,502 , 177
- Hodge (1977) Hodge P. W., 1977, ApJS, 33, 69
- Hopkins & Beacom (2006) Hopkins A. M., Beacom J. F., 2006, ApJ, 651, 142
- Hopkins et al. (2011) Hopkins P. F., Quataert E., Murray N., 2011, MNRAS, 417, 950
- Huang et al. (1994) Huang Z. P., Thuan T. X., Chevalier R. A., Condon J. J., Yin Q. F., 1994, ApJ, 424, 114
- Huchra et al. (1983) Huchra J. P., Geller M. J., Gallagher J., Hunter D., Hartmann L., Fabbiano G., Aaronson M., 1983, ApJ, 274, 125
- James et al. (2005) James P. A., Shane N. S., Knapen J. H., Etherton J., Percival S. M., 2005, A&A, 429, 851
- Karachentsev & Kaisin (2007) Karachentsev I. D., Kaisin S. S. 2007, ApJ, 133, 1883
- Karachentsev, Kopylov & Kopylova (1994) Karachentsev I. D., Kopylov A. I., Kopylova F. G., 1994, Bull. Spec. Astrophys. Obs., 38, 5
- Karachentsev et al. (2002) Karachentsev I. D. et al., 2002, A&A, 383, 125
- Karachentsev et al. (2003a) Karachentsev I. D. et al., 2003, A&A, 404, 93
- Karachentsev et al. (2003b) Karachentsev I. D. et al., 2003, A&A, 398, 479
- Karachentsev et al. (2004) Karachentsev I. D., Karachentseva V. E., Huchtmeier W. K., Makarov D. I., 2004, AJ, 127, 2031
- Karim et al. (2011) Karim A. et al., 2011, ApJ, 730, 61
- Kaufman et al. (1987) Kaufman M., Bash F. N., Kennicutt R. C., Hodge P. W., 1987, ApJ, 319, 61
- Kennicutt (1983) Kennicutt R. C., 1983, ApJ, 272, 54
- Kennicutt (1998) Kennicutt R. C., 1998, ARA&A, 36, 189
- Kennicutt & Kent (1983) Kennicutt R. C., Kent S. M. 1983, AJ, 88, 1094
- Kennicutt & Evans (2012) Kennicutt R. C., Evans N. J. 2012, ARA&A, 50, 531
- Kennicutt, Tamblyn & Congdon (1994) Kennicutt R. C., Tamblyn P., Congdon C. E., 1994, ApJ, 435, 22
- Kennicutt et al. (2008) Kennicutt R. C., Lee J. C., Funes J. G., Sakai S., Akiyama S., 2008, ApJS, 178, 247
- Kennicutt et al. (2009) Kennicutt R. C. et al., 2009, ApJ, 703, 1672
- Kirshner & Blair (1980) Kirshner R. P., Blair W. P., 1980, ApJ, 236, 135
- Kong et al. (2003) Kong A. K. H., Sjouwerman L. O., Williams B. F., Garcia M. R., Dickel J. R. 2003, ApJ, 590, L21
- Kong, Sjouwerman & Williams (2004) Kong A. K. H., Sjouwerman L. O. , Williams B. F., 2004, ApJ, 128, 2783
- Kronberg & Wilkinson (1975) Kronberg P. P., Wilkinson P. N., 1975, ApJ, 200, 430
- Kronberg, Biermann & Schwab (1985) Kronberg P. P., Biermann P., Schwab F. R., 1985, ApJ, 291, 693
- Kumar (1976) Kumar C. K., 1976, PASP, 88, 323
- Lacey, Duric & Goss (1997) Lacey C. K., Duric N., Goss W. M., 1997, ApJS, 109, 417
- Lacey, Goss & Mizouni (2007) Lacey C. K., Goss W. M., Mizouni L. K., 2007, AJ, 133, 2156
- Lee & Lee (2014) Lee J. H., Lee M. G., 2014, ApJ, 786, 130
- Leievre & Roy (2000) Leievre M., Roy J. R., 2000, ApJ, 120, 1306
- Lenc & Tingay (2006) Lenc E., Tingay S. J., 2006, AJ, 132, 1333
- Leonidaki, Zezas & Boumis (2010) Leonidaki I., Zezas A., Boumis P., 1983, ApJ, 725, 842
- Leonidaki, Boumis & Zezas (2013) Leonidaki I., Boumis P., Zezas A., 2013, MNRAS, 429, 189
- Long et al. (2010) Long K. S. et al., 2010, ApJS, 187, 495
- Lozinskaya et al. (1998) Lozinskaya T. A., Silchenko O. K., Helfand D. J., Goss W. M., 1998, AJ, 116, 2328
- Maddox et al. (2006) Maddox L. A., Cowan J. J., Kilgard R. E., Lacey C. K., Prestwich A. H., Stockdale C. J., Wolfing E., 2006, AJ, 132, 310
- Maggi et al. (2012) Maggi P. et al., 2012, A&A, 546, 109
- Magnier et al. (1995) Magnier E. A., Prins S., van Paradijs J., Lewin W. H. G., Supper R., Hasinger G., Pietsch W., Trumper J., 1995, A&AS, 114, 215
- Mannucci et al. (2005) Mannucci F. et al., 2005, A&A, 433, 807
- Markoff et al. (2008) Markoff S. et al., 2008, ApJ, 681, 905
- Massey et al. (2006) Massey P., Olsen K. A. G., Hodge P. W., Strong S. B., Jacoby G. H., Schlingman W., Smith R. C., 2006, AJ, 131, 2478
- Martínez-Delgado, Aparicio & Gallart (1999) Martínez-Delgado D., Aparicio A., Gallart C., 1999, AJ, 118, 2229
- Mathewson & Clarke (1972) Mathewson D. S., Clarke J. N., 1972, ApJ, 178, L107
- Mathewson & Clarke (1973a) Mathewson D. S., Clarke J. N., 1973, ApJ, 180, 725
- Mathewson & Clarke (1973b) Mathewson D. S., Clarke J. N., 1973, ApJ, 182, 697
- Mathewson et al. (1983) Mathewson D. S., Ford V. L., Dopita M. A., Tuohy I. R., Long K. S., Helfand D. J., 1983, ApJS, 51, 345
- Mathewson et al. (1984) Mathewson D. S., Ford, V. L., Dopita M. A., Tuohy I. R., Mills B. Y., Turtle A. J., 1984, ApJS, 55, 189
- Mathewson et al. (1985) Mathewson D. S., Ford V. L., Tuohy I. R., Mills B. Y., Turtle A. J., Helfand D. J., 1983, ApJS, 58, 197
- Matonick & Fesen (1997) Matonick D. M., Fesen R. A., 1997, ApJS, 112, 49
- Matonick et al. (1997) Matonick D. M., Fesen R. A., Blair W. P., Long K. S., 1997, ApJS, 113, 333
- Millar et al. (2011) Millar W. C., White G. L., Filipović M. D., Payne J. L., Crawford E. J., Pannuti T. G., Staggs W. D., 2011, Ap&SS, 332, 221
- Moon et al. (2011) Moon D., Harrison F. A., Cenko S. B., Shariff J. A., 2011, ApJL, 731, 32
- Murphy Williams et al. (2010) Murphy Williams, R. N., Dickel, J. R., Chu, Y., Points, S., Winkler, F., Johnson, M., Lodder, K. 2010, Bulletin of the American Astronomical Society, 41, 470
- Muxlow et al. (1994) Muxlow T. W. B., Pedlar A., Wilkinson P. N., Axon D. J., Sanders E. M., de Bruyn A. G., 1994, MNRAS, 266, 455
- Oey & Kennicutt (1997) Oey, M. S., Kennicutt R. C., 1997, MNRAS, 291, 827
- Ott, Martin & Walter (2003) Ott J., Martin C. L., Walter F., 2003, ApJ, 594, 776
- Pakull, Soria & Motch (2010) Pakull M. W., Soria R., Motch C., 2010, Nature, 466, 209
- Pannuti et al. (2000) Pannuti T. G., Duric N., Lacey C. K., Goss W. M., Hoopes C.G.,Walterbos R. A. M., Magnor M. A., 2000, ApJ, 544, 780
- Pannuti et al. (2002) Pannuti T. G., Duric N., Lacey C. K., Ferguson A. M. N., Magnor M. A., Mendelowitz C., 2002, ApJ, 565, 966
- Pannuti et al. (2011) Pannuti T. G., Schlegel E. M., Filipović M. D., Payne J. L., Petre R., Harrus I. M., Staggs W. D., Lacey C. K., 2011, AJ, 142, 20
- Pannuti, Schlegel & Lacey (2007) Pannuti T. G., Schlegel E. M., Lacey C. K., 2007, AJ, 133, 1361
- Patnaude & Fesen (2003) Patnaude D. J., Fesen R. A., 2003, ApJ, 587, 221
- Payne et al. (2004) Payne J. L., Filipović M. D., Pannuti T. G., Jones P. A., Duric N., White G. L., Carpano S., A&A 425, 443
- Payne et al. (2007) Payne J. L., White G. L., Filipović M. D., Pannuti T. G., 2007, MNRAS, 376, 1793
- Payne, White & Filipović (2008) Payne J. L., White G. L., Filipović M. D., 2008, MNRAS, 383, 1175
- Peimbert, Bohigas, & Torres-Peimbert (1988) Peimbert M., Bohigas J., Torres-Peimbert S., 1988, Rev. Mex. Astron. Astrofis., 16, 45
- Pietsch, Freyberg & Haberl (2005) Pietsch W., Freyberg M., Haberl F., 2005, A&A, 434, 483
- Rieke & Lebofsky (1978) Rieke G. H., Lebofsky M. J., 1978, ApJL, 220, L37
- Plucinsky et al. (2008) Plucinsky P. P. et al., 2008, ApJS, 174, 366
- Roberts & Colbert (2003) Roberts T. P., Colbert E. J. M., 2003, MNRAS, 341, 49
- Roberts et al. (2003) Roberts T. P., Goad M. R., Ward M. J., Warwick R. S., 2003, MNRAS, 342, 709
- Rosa-Gonzalez (2005) Rosa-Gonzalez D., 2005, MNRAS, 364, 1304
- Roy (1996) Roy J.-R., Belley J., Dutil Y., Martin P., 1996, ApJ, 460, 284.
- Salpeter (1955) Salpeter E. E., 1955, ApJ, 121, 161
- Sandage (1971) Sandage A. R. 1971, ApJ, 166, 13
- Sasaki et al. (2012) Sasaki M., Pietsch W., Haberl F., Hatzidimitriou D., Stiele H., Williams B. F., Kong A. K. H., Kolb U., 2012, A&A, 544, 144
- Saha, Claver & Hoessel (2002) Saha A., Claver J., Hoessel J. G., 2002, AJ., 124, 839
- Sakai & Madore (1999) Sakai S., Madore B. F., 1999, ApJ, 526, 599
- Schlegel (1994) Schlegel M., 1994, ApJ, 424, 99
- Searle, Sargent & Bagnuolo (1973) Searle L., Sargent W. L. W., Bagnuolo W. G., 1973, ApJ, 179, 427
- Seaquist & Bignell (1978) Seaquist E. R., Bignell R. C., 1978, ApJL, 226, 5
- Sersic (1973) Sersic J. L., 1973, PASP, 85, 103
- Sharina, Karachentsev & Tikhonov (1996) Sharina M. E., Karachentsev I. D., Tikhonov N. A., 1996, A&AS, 119, 499
- Skillman (1985) Skillman E. D., 1985, ApJ, 290, 449
- Smith, Leiton & Pizarro (2000) Smith C., Leiton R., Pizarro S., 2000, in Astronomical Society of the Pacific Conference Series, Vol. 221, Stars, Gas and Dust in Galaxies: Exploring the Links, eds., D. Alloin, K. Olsen, & G. Galaz, p. 83
- Sobral et al. (2012) Sobral D., Best P. N., Matsuda Y., Smail I., Geach J. E., Cirasuolo M., 2012, MNRAS, 420, 1926
- Sobral et al. (2013) Sobral A. et al., 2013, MNRAS, 428, 1128
- Sonbas, Akuyz & Balman (2009) Sonbas E., Akyuz A., Balman S., 2009, A&A, 493, 1061
- Sonbas et al. (2010) Sonbas E., Akyuz A., Balman S., Özel M. E., 2010, A&A, 517, 9
- Soria & Wu (2003) Soria R., Wu K., 2003, A&A, 410, 53
- Soria, Pian & Mazzali (2004) Soria R., Pian E., Mazzali P. A., 2004, A&A, 413, 107
- Soria et al. (2010) Soria R., Pakull M., Broderick J., Corbel S., Motch C., 2010, AIP Conference Proceedings, 1248, 127
- Sramek (1992) Sramek R., 1992, in ASP Conf. Ser. 31, Relationships Between Active Galactic Nuclei and Starburst Galaxies, ed. A. V. Filipenko (San Francisco, CA: ASP), 273
- Sramek & Weedman (1986) Sramek R. A., Weedman D. W., 1986, ApJ, 302, 640S
- Stiele et al. (2011) Stiele H., Pietsch W., Haberl F., Hatzidimitriou D., Barnard R., Williams B. F., Kong A. K. H., Kolb U., 2011, A&A, 534, A55
- Summers et al. (2003) Summers L. K., Stevens I. R., Strickland D. K., Heckman T. M., 2003, MNRAS, 342, 690
- Supper et al. (2001) Supper R., Hasinger G., Lewin W. H. G., Magnier E. A., van Paradijs J., Pietsch W., Read A. M., Trumper J., 2001, A&A, 373, 63
- Thim et al. (2003) Thim F., Tammann G. A., Saha A., Dolphin A., Sandage A., Tolstoy E., Labhardt L., 2003, ApJ, 590, 256
- Tully (1988) Tully R., 1988, Nearby Galaxies Catalog, Cambridge Univ. Press, Cambridge
- Tully et al. (2006) Tully R. B et al., 2006, AJ, 132, 729
- Turner & Ho (1983) Turner J. L., Ho P. T. P., 1983, ApJL, 268, 79
- Turner & Ho (1994) Turner J. L., Ho P. T. P., 1994, ApJ, 421, 122
- Tsai et al. (2006) Tsai, Chao-Wei, Turner, J. L., Beck, S. C., Crosthwaite L. P., Ho P. T. P., Meier D. S., 2006, AJ, 132, 2383
- Ulvestad (2000) Ulvestad J. S., 2000, AJ, 120, 278
- van den Bergh (1988) van den Bergh S., 1988, ApJ, 327, 156
- van den Bergh (2000) van den Bergh S., 2000, PASP, 112, 529
- van der Heyden, Bleeker & Kaastra (2004) van der Heyden K. J., Bleeker J. A. M., Kaastra J. S., 2004, A&A, 421, 1031
- Villar et al. (2008) Villar V. et al., 2008, ApJ, 677, 169
- Villar et al. (2011) Villar V., Gallego J., Pérez-Gonzàlez P. G., Barro G., Zamorano J., Noeske K., Koo D. C., 2011, ApJ, 740, 47
- Vučetić et al. (2013) Vučetić M. M., Arbutina B., Urošević D., Dobardžić A., Pavlović M. Z., Pannuti T. G., Petrov N., 2013, Serb. Astron. J., 187, 11
- Vukotić et al. (2005) Vukotić B., Bojičić I., Pannuti T. G., Urošević D., 2005, Serb. Astron. J., 170, 101
- Walter et al. (2002) Walter F., Weiss A., Martin C., Scoville N., 2002, AJ, 123, 225
- Williams et al. (1999) Williams R. M., Chu Y.-H., Dickel J. R., Petre R., Smith R. C., Tavarez M., 1999, ApJS, 123, 467
- Williams et al. (2004) Williams B. F., Sjouwerman L. O., Kong A. K. H., Gelfand J. D., Garcia M. R., Murray S. S., 2004, ApJ, 615, 720
- Yang, Skillman & Sramek (1994) Yang H., Skillman E. D., Sramek R. A., 1994, AJ, 107, 651
- Ye (1988) Ye T., 1988, PhD thesis, University of Sidney
- Ye, Turtle & Kennicutt (1991) Ye T., Turtle A. J., Kennicutt R. C., 1991, MNRAS, 249, 722
Appendix A Optical SNRs in nearby galaxies
This is a sample of Table A1. The complete Table A1, as well as the Tables A2-A18, are available in Online Appendix.
| Object | RA | Dec. | F(H) | Diameter | [S ii]/H |
|---|---|---|---|---|---|
| name | (J2000.0) | (J2000.0) | (erg cm-2 s-1) | (″) | ratio |
| (°) | (°) | ||||
| 1 | 9.4056797 | 39.862778 | 7.8 | 12.9 | 0.86 |
| 2 | 9.8472862 | 40.738834 | 51.5 | 15.3 | 1.06 |
| 3 | 9.8783941 | 40.357998 | 7.1 | 8.8 | 0.96 |
| 4 | 9.9373655 | 40.498367 | 31.8 | 12.6 | 1.09 |
| 5 | 9.9593277 | 40.349838 | 43.9 | 14.8 | 0.40 |
| 6 | 9.968482 | 40.495148 | 112.7 | 19.6 | 0.67 |
| … | … | … | … | … | … |
| 156 | 11.6789007 | 42.21674 | 9.2 | 13.6 | 1.12 |
∗Note: data taken from Lee & Lee (2014).