2013 Vol. X No. XX, 000–000
22institutetext: Inter-University Centre for Astronomy and Astrophysics, Post Bag4, Ganeshkhind, Pune-411007, India; rmisra@iucaa.ernet.in
33institutetext: Department of Physics, Providence Women’s College, Malaparamba, Calicut-673009, India
44institutetext: Department of Physics, Sultan Qaboos University, Muscat, Oman
Long term optical variability of bright X-ray point sources in elliptical galaxies
Abstract
We present long term optical variability studies of bright X-ray sources in four nearby elliptical galaxies with Chandra Advanced CCD Imaging Spectrometer array (ACIS-S) and Hubble Space Telescope (HST) Advanced Camera for Surveys observations. Out of the 46 bright (X-ray counts ) sources that are in the common field of view of the Chandra and HST observations, 34 of them have potential optical counterparts, while the rest of them are optically dark. After taking into account of systematic errors, estimated using the field optical sources as reference, we find that four of the X-ray sources (three in NGC1399 and one in NGC1427) have variable optical counterparts at a high significance level. The X-ray luminosities of these source are and are also variable on similar time-scales. The optical variability implies that the optical emission is associated with the X-ray source itself rather than being the integrated light from a host globular cluster. For one source the change in optical magnitude is , which is one of the highest reported for this class of X-ray sources and this suggests that the optical variability is induced by the X-ray activity. However, the optically variable sources in NGC1399 have been reported to have blue colours (). All four sources have been detected in the infra-red (IR) by Spitzer as point sources, and their ratio of to flux are indicating that their IR spectra are like those of Active Galactic Nuclei (AGN). While spectroscopic confirmation is required, it is likely that all four sources are background AGNs. We find none of the X-ray sources having optical/IR colours different from AGNs, to be optically variable.
keywords:
(Galaxy:) globular clusters: general, galaxies:photometry, X-rays:galaxies1 Introduction
The unprecedented angular resolution of Chandra satellite has enabled the study of X-ray point sources in nearby galaxies. Most of these point sources are expected to be X-ray binaries like the ones found in the Milky Way. An important result of the Chandra observations was the confirmation of Ultra-luminous X-ray sources (ULXs), discovered with Einstein observatory in the 1980s (Fabbiano 1989). These are off-nuclear X-ray point sources with X-ray luminosities in the range . The observed luminosities of ULXs exceed the Eddington limit for a black hole, which has led to a sustained debate on the nature of these sources. Since ULXs are off-nuclear sources, their masses must be from dynamical friction arguments (Kaaret et al. 2001). Thus, ULXs may represent a class of Intermediate Mass Black holes (IMBHs) whose mass range () is between that of stellar mass black holes and super massive ones (Makishima et al. 2000). Further the nature of the sources in nearby galaxies, which are less luminous than ULX, is also not clear and it is difficult to ascertain whether they harbour neutron stars or black holes.
The primary reason for these uncertainties is that unlike Galactic X-ray binaries, it is difficult to identify the companion star in the optical and obtain the binary parameters. For most X-ray sources in nearby galaxies, the associated optical emission is due to the integrated light from a host globular cluster (Kim et al. 2006, 2009; Ptak et al. 2006; Goad et al. 2002) and it is usually not possible to resolve and identify the companion star. However, these studies provide important information regarding the environment of the X-ray sources. For example, ULXs in early type galaxies are associated with red globular clusters (Ptak et al. 2006; Angelini et al. 2001). Even the non-detection of optical emission allows one to impose strong upper limit on the black hole mass for these accreting systems based on some standard assumptions (Jithesh et al. 2011). However, a more direct inference on the nature of the system requires identification and spectral measurement of the associated optical emission. An important aspect of identifying the correct optical counterpart in a crowded field is to check for optical variability. If the optical emission is variable, it is most probably directly associated with the X-ray source and not the integrated light of stars in a globular cluster. Indeed, for low mass X-ray binaries in the Galaxy, the optical emission is variable and is for some cases correlated with the X-ray emission (e.g.4U 1636-536: Shih et al. 2011) while for others it is not (e.g. GX 9+9: Kong et al. 2006). The optical variability may be due to the orbital motion of the donor star or reprocessing of the variable X-ray emission or X-ray heating of the companion. However, typically the optical counterpart of X-ray binaries in nearby galaxies will not be resolved, especially if the source is in a globular cluster. Hence it is not expected that optical variability will be seen for them.
Nevertheless, variability of optical counterparts have been measured for the bright X-ray sources in nearby galaxies. For example, the optical counterpart of NGC1313 X-2 has been identified as a O7 star at solar metallicity, The optical counterpart exhibits variability at 0.2 mag on short time scales (Liu et al. 2007; Grisé et al. 2008) and the variability may be due to varying X-ray irradiation of the donor star and a stochastic varying contribution from the accretion disk. An independent study of the same source (Mucciarelli et al. 2007) revealed that the optical flux of the counterpart shows variation % and that it may be a main-sequence star of mass feeding to a black hole of mass . The optical counterpart of Holmberg IX X-1 exhibits photometric variability of in the HST/ACS V band images (Grisé et al. 2011) although it seems to have a constant magnitude within photometric errors ( and ) in SUBARU V band images. Tao et al. (2011) have reported the optical variability for three ULXs, M101 ULX-1, M81 ULX1 and NGC1313 X-2, at a magnitude difference of 0.2 or larger in the V band. Some of the X-ray sources in nearby galaxies could be background AGN and it is expected that their optical emission would be variable.
It is important to identify more X-ray sources that have optically variable counterparts, which then can be subjected to more detailed observational follow-ups such as spectral and/or simultaneous X-ray/optical observations. A systematic analysis of a number of galaxies to identify such sources will be crucial to understand the nature of these sources. Such an analysis would require multiple optical observations of a galaxy, a uniform scheme to identify optical counterparts of the X-ray sources and more importantly an estimate of the systematic uncertainties in order to avoid any spurious variability that may arise if only statistical errors are considered.
In this work, we consider elliptical galaxies which are Mpc away that have been observed by Chandra and have more than one HST observation in the same filter. We restrict our analysis to ellipticals since for them the continuum optical emission can be modelled and subtracted out to reveal optical point sources (Jithesh et al. 2011). Using the field optical sources we estimate the systematic errors in the optical flux measurements and hence can report true optical variability at a high confidence level. Our aim is to study the optical counterpart variability of bright X-ray sources (X-ray counts ) whose X-ray spectra can be modelled and hence a reliable estimate of its luminosity can be obtained.
In the next section, we describe the selection of the sample galaxies. §3 and §4 describe the X-ray analysis and the method to identify the optical counterparts and to compute the photometry with systematic errors. We discuss the results in §5.
2 Source Selection
The samples were selected based on three criteria. (1) The distance to the host galaxy is Mpc, (2) The galaxy has Chandra observation and (3) has more than one epoch HST observation in the same filter. Based on these criteria, we have selected five galaxies which are listed in Table 1. For three of the galaxies there are multiple Chandra observations which we use to study the long term X-ray variability. Using the longest exposure Chandra observations we identify X-ray sources which have counts , so that we can obtain reliable X-ray spectra for them. Of these, we selected those that fell within the field of view of both the HST observations. For NGC2768 the only source that fulfilled these criteria was the central AGN and hence we report no further analysis of the galaxy.
| Galaxy | Distance | Chandra | Chandra | HST | HST | HST | |||
|---|---|---|---|---|---|---|---|---|---|
| (Mpc) | ID | Observation Date | (ks) | ID | Filter | Observation Date | |||
| NGC1399 | 18 | ||||||||
| NGC4486 | 17 | ||||||||
| NGC4278 | 9 | ||||||||
| NGC1427 | 2 | ||||||||
| NGC2768 | 1 | ||||||||
0.92(1) Host galaxy name; (2) Distance to the host galaxy from NED; (3) Chandra observation ID; (4) Chandra Observation Date; (5) Exposure time in kilo seconds; (6) HST observation ID; (7) HST Filter; (8) Observation Date; (9) Number of common sources in the field of view of X-ray and optical images.
NGC1399 and NGC4486 are giant elliptical galaxies in the center of the Fornax and Virgo clusters respectively and are well-known for their populous globular cluster systems (Kim et al. 2006; Dirsch et al. 2003; Bassino et al. 2006; Angelini et al. 2001; Jordán et al. 2004; Irwin 2006; Sivakoff et al. 2007). The Chandra analysis (Angelini et al. 2001) of NGC1399 shows that a large fraction of X-ray emission is most likely from the low-mass X-ray binaries (LMXBs). The HST study of these Chandra identified X-ray sources shows that % (26 of 38 sources) of these sources are associated to Globular Clusters (GCs). The specific frequency of globular cluster in this galaxy is 2-3 times that of typical elliptical galaxies (Harris 1991). The optical counterparts of the ULXs (CXOJ033831.8-352604) show [OIII] and [NII] emission line in the optical spectrum (Irwin et al. 2010). Irwin et al. (2010) suggest that the lack of H and H emission line in the spectrum may be an indication of a disruption of a white dwarf star by an intermediate mass black hole (IMBH).
The analysis of Chandra deep observations of the nearby elliptical galaxy NGC4278, identified 236 X-ray point sources with luminosity ranging from to (Brassington et al. 2009). This galaxy has rich globular cluster systems and 39 of them are coincident with X-ray sources which lie within the ellipse of the galaxy. 10 of the GC-LMXB associated sources lie at the high X-ray luminosity end (). Also, % of the X-ray source population exhibit long term variability indicating that they are accreting compact objects. Fabbiano et al. (2010) analysed the spectra of the X-ray sources by fitting with either single thermal accretion disk or power law model and the best-fit parameters are similar to those of Galactic BH binaries. Seven luminous sources have luminosity exceeding the Eddington limit for accreting neutron stars. Four of these sources are associated with GCs and the other three do not have optical counterparts and are found in the stellar field of NGC4278.
NGC1427 is a low luminosity elliptical galaxy in Fornax cluster and its globular cluster association has been studied by Forte et al. (2001) and Kissler-Patig et al. (1997). The photometry studies reveal a bimodal cluster population in this galaxy and suggest that the formation mechanism of globular clusters in low luminosity galaxies shows similarities with giant galaxies. The Chandra ACIS Survey of X-ray point sources (Liu 2011) identified two ULXs in this galaxy with luminosity . Among them, one source is inside the region of the galaxy, and the other is outside the region.
3 X-ray Analysis
We start with analysing the Chandra observations listed in Table 1. These are observations with Advanced CCD Imaging Spectrometer array (ACIS-S) and the data reduction and analysis were done using ciao 4.2, and heasoft 6.9. Using the ciao source detection tool celldetect, the X-ray point sources were extracted from the level 2 event list with signal-to-noise ratio of 3. Some of the extracted sources are near the nucleus and in the excessive diffused emission regions and hence these sources were not included in the analysis. The extracted sources with net count were selected. The spectral analysis was done using xspec 12.6.0, and the data were fitted in the energy range of 0.3 - 8.0 keV.
All sources were fitted with two spectral models: an absorbed power law and an absorbed disk black body. Absorption was taken into account using the xspec model wabs. If the difference between the two models was larger than 2.7, we took the model with the smaller to be the representative one. If the difference was less than 2.7 (i.e. when both models equally well represent the data), we choose the representative model to be the one which gave a lower luminosity. The analysis has been done for both observations listed in Table 1, with the longer observation being called the first one and the shorter one the second. Table 2 lists the spectral parameters corresponding to the representative model. The spectra of two sources in NGC1399 are not well fitted with either model and a closer inspection revealed the presence of an additional mekal component which has been added.
To quantify the long term variability of the X-ray sources we consider sources that are in the field of view of both observations. We jointly fit the spectra using the same model parameters except that we introduce a constant factor which multiplies the later observation. In other words, we keep the absorption and the spectral parameters (i.e. either the temperature or the power-law index) same for both data sets, but allow for variation in the relative normalization. If the constant is unity, then the source has not varied. We consider a source to be X-ray variable only if the constant is inconsistent with unity at 2-sigma level i.e. . The results of the joint fitting are shown in Table 3. As expected, several of the X-ray sources clearly exhibit long term variability.
| Galaxy | RA (J2000) | Dec (J2000) | log() | Model | log() | Model | ||||||
|---|---|---|---|---|---|---|---|---|---|---|---|---|
| NGC1399 | 3h38m32.58s | -35\dg27′5.40 | P | P | ||||||||
| NGC1399 | 3h38m31.79s | -35\dg26′4.23 | D | D | ||||||||
| NGC1399 | 3h38m36.82s | -35\dg27′46.98 | P | P | ||||||||
| NGC1399 | 3h38m33.09s | -35\dg27′31.53 | D | P | ||||||||
| NGC1399 | 3h38m25.95s | -35\dg27′42.19 | D | D | ||||||||
| NGC1399 | 3h38m32.76s | -35\dg26′58.73 | D | P | ||||||||
| NGC1399 | 3h38m32.34s | -35\dg27′2.11 | D | D | ||||||||
| NGC1399 | 3h38m31.86s | -35\dg26′49.26 | D | P | ||||||||
| #NGC1399 | 3h38m25.66s | -35\dg27′41.50 | D | |||||||||
| #NGC1399 | 3h38m27.80s | -35\dg25′26.65 | D | |||||||||
| NGC1399 | 3h38m26.50s | -35\dg27′32.29 | D | |||||||||
| NGC1399 | 3h38m33.82s | -35\dg25′56.95 | D | |||||||||
| NGC1399 | 3h38m33.80s | -35\dg26′58.30 | D | |||||||||
| NGC1399 | 3h38m32.35s | -35\dg27′10.63 | D | |||||||||
| NGC1399 | 3h38m25.32s | -35\dg27′53.49 | D | |||||||||
| NGC1399 | 3h38m27.19s | -35\dg26′1.53 | P | |||||||||
| ‡NGC1399 | 3h38m27.63s | -35\dg26′48.54 | P | D | ||||||||
| ‡NGC1399 | 3h38m38.76s | -35\dg25′54.86 | D | P | ||||||||
| NGC4486 | 12h30m47.15s | 12\dg24′15.91 | D | P | ||||||||
| NGC4486 | 12h30m53.24s | 12\dg23′56.69 | D | D | ||||||||
| NGC4486 | 12h30m50.12s | 12\dg23′1.07 | D | D | ||||||||
| NGC4486 | 12h30m46.19s | 12\dg23′28.63 | D | D | ||||||||
| NGC4486 | 12h30m44.67s | 12\dg22′1.06 | P | D | ||||||||
| NGC4486 | 12h30m50.80s | 12\dg25′2.00 | D | D | ||||||||
| NGC4486 | 12h30m44.26s | 12\dg22′9.37 | D | D | ||||||||
| #NGC4486 | 12h30m44.71s | 12\dg24′34.61 | P | |||||||||
| #NGC4486 | 12h30m46.32s | 12\dg23′23.19 | D | |||||||||
| #NGC4486 | 12h30m47.32s | 12\dg23′8.82 | D | |||||||||
| #NGC4486 | 12h30m50.08s | 12\dg22′51.21 | D | |||||||||
| #NGC4486 | 12h30m52.79s | 12\dg23′36.85 | P | |||||||||
| #NGC4486 | 12h30m43.49s | 12\dg23′46.80 | D | |||||||||
| #NGC4486 | 12h30m46.52s | 12\dg24′50.15 | D | |||||||||
| #NGC4486 | 12h30m44.91s | 12\dg24′4.50 | D | |||||||||
| #NGC4486 | 12h30m50.82s | 12\dg24′11.80 | D | |||||||||
| #NGC4486 | 12h30m49.13s | 12\dg21′59.40 | P | |||||||||
| NGC4278 | 12h20m7.75s | 29\dg17′20.39 | D | D | ||||||||
| NGC4278 | 12h20m3.43s | 29\dg16′39.35 | D | D | ||||||||
| NGC4278 | 12h20m4.22s | 29\dg16′51.24 | D | D | ||||||||
| NGC4278 | 12h20m5.23s | 29\dg16′39.82 | D | D | ||||||||
| NGC4278 | 12h20m4.33s | 29\dg17′35.86 | D | D | ||||||||
| NGC4278 | 12h20m6.03s | 29\dg16′48.25 | P | D | ||||||||
| NGC4278 | 12h20m5.48s | 29\dg16′40.68 | D | D | ||||||||
| NGC4278 | 12h20m6.79s | 29\dg16′56.01 | P | D | ||||||||
| #NGC4278 | 12h20m5.95s | 29\dg17′8.79 | P | |||||||||
| NGC1427 | 3h42m18.71s | -35\dg22′40.02 | D | |||||||||
| NGC1427 | 3h42m18.47s | -35\dg23′38.19 | D |
1.20# denotes the sources are present only in first observation. * denotes the sources are present only in second observation. ‡denotes an additional mekal model added to get better fit for these sources. Host Galaxy Name; Right Ascension; Declination; , equivalent hydrogen column density in for the first observation; , photon power law index or inner disk temperature in keV in the first observation; , Unabsorbed X-ray luminosity in in the energy range, 0.3-8.0 keV for the first observation; , statistics and degree of freedom in the first observation; Best-fit Model (P-Power law, D-Disk black body) in the first observation; , equivalent hydrogen column density in for the second observation; , photon power law index or inner disk temperature in keV in the second observation; , Unabsorbed X-ray luminosity in in the energy range, 0.3-8.0 keV for the second observation; , statistics and degree of freedom in the second observation; Best-fit Model (P-Power law, D-Disk black body) in the second observation; Galactic absorption column density for NGC1399, = ; Galactic absorption column density for NGC4486, = ; Galactic absorption column density for NGC4278, = ; Galactic absorption column density for NGC1427, = .
| Galaxy | RA (J2000) | Dec (J2000) | Norm | kTin | Norm | Var(Sig) | ||||
|---|---|---|---|---|---|---|---|---|---|---|
| NGC1399 | 3h38m32.58s | -35\dg27′5.40 | Y(2.60) | |||||||
| NGC1399 | 3h38m31.79s | -35\dg26′4.23 | N(1.27) | |||||||
| NGC1399 | 3h38m36.82s | -35\dg27′46.98 | N(1.35) | |||||||
| NGC1399 | 3h38m33.09s | -35\dg27′31.53 | N(1.37) | |||||||
| NGC1399 | 3h38m25.95s | -35\dg27′42.19 | N(0.45) | |||||||
| NGC1399 | 3h38m32.76s | -35\dg26′58.73 | N(0.26) | |||||||
| NGC1399 | 3h38m32.34s | -35\dg27′2.11 | Y(2.10) | |||||||
| NGC1399 | 3h38m31.86s | -35\dg26′49.26 | N(1.76) | |||||||
| NGC4486 | 12h30m47.15s | 12\dg24′15.91 | N(1.80) | |||||||
| NGC4486 | 12h30m53.24s | 12\dg23′56.69 | N(0.23) | |||||||
| NGC4486 | 12h30m50.12s | 12\dg23′1.07 | N(0.88) | |||||||
| NGC4486 | 12h30m46.19s | 12\dg23′28.63 | N(0.35) | |||||||
| NGC4486 | 12h30m44.67s | 12\dg22′1.06 | N(0.47) | |||||||
| NGC4486 | 12h30m50.80s | 12\dg25′2.00 | N(1.03) | |||||||
| NGC4486 | 12h30m44.26s | 12\dg22′9.37 | N(0.25) | |||||||
| NGC4278 | 12h20m7.75s | 29\dg17′20.39 | N(0.06) | |||||||
| NGC4278 | 12h20m3.43s | 29\dg16′39.35 | N(1.41) | |||||||
| NGC4278 | 12h20m4.22s | 29\dg16′51.24 | N(0.04) | |||||||
| NGC4278 | 12h20m5.23s | 29\dg16′39.82 | N(0.17) | |||||||
| NGC4278 | 12h20m4.33s | 29\dg17′35.86 | Y(2.38) | |||||||
| NGC4278 | 12h20m6.03s | 29\dg16′48.25 | Y(3.27) | |||||||
| NGC4278 | 12h20m5.48s | 29\dg16′40.68 | N(1.40) | |||||||
| NGC4278 | 12h20m6.79s | 29\dg16′56.01 | N(0.63) |
1.17Host Galaxy Name; Right Ascension; Declination; , equivalent hydrogen column density in ; , photon power law index; Power law Normalization in ; , inner disk temperature in keV; Disk black body Normalization in ; , Constant2; statistics and degree of freedom; X-ray variable (Y-Yes, N-No) and its significance; Galactic absorption column density for NGC1399, = ; Galactic absorption column density for NGC4486, = ; Galactic absorption column density for NGC4278, = ; Constant1, = 1.00.
4 Optical counterparts and photometry
We search for the optical counterparts for these X-ray sources by using the archival HST ACS images listed in Table 1. Typically, the optical sources in the HST images are too faint against the dominant galaxy light and hence to detect them, the galaxy light was modelled by isophotes of ellipses using the ellipse task in iraf/stsdas software. The modelled image was then subtracted from the observed galaxy image to obtain a residual image. The optical point sources were then extracted from the residual image by using sextractor with a threshold level of .
By visual inspection, we could see that for many of the Chandra X-ray sources within an error circle of one arcsecond there is an obvious optical source. However, there was a systematic positional offset of one arcsecond between the Chandra and HST source positions. This constant positional offset was applied to the X-ray sources and then the shifted X-ray positions were compared with the optical source positions in the sextractor catalogue. A more detailed explanation with clarifying images is presented in Jithesh et al. (2011). This constant offset is less than the offset of 2.3 arcsec applied for the source SN 1993J in the study of a ULX in M81 (Liu et al. 2002). We analysed a total of 46 bright X-ray sources, which are in the field of view of HST images and identified the optical counterpart for 34 sources. The optical counterparts identified are unique and for most of the counterparts there is no other optical source even within the 3 arcsec from the optical position. The remaining 12 sources didn’t have an optical counterpart at their respective positions.
Photometry of the optical counterparts as well as all the sources detected by sextractor was computed on the drizzled images with iraf/apphot package. The drizzled images were converted from to per pixel by multiplying the total exposure time. An aperture radius of 0.5 arcsec was used to extract the flux by the task apphot and the magnitudes in the AB magnitude system were calculated using the zero points taken from HST ACS data handbook. The aperture correction were computed from a list of apphot photometry files using the daogrow algorithm (Stetson 1990) and the correction is applied to the magnitudes. For those X-ray sources that didn’t have an optical counterpart (i.e. optically dark X-ray sources) we obtained the upper limit of the optical flux at the X-ray positions.
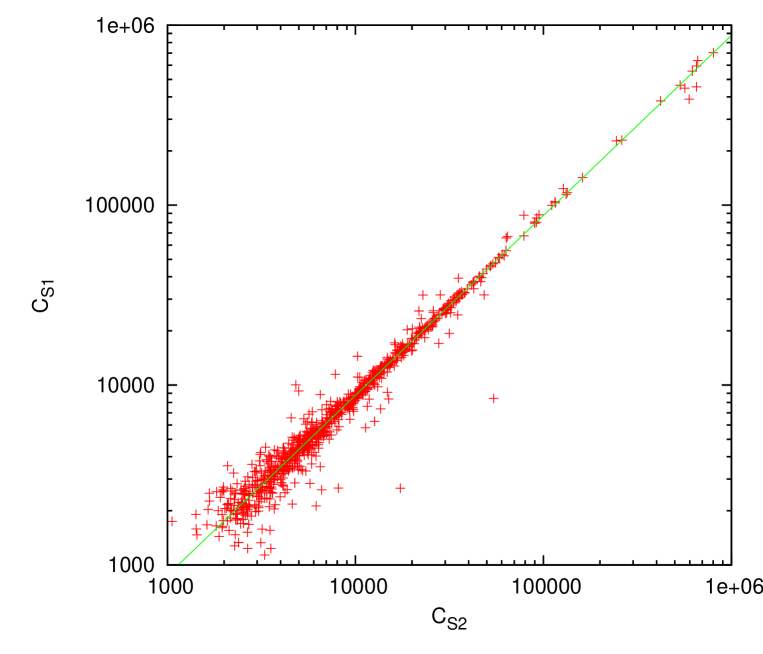
Our aim is to estimate the optical variability of point sources from two observations of a galaxy. This requires a reliable estimate of the statistical and systematic errors, if any, in the optical flux. From the photometry, we get the total counts, ( from photometry in ADU) and the background subtracted counts, ( from photometry in ADU) of each source. The statistical error on can be taken to be where is the gain parameter in electron per ADU. For the two observations of NGC1399, we plot in Figure 1 the background subtracted counts and against each other for 848 sources that are in the common field of view. There is the obvious correlation with a large scatter and several outliers. Since there are outliers which may affect any least square fitting technique, we use the robust method (Press et al. 1992) to fit a straight line and obtained a slope and a negligible offset of . The two observations have different zero point magnitude ()and exposure time (), which gives this scaling factor (b). For the case of NGC 1399, and , and for the two observations. The apparent magnitude, , where . Thus and . If the apparent magnitudes in the two observations are same, then we can write, = . Hence . The factor which is as expected identical to the slope obtained by fitting.
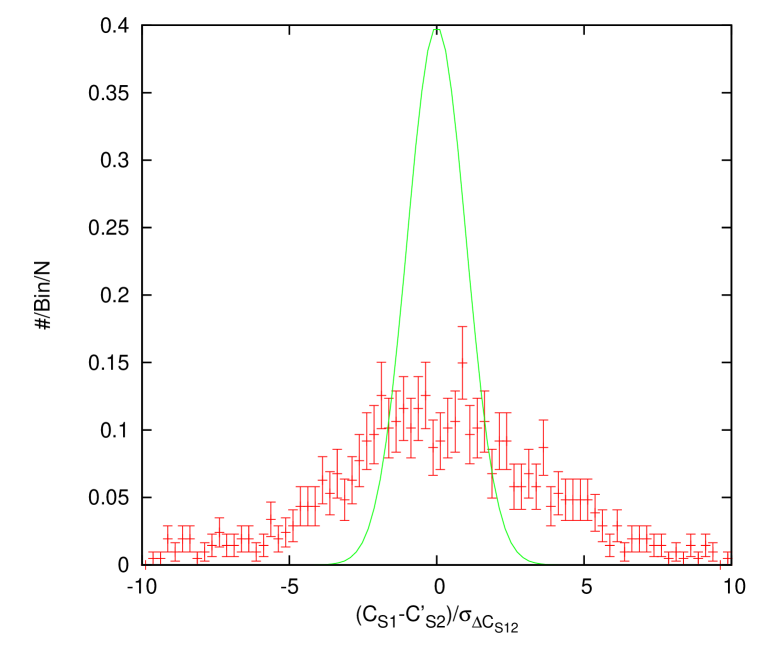
Then we scaled up the flux of the sources in the second observation i. e., and their uncertainties . Now if there were no systematic errors then we could compare and with their corresponding statistical errors to determine if a source is variable. However, the statistical errors are small and as evident in Figure 1, this would imply that a large number of the field sources are variable. Since, we know that this is not the case and indeed most of the field sources are expected not to vary there is systematic error involved. A better way to illustrate this is to plot the histogram of where . If most of the sources are non-variable and there was no systematic error, then the distribution should be a zero centred Gaussian with width . However, Figure 2 shows that as the distribution is significantly broader.
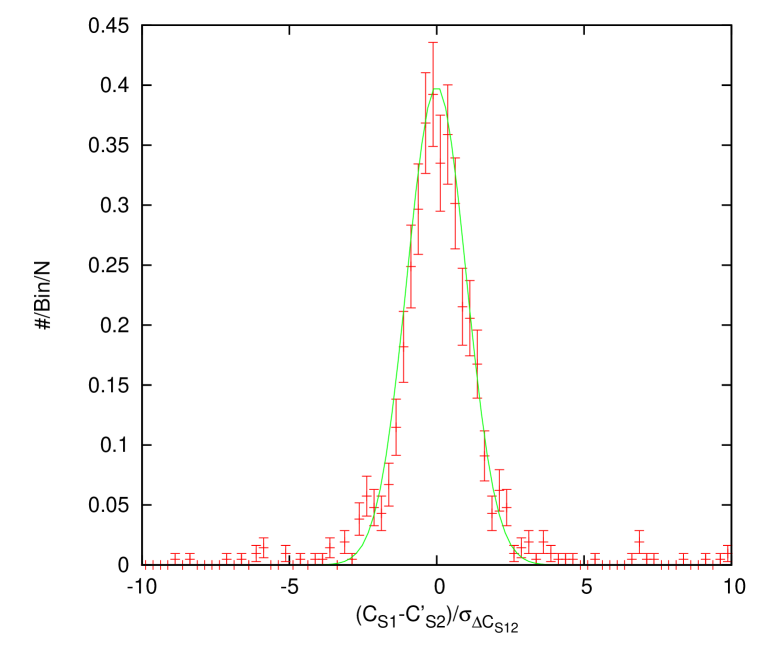
We find that if we add a systematic of to the uncertainties of the flux in quadrature to both observations, then the distribution is consistent with being a Gaussian with as shown in Figure 3. To corroborate that this indeed is the correct level of systematic error, we do the following exercise. For each pair of optical fluxes, we compare with a constant and obtain the chi-square,
| (1) |
where is the model constant flux whose value is obtained by minimizing (i.e. ) to be
| (2) |
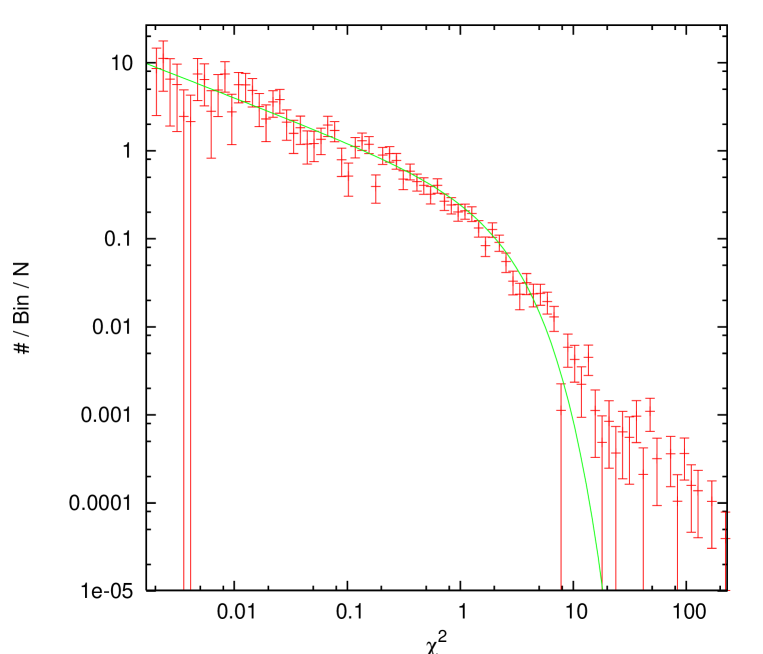
Since the number of data points is two and the number of parameters (i.e. ) is one, the degree of freedom here is one. Hence, if the model for a majority of the sources (i.e. the sources are not variable) and the error estimates are correct then the distribution of should be a chi-square distribution of order one i.e.
| (3) |
Figure 4 shows the distribution of for all the 848 sources in NGC1399. The solid line is the expected distribution . For a majority of the sources which are expected not to be variable as expected. More importantly the distribution matches well with the majority including the low values of . This strongly implies that the systematic error used is reliable. We could not identify the cause for the systematic errors despite our best efforts. However, we note that such deviations have been reported in similar works. For example, for NGC 1313, Liu et al. (2007) reported that out of 399 optical sources they examined, more than 81 (i.e. 20%) had variability above 2 sigma, while the expected number was more like 10%. The measured distribution deviates from the expected one for and these are the few truly variable sources in the sample. Thus we can state confidently and conservatively that sources with are indeed variable and we use this criterion for this work. About 93% (792) cross identified sources are not variable between the two observations and 56 sources are optically variable i.e . While the results presented above are for NGC1399, we use the same technique to establish the systematic error for the other three galaxies and for each of them we find that to be a good conservative criterion for optical variability. The photometric optical magnitudes of the X-ray sources of the sample have been provided in Table 4.
Table 5 provides the properties of the four X-ray sources which are optically variable. We have also estimated the difference in the magnitude of these sources by comparing the F814W and F850LP data. Even though they are different bands, three sources (source 2 and source 3 in NGC1399, one source in NGC1427) show a magnitude difference of 0.1 - 0.4. But the Source 1 in NGC1399 has a magnitude difference of 0.02 only in these filters.
| Galaxy | RA (J2000) | Dec (J2000) | log() | Model | Var(Sig) | |||||
|---|---|---|---|---|---|---|---|---|---|---|
| NGC1399 | 3h38m32.58s | -35\dg27′5.40 | P | Y(2.60) | 0.259 | |||||
| NGC1399 | 3h38m31.79s | -35\dg26′4.23 | D | N(1.27) | 0.031 | |||||
| NGC1399 | 3h38m36.82s | -35\dg27′46.98 | P | N(1.35) | 51.437 | |||||
| NGC1399 | 3h38m33.09s | -35\dg27′31.53 | D | N(1.37) | 26.493 | |||||
| NGC1399 | 3h38m33.09s | -35\dg27′31.53 | D | N(1.37) | 1.575 | |||||
| NGC1399 | 3h38m25.95s | -35\dg27′42.19 | D | N(0.45) | ||||||
| NGC1399 | 3h38m32.76s | -35\dg26′58.73 | D | N(0.26) | 0.260 | |||||
| NGC1399 | 3h38m32.34s | -35\dg27′2.11 | D | Y(2.10) | 0.140 | |||||
| NGC1399 | 3h38m31.86s | -35\dg26′49.26 | D | N(1.76) | 133.152 | |||||
| NGC1399 | 3h38m25.66s | -35\dg27′41.50 | D | 1.197 | ||||||
| NGC1399 | 3h38m27.80s | -35\dg25′26.65 | D | 0.019 | ||||||
| NGC1399 | 3h38m26.50s | -35\dg27′32.29 | ||||||||
| NGC1399 | 3h38m33.82s | -35\dg25′56.95 | 0.062 | |||||||
| NGC1399 | 3h38m33.80s | -35\dg26′58.30 | 0.159 | |||||||
| NGC1399 | 3h38m32.35s | -35\dg27′10.63 | 0.444 | |||||||
| NGC1399 | 3h38m25.32s | -35\dg27′53.49 | 0.003 | |||||||
| NGC1399 | 3h38m27.19s | -35\dg26′1.53 | 0.080 | |||||||
| NGC1399 | 3h38m27.63s | -35\dg26′48.54 | P | N(0.87) | ||||||
| NGC1399 | 3h38m38.76s | -35\dg25′54.86 | D | Y(6.50) | 0.165 | |||||
| NGC4486 | 12h30m47.15s | 12\dg24′15.91 | D | N(1.80) | 2.409 | |||||
| NGC4486 | 12h30m47.15s | 12\dg24′15.91 | D | N(1.80) | 0.161 | |||||
| NGC4486 | 12h30m53.24s | 12\dg23′56.69 | D | N(0.23) | 0.520 | |||||
| NGC4486 | 12h30m50.12s | 12\dg23′1.07 | D | N(0.88) | 1.354 | |||||
| NGC4486 | 12h30m46.19s | 12\dg23′28.63 | D | N(0.35) | 1.261 | |||||
| NGC4486 | 12h30m44.67s | 12\dg22′1.06 | P | N(0.47) | 0.008 | |||||
| NGC4486 | 12h30m50.80s | 12\dg25′2.00 | D | N(1.03) | ||||||
| NGC4486 | 12h30m44.26s | 12\dg22′9.37 | D | N(0.25) | ||||||
| NGC4486 | 12h30m44.71s | 12\dg24′34.61 | P | 0.887 | ||||||
| NGC4486 | 12h30m46.32s | 12\dg23′23.19 | D | 1.278 | ||||||
| NGC4486 | 12h30m47.32s | 12\dg23′8.82 | D | 2.599 | ||||||
| NGC4486 | 12h30m50.08s | 12\dg22′51.21 | D | 0.094 | ||||||
| NGC4486 | 12h30m52.79s | 12\dg23′36.85 | P | 1.617 | ||||||
| NGC4486 | 12h30m43.49s | 12\dg23′46.80 | D | 2.220 | ||||||
| NGC4486 | 12h30m46.52s | 12\dg24′50.15 | D | 0.111 | ||||||
| NGC4486 | 12h30m44.91s | 12\dg24′4.50 | D | |||||||
| NGC4486 | 12h30m50.82s | 12\dg24′11.80 | D | |||||||
| NGC4486 | 12h30m49.13s | 12\dg21′59.40 | P | |||||||
| NGC4278 | 12h20m7.75s | 29\dg17′20.39 | D | N(0.06) | 0.001 | |||||
| NGC4278 | 12h20m3.43s | 29\dg16′39.35 | D | N(1.41) | 0.823 | |||||
| NGC4278 | 12h20m4.22s | 29\dg16′51.24 | D | N(0.04) | 0.864 | |||||
| NGC4278 | 12h20m5.23s | 29\dg16′39.82 | D | N(0.17) | 0.111 | |||||
| NGC4278 | 12h20m4.33s | 29\dg17′35.86 | D | Y(2.38) | ||||||
| NGC4278 | 12h20m6.03s | 29\dg16′48.25 | P | Y(3.27) | ||||||
| NGC4278 | 12h20m5.48s | 29\dg16′40.68 | D | N(1.40) | ||||||
| NGC4278 | 12h20m6.79s | 29\dg16′56.01 | P | N(0.63) | ||||||
| NGC4278 | 12h20m5.95s | 29\dg17′8.79 | P | 1.388 | ||||||
| NGC1427 | 3h42m18.71s | -35\dg22′40.02 | D | 0.163 | ||||||
| NGC1427 | 3h42m18.47s | -35\dg23′38.19 | D | 19.488 |
1.15(1) Host Galaxy Name; (2) Right Ascension; (3) Declination; (4) Log of unabsorbed X-ray luminosity in for first observation; (5) Best-fit Model; (6) Constant2; (7) X-ray variable (Y-Yes, N-No) and its significance; (8) Aperture corrected magnitude in the first observation; (9) Aperture corrected magnitude in the second observation; (10) The difference in magnitude; (11) Significance of the Optical variability. In the sample, two sources (3h38m33.09s, -35\dg27′31.53 in NGC1399 and 12h30m47.15s, 12\dg24′15.91 in NGC4486) have two possible optical counterparts. Hence we report the magnitude of each counterpart.
| Galaxy | RA (J2000) | Dec (J2000) | log() | ||||||
|---|---|---|---|---|---|---|---|---|---|
| NGC1399 | 3h38m31.86s | -35\dg26′49.26 | |||||||
| NGC1399 | 3h38m33.09s | -35\dg27′31.53 | |||||||
| NGC1399 | 3h38m36.82s | -35\dg27′46.98 | |||||||
| NGC1427 | 3h42m18.47s | -35\dg23′38.19 |
1.12(1) Host Galaxy Name; (2) Right Ascension; (3) Declination; (4) log of unabsorbed X-ray luminosity in for first observation; (5) The difference in magnitude; (6) Significance of the Optical variability; (7) Optical colour (g-z) derived from Vega magnitude; (8),(9) IR flux in mJy for the 3.6m and 5.8m bands; (10) Mid-IR flux ratio.
5 Discussion
In this work we have studied the long term X-ray and optical variability of X-ray sources in four nearby elliptical galaxies. For the 46 sources in the sample, we have fitted their X-ray spectra using an absorbed power-law or black body model for two Chandra observations and found that 24 of them show long term X-ray variability. For 34 sources, we have identified optical counterparts. After estimating the systematic error on the photometric magnitude, we find that four of the sources clearly exhibit long term optical variation. Since the optical counterpart is varying it cannot be the integrated light of stars in a globular cluster. Thus, one may expect that the optical variability is induced by the X-ray source. If that is so, these sources are important candidates for further study.
The optically variable X-ray sources could be background Active Galactic Nuclei (AGN). The reported optical colours (g - z) for the sources in NGC1399 (Shalima et al. 2013) are tabulated in Table 5 and they reveal that the objects are blue and one of them is bluer than blue globular clusters, (Paolillo et al. 2011). Indeed, the optically variable sources (Source 1 and 2 in NGC1399) were identified as possible contaminants in an earlier analysis (Kundu et al. 2007). The analysis of HST/WFPC data reveals that these sources are bluer than and hence are not globular clusters. Blakeslee et al. (2012) studied the globular cluster systems in NGC1399 using the HST/ACS g, V, I, z and H bands. In their study, the sources with and are classified as the globular clusters. and the optically variable sources in NGC1399 (source 1 and 2) again do not satisfy their criteria. This may indicate that they may be background AGN and indeed their IR colours also support this interpretation. Studies have shown that AGN have flux ratios in the and bands i.e. (Polletta et al. 2006; Lacy et al. 2004). Shalima et al. (2013) have looked for IR counterparts of X-ray sources in NGC1399 using Spitzer data. Their quoted IR flux and ratios are tabulated in Table 5. All four sources have IR flux ratios , indicating that they maybe background AGN. Unfortunately these sources are not in the field of view of the Spitzer and images, which would have provided more information on the nature of these sources.
We do not find evidence for any optical counterpart to disappear or flux changes by order of magnitude. Such variations would be expected if the X-ray emission is due to a violent transient event like a very bright nova explosion or a tidal disruption of a white dwarf by a black hole. Such transient events are expected to show dramatic variation in both X-ray and optical flux. While there are several X-ray sources which are not detected in the other Chandra observation, none of them exhibit dramatic variability in the optical. For example, as mentioned earlier, Irwin et al. (2010) have argued that the lack of H and H in the spectrum of a ULXs in NGC1399 (CXOJ033831.8-352604) may indicate the tidal disruption of a white dwarf by a black hole. However, here we find that neither the X-ray nor the optical flux show any long term variation.
Clearly, conclusive evidence on the nature of these sources can be obtained only by studying their optical spectra and confirming by emission line studies whether a source is a background AGN or not. Such studies will also provide clear information about the origin of the optical source. Since this would require large telescopes in excellent seeing conditions, it is important to choose good potential candidates such as the optically variable sources identified here. A positive identification of a optically variable source as not being a background AGN, would be the crucial step towards understanding these enigmatic sources.
Acknowledgements.
VJ, KJ, CDR, and BRSB thank the IUCAA visitors program and UGC Special assistance program. VJ acknowledges financial support from the Council of Scientific and Industrial Research (CSIR) through SRF scheme. This work has been partially funded from the ISRO-RESPOND program. PS would like to thank the DST - FAST Track Scheme for research funding. The authors thank Phil Charles for useful discussions.References
- Angelini et al. (2001) Angelini, L., Loewenstein, M., & Mushotzky, R. F. 2001, ApJ, 557, L35
- Bassino et al. (2006) Bassino, L. P., Faifer, F. R., Forte, J. C., et al. 2006, A&A, 451, 789
- Blakeslee et al. (2012) Blakeslee, J. P., Cho, H., Peng, E. W., et al. 2012, ApJ, 746, 88
- Brassington et al. (2009) Brassington, N. J., Fabbiano, G., Kim, D.-W., et al. 2009, ApJS, 181, 605
- Dirsch et al. (2003) Dirsch, B., Richtler, T., Geisler, D., et al. 2003, AJ, 125, 1908
- Fabbiano (1989) Fabbiano, G. 1989, ARA&A, 27, 87
- Fabbiano et al. (2010) Fabbiano, G., Brassington, N. J., Lentati, L., et al. 2010, ApJ, 725, 1824
- Forte et al. (2001) Forte, J. C., Geisler, D., Ostrov, P. G., Piatti, A. E., & Gieren, W. 2001, AJ, 121, 1992
- Goad et al. (2002) Goad, M. R., Roberts, T. P., Knigge, C., & Lira, P. 2002, MNRAS, 335, L67
- Grisé et al. (2011) Grisé, F., Kaaret, P., Pakull, M. W., & Motch, C. 2011, ApJ, 734, 23
- Grisé et al. (2008) Grisé, F., Pakull, M. W., Soria, R., et al. 2008, A&A, 486, 151
- Harris (1991) Harris, W. E. 1991, ARA&A, 29, 543
- Irwin (2006) Irwin, J. A. 2006, MNRAS, 371, 1903
- Irwin et al. (2010) Irwin, J. A., Brink, T. G., Bregman, J. N., & Roberts, T. P. 2010, ApJ, 712, L1
- Jithesh et al. (2011) Jithesh, V., Jeena, K., Misra, R., et al. 2011, ApJ, 729, 67
- Jordán et al. (2004) Jordán, A., Côté, P., Ferrarese, L., et al. 2004, ApJ, 613, 279
- Kaaret et al. (2001) Kaaret, P., Prestwich, A. H., Zezas, A., et al. 2001, MNRAS, 321, L29
- Kim et al. (2009) Kim, D., Fabbiano, G., Brassington, N. J., et al. 2009, ApJ, 703, 829
- Kim et al. (2006) Kim, E., Kim, D., Fabbiano, G., et al. 2006, ApJ, 647, 276
- Kissler-Patig et al. (1997) Kissler-Patig, M., Kohle, S., Hilker, M., et al. 1997, A&A, 319, 470
- Kong et al. (2006) Kong, A. K. H., Charles, P. A., Homer, L., Kuulkers, E., & O’Donoghue, D. 2006, MNRAS, 368, 781
- Kundu et al. (2007) Kundu, A., Maccarone, T. J., & Zepf, S. E. 2007, ApJ, 662, 525
- Lacy et al. (2004) Lacy, M., Storrie-Lombardi, L. J., Sajina, A., et al. 2004, ApJS, 154, 166
- Liu (2011) Liu, J. 2011, ApJS, 192, 10
- Liu et al. (2007) Liu, J., Bregman, J., Miller, J., & Kaaret, P. 2007, ApJ, 661, 165
- Liu et al. (2002) Liu, J., Bregman, J. N., & Seitzer, P. 2002, ApJ, 580, L31
- Makishima et al. (2000) Makishima, K., Kubota, A., Mizuno, T., et al. 2000, ApJ, 535, 632
- Mucciarelli et al. (2007) Mucciarelli, P., Zampieri, L., Treves, A., Turolla, R., & Falomo, R. 2007, ApJ, 658, 999
- Paolillo et al. (2011) Paolillo, M., Puzia, T. H., Goudfrooij, P., et al. 2011, ApJ, 736, 90
- Polletta et al. (2006) Polletta, M. d. C., Wilkes, B. J., Siana, B., et al. 2006, ApJ, 642, 673
- Press et al. (1992) Press, W. H., Teukolsky, S. A., Vetterling, W. T., & Flannery, B. P. 1992, Numerical recipes in FORTRAN. The art of scientific computing
- Ptak et al. (2006) Ptak, A., Colbert, E., van der Marel, R. P., et al. 2006, ApJS, 166, 154
- Shalima et al. (2013) Shalima, P., Jithesh, V., Jeena, K., et al. 2013, MNRAS, 434, 639
- Shih et al. (2011) Shih, I. C., Charles, P. A., & Cornelisse, R. 2011, MNRAS, 412, 120
- Sivakoff et al. (2007) Sivakoff, G. R., Jordán, A., Sarazin, C. L., et al. 2007, ApJ, 660, 1246
- Stetson (1990) Stetson, P. B. 1990, PASP, 102, 932
- Tao et al. (2011) Tao, L., Feng, H., Grisé, F., & Kaaret, P. 2011, ApJ, 737, 81