Intense bipolar structures from stratified helical dynamos
Abstract
We perform direct numerical simulations of the equations of magnetohydrodynamics with external random forcing and in the presence of gravity. The domain is divided into two parts: a lower layer where the forcing is helical and an upper layer where the helicity of the forcing is zero with a smooth transition in between. At early times, a large-scale helical dynamo develops in the bottom layer. At later times the dynamo saturates, but the vertical magnetic field continues to develop and rises to form dynamic bipolar structures at the top, which later disappear and reappear. Some of the structures look similar to spots observed in the Sun. This is the first example of magnetic flux concentrations, owing to strong density stratification, from self-consistent dynamo simulations that generate bipolar, super-equipartition strength, magnetic structures whose energy density can exceeds the turbulent kinetic energy by even a factor of ten.
keywords:
MHD - Sun: sunspots - dynamo1 Introduction
The most striking and also the most observed magnetic features of the Sun are the sunspots and active regions. The number of sunspots, the strength of the magnetic field in sunspots, and the magnetic field calculated at the surface of the Sun are often taken as proxies of the solar magnetic field deep inside. There is general agreement that the evolution of the solar magnetic field is governed by the solar dynamo which operates in the convection zone of the Sun. This brings us to the question, how is the magnetic field generated by the solar dynamo related to the magnetic field observed at the surface of the Sun? At present, this question does not have a clear answer.
The conventional picture (see, e.g., Choudhuri, 2008, for a review) is that the solar dynamo generates a strong toroidal magnetic field in the form of flux tubes at the bottom of the convection zone, also called the tachocline. This strong magnetic field is buoyant and hence rises up to eventually penetrate through the surface layers of the Sun to create bipolar regions at the surface. During its rise through the convection zone, the magnetic flux tube is twisted by the Coriolis force to give rise to a preferential tilt of the bipolar regions with respect to the equator – which is also known as Joy’s law.
The traditional picture is prone to criticism on several counts. (a) Recent numerical simulations of rotating spherical magneto-convection (Ghizaru et al., 2010; Käpylä et al., 2012b; Augustson et al., 2013) have shown that a solar-like dynamo can operate in the bulk of the convection zone, even without a tachocline. (b) Is it possible for a magnetic flux tube to rise coherently through the turbulent convection zone and still remain anchored to the tachocline? Numerical simulations of Guerrero & Käpylä (2011), admittedly at moderate magnetic Reynolds numbers, have found no evidence that this is possible. Recent simulations by Nelson & Miesch (2014) and Fan & Fang (2014) do find flux loops rising from mid depths of the convection zone, but in contrast to the traditional picture, they are not anchored at the bottom of the convection zone111 Fan & Fang (2014) only show extended patches of toroidal field, so the connection with sunspot formation remains open.. (c) As the flux tube rises, the magnetic field weakens, so even the traditional picture must invoke a re-amplification process near the surface. For example, Parker (1979) postulated downdrafts “to operate beneath the sunspot to account for the gathering of flux to form a sunspot.” Furthermore, current flux emergence simulations that include a photosphere (see, e.g., Kitiashvili et al., 2010; Cheung et al., 2010; Stein & Nordlund, 2012; Rempel & Cheung, 2014) do show such re-amplification, but the mechanism responsible for the re-amplification process remains unknown. (d) A natural corollary of the rising flux tube picture is that the active regions will emerge with preferential orientation at the surface of the Sun, whereas recent observational analysis (Stenflo & Kosovichev, 2012) shows that active regions actually emerge with random orientations but get preferentially oriented as time progresses. Note nevertheless that Longcope & Choudhuri (2002) have attempted to explain this discrepency within the framework of the conventional scenario by arguing that departures from a preferred orientation are due to turbulent convection and are restored past the emergence.
In the last decade, an alternative scenario has emerged. In this scenario, first suggested by Brandenburg (2005), the turbulent dynamo generates magnetic field in the bulk of the convection zone. In the near-surface shear layer, that has been observed in helioseismology (Schou et al., 1998), the dynamo-generated magnetic field propagates equatorward, satisfying the Parker-Yoshimura rule (Parker, 1955; Yoshimura, 1975). The observed preferential orientation of the active regions, the Joy’s law, can be understood as an effect of the shear (Brandenburg, 2005). In this scenario, which admittedly is yet to be supported by direct numerical simulations, although mean-field calculations do provide support (Pipin & Kosovichev, 2011), the active regions must form from a dynamo-generated large-scale magnetic field by the process of magnetic flux concentration operating at or near the surface of the Sun. This process may be the same re-amplification process necessary in the conventional scenario.
There have been two different, mutually complimentary, approaches to understand this process. On the one hand lies the numerical simulations by Kitiashvili et al. (2010), Cheung et al. (2010), Stein & Nordlund (2012), and Rempel & Cheung (2014) who solve radiative magneto-convection in a Cartesian domain under a simplified setup (non-rotating, no large-scale shear). All these simulations develop a bipolar magnetic structure at the top surface, but in all the cases the velocity and the magnetic field at the bottom boundary need to be carefully imposed. Furthermore, in these simulations, with the exception of Kitiashvili et al. (2010), the mechanism responsible for formation of magnetic structures has not been elucidated. Another related example are the magneto-convection simulations of Tao et al. (1998), where an imposed vertical field segregates into magnetized and unmagnetized regions. The authors ascribe this to the effect of flux expulsion, but the actual mechanism might well be another one. On the other hand lies a volume of work (Kleeorin et al., 1989, 1990; Kleeorin & Rogachevskii, 1994; Rogachevskii & Kleeorin, 2007; Brandenburg et al., 2010, 2011, 2012, 2013; Kemel et al., 2012a, b; Käpylä et al., 2012a; Warnecke et al., 2013), which have investigated the possibility that the negative effective magnetic pressure instability (NEMPI) is a mechanism of flux concentration and formation of active regions. In all of them, a small (compared to equipartition) background magnetic field has been imposed in a statistically stationary turbulent magneto-fluid in the presence of gravity; a large-scale instability (namely NEMPI) develops which forms magnetic structures.
The essence of this mechanism is related to a negative contribution of turbulence to the effective magnetic pressure (the sum of non-turbulent and turbulent contributions). This is caused by a suppression of total (kinetic plus magnetic) turbulent pressure by the large-scale magnetic field. For large magnetic and fluid Reynolds numbers these turbulent contributions are large enough so that the effective magnetic pressure becomes negative. This results in the excitation of a large-scale instability, i.e., NEMPI. The instability is efficient if the background magnetic field is within a specific range, which depends on the relative orientation between gravity and the imposed field. The maximum flux concentration achievable depends on the nonlinear saturation of NEMPI; unipolar spot-like structures (Brandenburg et al., 2011, 2013) and bipolar active region-like structures (Warnecke et al., 2013) have been obtained under different circumstances. We emphasize that turbulence plays a crucial role in the formation of those unipolar and bipolar magnetic structures. This may seem somewhat counterintuitive because in many other cases turbulence increases mixing by enhancing diffusion. However, there is no contradiction because there are many examples of pattern formation in reaction–diffusion systems that have been long studied and well understood; see, e.g., Cross & Hohenberg (1993) for a review.
A shortcoming, that is common between the NEMPI papers and the radiative magneto-convection papers quoted above is that the magnetic field is imposed externally, either over the whole volume or at the lower boundary. It is then necessary to investigate how the magnetic flux from dynamo-generated magnetic fields can be concentrated to form active regions. Furthermore, it has been observed that NEMPI is suppressed in the presence of rotation (Losada et al., 2012, 2013), which is an essential ingredient, together with gravity, to the generation of a large-scale magnetic field by dynamo action.
Hence, it is crucial to study the interaction between NEMPI and large-scale dynamo instabilities. It turns out that there exists a range of parameters over which it is possible for NEMPI to create magnetic flux concentrations from a dynamo-generated magnetic field; evidence in support of this picture has been obtained from both mean-field models (Jabbari et al., 2013) and direct numerical simulations (Jabbari et al., 2014). Particularly interesting cases of flux concentration from dynamo-generated fields, which have not been studied so far, are those where dynamo and NEMPI do not operate at the same physical location, but in different parts of the domain. For example, the dynamo may operate in the deeper layers of a stratified domain but not in the upper layers, whereas in the upper layers NEMPI can operate to produce flux concentrations. In this paper, we study this problem by direct numerical simulations.
2 The model
2.1 Governing equations
We solve the equations of isothermal magnetohydrodynamics (MHD) for the velocity , the magnetic vector potential , and the density ,
| (1) |
| (2) |
| (3) |
where the operator denotes the convective derivative, is the magnetic field, the current density, is the traceless rate of strain tensor (the commas denote partial differentiation), the kinematic viscosity, the magnetic diffusivity, and the isothermal sound speed. In addition, we assume the ideal gas law to hold. Our domain is a Cartesian box of size with . Periodic boundary conditions on all dynamical variables are assumed in the horizontal () plane. The velocity satisfies stress-free, non-penetrating boundary condition at the top and bottom boundaries. The volume-averaged density is therefore constant in time and equal to its initial value. At the bottom, perfectly conducting boundary conditions are imposed on the magnetic field, which is constrained to have only a vertical component at the top boundary (normal field boundary condition). The gravitational acceleration is chosen such that , which leads to a density contrast in the vertical direction between bottom and top of . Here is the density scale height.
2.2 Forced turbulence
Turbulence is sustained in the medium by injecting energy through the function given by (Brandenburg, 2001)
| (4) |
where is the position vector. On dimensional grounds, we choose , where is a nondimensional forcing amplitude. At each timestep we select randomly the phase and the wavevector from many possible wavevectors in a certain range around a given forcing wavenumber, . Hence is a stochastic process that is white-in-time and is integrated by using the Euler–Marayuma scheme (Higham, 2001). The Fourier amplitudes,
| (5) |
where characterizes the fractional helicity of , and
| (6) |
is a non-helical forcing function, and is an arbitrary unit vector not aligned with and is the unit vector along ; note that . By virtue of the helical nature of , a dynamo develops in the domain (Brandenburg, 2001). As we want to separate the domain over which dynamo operates from the domain over which it is possible for magnetic flux concentrations to happen, we choose the fractional helicity of the force to go to zero at the top layers of our domain, i.e., for , v.i.z.,
| (7) |
Here is the error function, and is a length scale chosen to be . We use several different values of and .
2.3 Non-dimensional parameters
We choose our units such that and . Our simulations are characterized by the fluid Reynolds number , the magnetic Prandtl number , and the magnetic Reynolds number . The magnetic field is expressed in units of . As the value of the turbulent velocity is set by the local strength of the forcing, which is uniform, the turbulent velocity is also statistically uniform over depth, and therefore we choose to define as the root-mean-square velocity based on a volume average in the statistically steady state. On the other hand, the density varies over several orders of magnitude as a function of depth and hence we choose as the horizontally and temporally average density at , which is the middle of the domain. Time is expressed in eddy turnover times, . We often find it useful to consider the turbulent-diffusive timescale, , where is the estimated turbulent magnetic diffusivity.
The simulations are performed with the Pencil Code,222http://pencil-code.googlecode.com which uses sixth-order explicit finite differences in space and a third-order accurate time stepping method. We typically use a numerical resolutions of mesh points, although some representative simulations at higher resolutions are also run.
Run A 2 1 17 30 0.041 0.33 900 B 1 17 30 0.042 0.33 900 B/2 1 17 30 0.036 0.33 900 C 1 17 30 0.045 0.33 900 D 1 17 60 0.043 0.17 1800 E 1 170 30 0.022 0.33 900 0-02 0 0.2 17 30 0.0043 0.33 900 0-1 0 1 17 30 0.043 0.33 900
3 Results
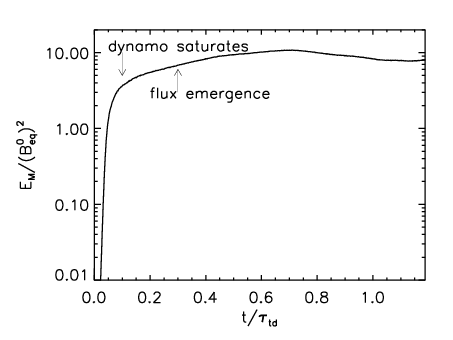
We have performed a number of runs varying mainly the values of and . We always used and, in most of the cases, we had and , but in one case we also used and in another . Our runs are summarized in Table LABEL:Ttimescale. Let us start by describing in detail one representative simulation among the many we have run; v.i.z., the case of Run B in Table LABEL:Ttimescale. In this case, the flow is helically forced up to the height of with . Above the plane the flow is indeed forced, but not helically, i.e., with . By virtue of helical forcing from the bottom wall up to the height of , a dynamo develops. In Fig. 1 we show the evolution of the volume averaged magnetic energy, , defined by
| (8) |
At short times there is a fast exponential growth of ; the growth rate, , is given in Table LABEL:Ttimescale. The dynamo saturates at about , see Fig. 1(a). In Fig. 1(b), we show the variation of horizontally averaged (over the plane) density , mean squared velocity , magnetic energy , and kinetic helicity as a function of the height , where is the vorticity. It is clear from Fig. 1(b) that immediately after dynamo saturation, both the kinetic helicity and the magnetic field are largely confined within the domain up to the height , but not the kinetic energy of the turbulence. Furthermore, in the deep parts of the domain, the horizontally averaged magnetic energy density is approximately proportional to density and thus to the local equipartition value, .
3.1 Flux emergence at the top surface
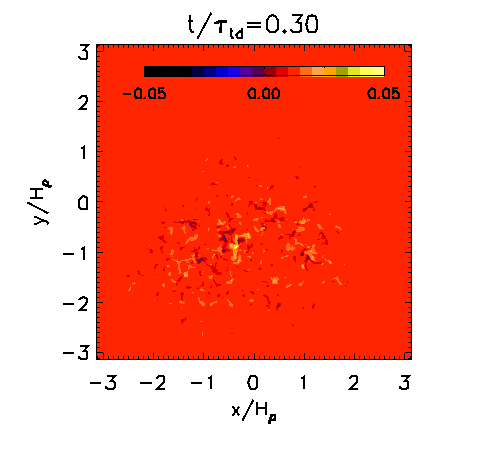
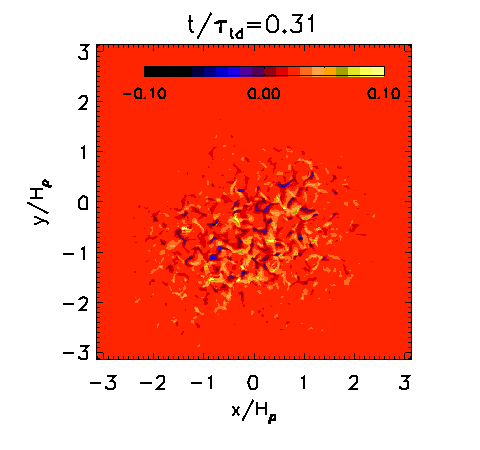
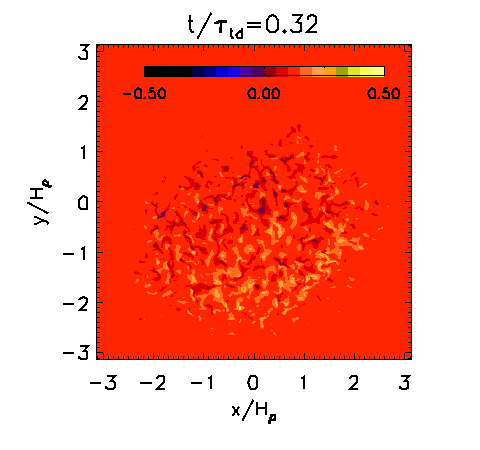
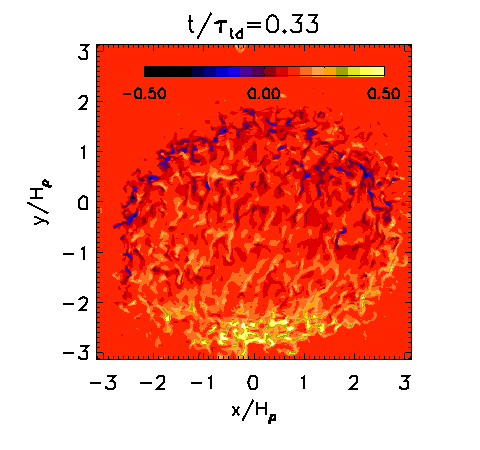
As the simulation progresses, at , magnetic flux of both signs emerges on the top surface. At first the flux emerges as small-scale fluctuations, but within a time of about , it self-organizes to a bipolar structure. The two polarities of the bipolar structure then move away from each other. This is demonstrated in a series of snapshots shown in Fig. 2. Here, stratified turbulence gives rise to anti-diffusive properties leading to the formation of bipolar structures. This is the first remarkable result from our simulations. Similar behaviour has been seen by Stein & Nordlund (2012), although not in self-consistent dynamo simulations but in simulations where the magnetic field at the bottom boundary was imposed in the upwellings. Furthermore, the self-organization we observe is not driven by radiative convection, as in the simulations of Stein & Nordlund (2012) but by forced isothermal turbulent flows.
3.2 Formation of an intense bipolar structure
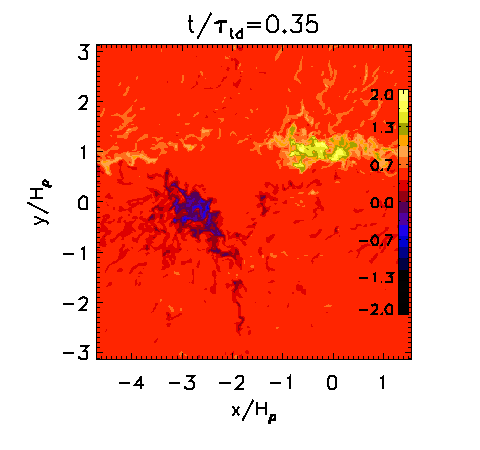
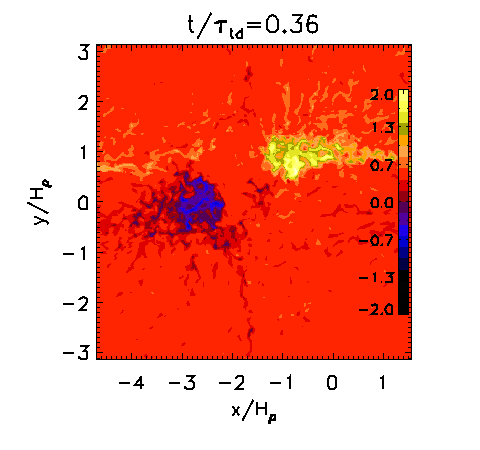
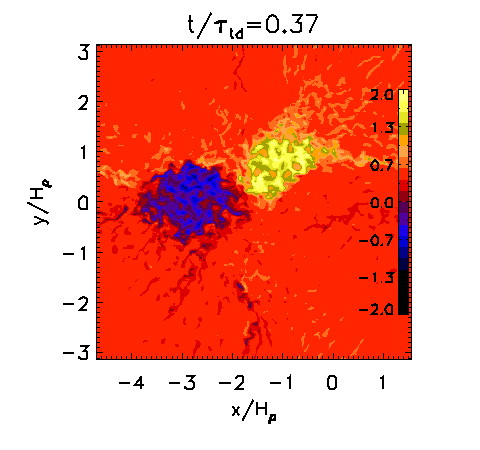
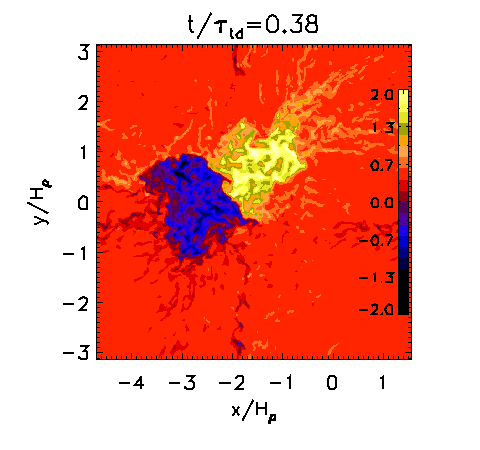
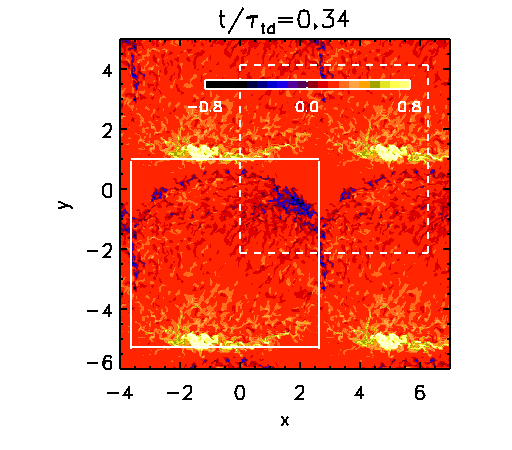
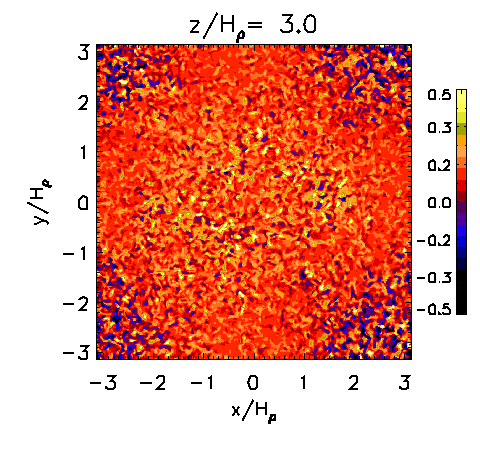
Due to periodic boundary conditions in the and directions, the two polarities, while moving away from each other, approach each other across the far end of the periodic domain, come close to each other and form a curious bipolar structure, reminiscent of the so-called spots (see review by Fisher et al., 2000). The component of the magnetic field is close to three times . This is shown in a series of snapshots in Fig. 3, where we have shifted the coordinate system relative to the one in Fig. 2 so as to have the bipolar structure in the middle of the top surface. As we are using periodic boundary conditions along the horizontal directions, we are free to make such a shift. To illustrate this, we show in Fig. 4 the magnetic field at the top of our computational domain in a box that is extended periodically to three times its originally size in both the and directions.
3.3 Recurrent spot activity
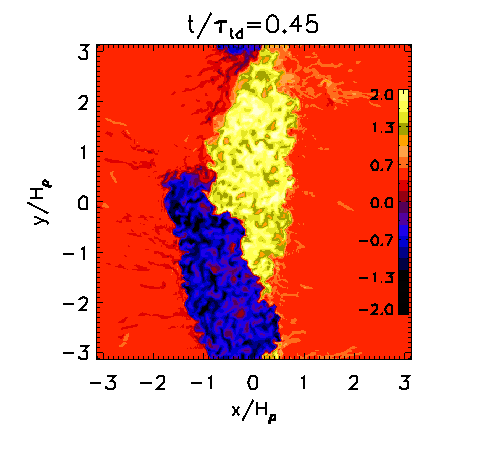
This spot-like structure survives up to , after which it turns into a bipolar band whose evolution is shown in a series of snapshots in Fig. 5. At about the band dissolves and the field at the top surface is close to zero. And a little while later the band-like structure reappears at a different position on the top surface and with time evolves to a spot-like structure similar to the one shown in Fig. 3; compare the last snapshot shown in Fig. 5 with that of Fig. 3.
3.4 How generic are the observed magnetic structures?
To summarise, in this simulation, Run B, the normal magnetic field at the top surface shows three principal qualitative features: (a) flux emergence, (b) formation of bipolar structures (spots and bands) and (c) a recurrent but not exactly periodic appearance of the bipolar structures. How typical are these qualitative behaviours with respect to variation of various parameters of our simulation? This question is addressed in the following manner: (a) We run a simulation, Run O-02, with the same parameters of Run B but with a different fractional helicity, . For this run, the helical dynamo instability is excited at a slower rate and the magnetic flux emergence at the top surface happens at a later time, nevertheless the same qualitative feature of bipolar magnetic structures are observed. (b) Keeping the value of fractional helicity, , to be constant, we vary the height of the dynamo region, from (Run B) to (Run C), (Run O-1), and (Run A). The flux emergence happens at different times; for higher the flux emergence is faster. Other than this quantitative change, there is no qualitative change to our results. (c) We run a simulation Run E with the same parameters as Run C, but with bigger resolution () and higher Reynolds number and obtain the same qualitative behaviour. In another simulation, Run D, we keep all the parameters the same as Run E, except for the forcing wavenumber, , and obtain the same qualitative behaviour. (d) Finally, we note that gravity plays a crucial role. In simulations without gravity () or even (Run B/2), no sharp magnetic structures are seen. Instead the magnetic field at the top has the same length scales as the dynamo-generated magnetic field at the bottom part of the domain, as demonstrated in Fig. 6. It is also clear from our results that the bipolar magnetic structures are strongly influenced by the periodicity of our domain. Is it possible to obtain similar structures, but at different length scales (relative to the box size) and in a larger domain? By running a simulation with double the box size () we have found that the characteristic length scales of the bipolar structures scaled by the box-size remains the same. This is because in our periodic geometry, the scale of the large-scale dynamo is always the largest possible one that fits into the domain. In future work, it is therefore important to relax this constraint arising from periodic boundary conditions using, for example, spherical geometry.
3.5 Sharp bipolar structures
A particularly interesting aspect of these simulations is the formation of bipolar magnetic structures with sharp edges, examples of which are Fig. 3 or Fig. 5. To document the characteristic length scale appearing in magnetic structures, we plot in Fig. 7 the angle-averaged Fourier spectrum of at the top surface at different times corresponding to the snapshots in Fig. 5. The plot demonstrates that, to represent the sharp structures, e.g., in the last snapshot in Fig. 5, Fourier modes up to and are necessary. This also underscores the necessity of having a large scale separation () to see these magnetic structures. Furthermore, we find that at large , the spectra can be approximated by a power law.
To take a closer look at the bipolar structure, we show in Fig. 8 the spot-like structure from Run A plotted together with the magnetic field lines in a three-dimensional representation. The magnetic field lines of opposite orientation approach each other with height and merge into a single sharp spot-like structure. This magnetic structure leaves a clear signature on the velocity field as we demonstrate in Fig. 9 by plotting the contours of the vertical component of overlaid with the horizontal components of velocity as arrows from Run A.
3.6 Can NEMPI describe our numerical results?
Let us now try to understand the flux emergence and the formation of bipolar structure. This falls in the general class of pattern formation in turbulent systems. A theoretical technique to describe this general class of problems is the mean-field theory where we average over the turbulent state to derive a set of mean-field equations. The problem of pattern formation then becomes a problem of studying the instabilities using the mean-field equations. A well-known example, pioneered by Krause et al. (1971) and Krause & Rädler (1980) is that of dynamo theory where the mean-field theory is applied to the induction equation (see, e.g., Brandenburg & Subramanian, 2005, for a review). A recent example of an application of this method to understand magneto-rotational instability in the presence of small-scale turbulence is by Väisälä et al. (2013).
For the present problem, we need to average the momentum equation over the statistics of turbulence. As a result of such an averaging, a new term (describing the turbulent contributions) will be added to the large-scale magnetic pressure term (Kleeorin et al., 1990; Kleeorin & Rogachevskii, 1994; Rogachevskii & Kleeorin, 2007). It has been shown that the effective magnetic pressure that is the sum of non-turbulent and turbulent (new term) contributions, can be negative in the presence of a background magnetic field which, in this problem, will be provided by the dynamo.
From symmetry arguments, such a term can be constructed using the background magnetic field and gravity. In the two extreme cases: one in which the gravity and the background magnetic field are perpendicular to each other (Brandenburg et al., 2012; Käpylä et al., 2012a), and the second in which gravity and the background magnetic field are parallel to each other (Brandenburg et al., 2014; Losada et al., 2014), the analysis of the instability simplifies. Unfortunately, the problem is more complicated in the present case where all the three components of magnetic field are present. In that case, a systematic determination of the new transport coefficients in the effective magnetic pressure, using direct numerical simulations (DNS), has not yet been performed. Nevertheless there are two signatures of NEMPI that we look for. Firstly, we know the effective magnetic pressure is negative only when the background magnetic field is neither too large or too small, within to when normalized by the equipartition magnetic field (Brandenburg et al., 2012). We find that this condition is satisfied near the top surface when the first flux emergence occurs, as shown in Fig. 10(a), but not at later stages as shown in Fig. 10(b). What is then the mechanism behind the disappearance and reappearance of the magnetic flux at the top surface? A clue to this puzzle is the fact that within mean-field theory the dynamo operating in the lower layers of the computational domain can be interpreted as an dynamo, where , where and are fluctuations. An dynamo for which varies within the domain can give rise to dynamo waves (Baryshnikova & Shukurov, 1987; Stefani & Gerbeth, 2005; Mitra et al., 2010), and indeed such dynamo waves are seen in our simulations as shown in the space-time diagram in Fig. 11.
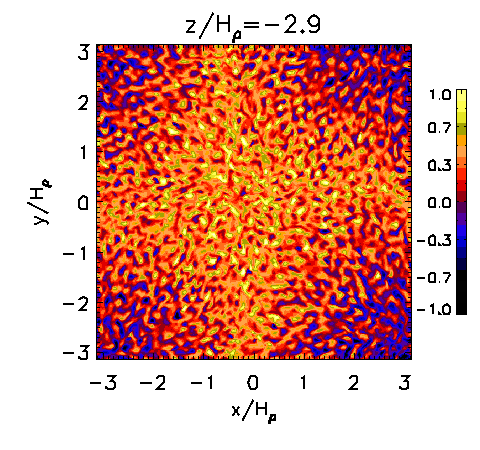


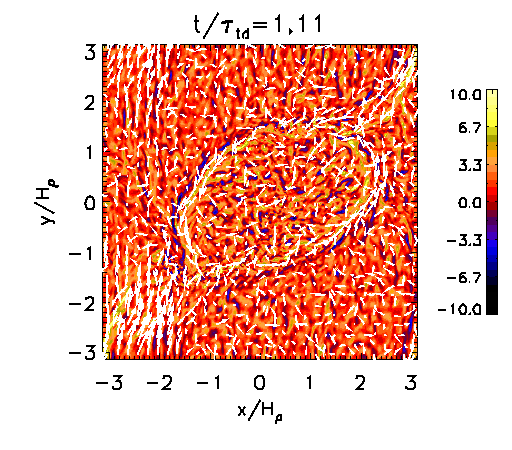

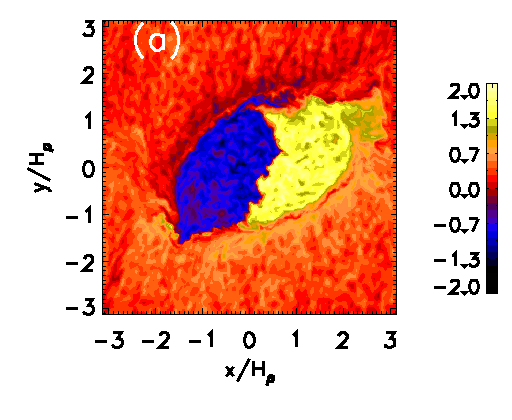
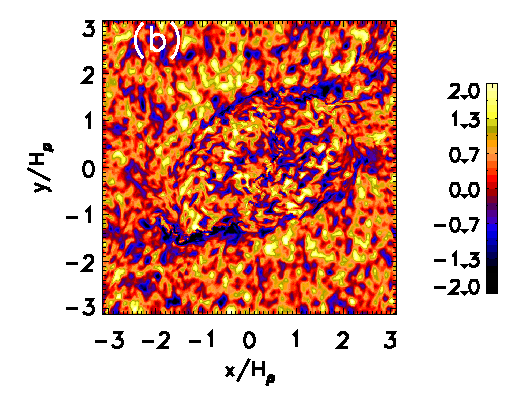
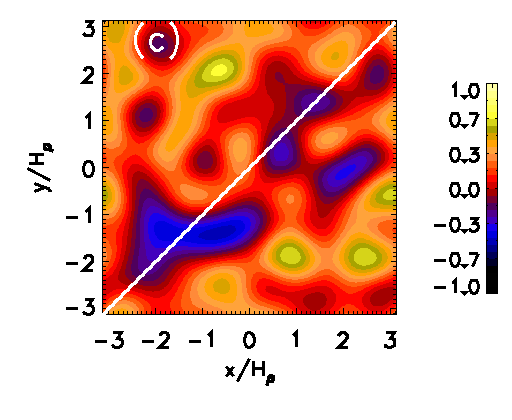
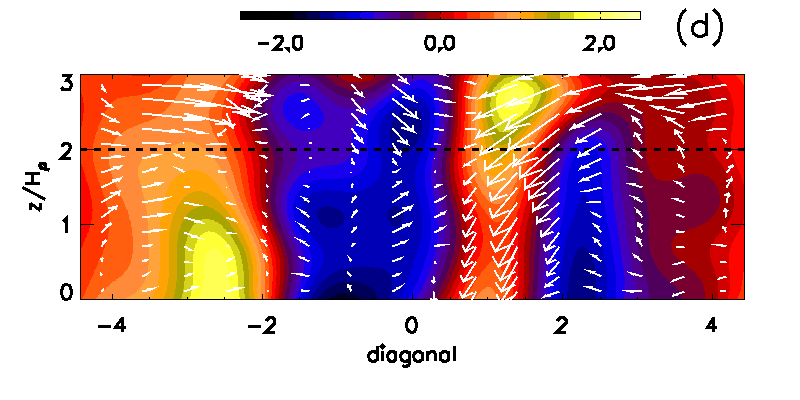
The second signature of NEMPI is its ability to generate large-scale flows; since NEMPI creates regions of negative effective magnetic pressure, it is often accompanied by a converging flow at the surface and a downward flow on and immediately below the location of flux concentration333In general converging flows are typically observed in simulations of stratified convection. Such flows can be quite effective in concentrating vertical magnetic flux. The crucial input coming from the concept of NEMPI is that the converging flows themselves are generated by NEMPI due to the presence of weak background magnetic field.. In our simulations, due to the presence of strong turbulent fluctuations, we have not been able to detect any such coherent flow, although some evidence in support of such a flow has been found in the Fourier filtered velocity field as shown in Fig. 12. Interestingly, similar downflows are also seen in recent simulations by Rempel & Cheung (2014), who inject a flux tube at the bottom of a solar convection simulation and let it rise to the surface. Although the emergence process itself is associated with upflows, their results show downflows at the late stages of the flux concentration process. In such simulations that attempt to be realistic, it is not possible to attribute the observed downflows to one single mechanism. By contrast, in our simple setup it is likely that NEMPI is indeed the mechanism responsible for generating the downward flow.

4 Conclusion
To conclude, in this paper, we have shown that it is possible to generate intense structures of vertical magnetic field at the top surface of DNS of a density-stratified turbulent dynamo. Furthermore, a rich dynamic behaviour of the magnetic field is observed: bipolar spot-like structures appear, then morph into bipolar band-like structures which disappear and reappear at a different place and at a later stage evolve into spot-like structures. Such structures are similar to spots (see, e.g., Fisher et al., 2000) and tend to show anticlockwise rotation, which is consistent with the fact that the kinetic helicity in our simulations is positive.
The characteristic length and time scales of the magnetic field formed at the top surface are much smaller than the characteristic length scale (and time scale) of the dynamo-generated magnetic field. The necessary conditions are strong stratification, presence of turbulence, and large scale separation, which is at least in the DNS we present here. Clearly, there is a mechanism at work here that can concentrate a weak large-scale magnetic field to strong magnetic field of smaller scale. Could this mechanism be NEMPI? At present, we cannot provide a definitive answer to this question, although we do show that the necessary conditions for NEMPI to operate are satisfied during the first emergence of flux at the top surface.
How relevant are our result in understanding the formation of active regions and sunspots? Unlike the works by e.g., Stein & Nordlund (2012) or Rempel & Cheung (2014), our simulations do not include radiative hydrodynamic convection; turbulence is generated by external forcing. This should not necessarily be considered a shortcoming of our simulations as the aim of our work has been to present the simplest model that can show formation of bipolar structures from a large-scale dynamo. This is the first time bipolar structures are found to appear in simulations where the magnetic field is not imposed – as is the case in Stein & Nordlund (2012), Warnecke et al. (2013), or Rempel & Cheung (2014) – but it is self-consistently generated from a dynamo in strongly stratified forced turbulence.
The most remarkable feature of these simulations is that a minimalistic setup consisting solely of stratification and helically forced turbulence can generate such diverse spatio-temporal behaviour. Could a mean-field model consisting of both dynamo equations and equations describing NEMPI capture such behaviour? This question will be the subject of future investigations.
Acknowledgements
Financial support from the European Research Council under the AstroDyn Research Project 227952, the Swedish Research Council under the grants 621-2011-5076 and 2012-5797, the Research Council of Norway under the FRINATEK grant 231444, as well as from the Government of the Russian Federation under a grant 11.G34.31.0048 are gratefully acknowledged. The computations have been carried out at the National Supercomputer Centres in Linköping and Umeå as well as the Center for Parallel Computers at the Royal Institute of Technology in Sweden and the Nordic High Performance Computing Center in Iceland.
References
- Augustson et al. (2013) Augustson K., Brun A. S., Miesch M. S., Toomre J., 2013, arXiv:1310.8417
- Baryshnikova & Shukurov (1987) Baryshnikova I., Shukurov A., 1987, Astron. Nachr., 308, 89
- Brandenburg (2001) Brandenburg A., 2001, ApJ, 550, 824
- Brandenburg (2005) Brandenburg A., 2005, ApJ, 625, 539
- Brandenburg et al. (2014) Brandenburg A., Gressel O., Jabbari S., Kleeorin N., Rogachevskii I., 2014, A&A, 562, A53
- Brandenburg et al. (2011) Brandenburg A., Kemel K., Kleeorin N., Mitra D., Rogachevskii I., 2011, ApJL, 740, L50
- Brandenburg et al. (2012) Brandenburg A., Kemel K., Kleeorin N., Rogachevskii I., 2012, ApJ, 749, 179
- Brandenburg et al. (2010) Brandenburg A., Kleeorin N., Rogachevskii I., 2010, Astron. Nachr., 331, 5
- Brandenburg et al. (2013) Brandenburg A., Kleeorin N., Rogachevskii I., 2013, ApJL, 776, L23
- Brandenburg & Subramanian (2005) Brandenburg A., Subramanian K., 2005, Phys. Rep., 417, 1
- Cheung et al. (2010) Cheung M., Rempel M., Schüssler M., 2010, ApJ, 720, 233
- Choudhuri (2008) Choudhuri A. R., 2008, Adv. Spa. Res., 41, 868
- Cross & Hohenberg (1993) Cross M. C., Hohenberg P. C., 1993, Rev. Mod. Phys., 65, 851
- Fan & Fang (2014) Fan Y., Fang F., 2014, ApJ, 789, 11.
- Fisher et al. (2000) Fisher G. H., Fan Y., Longcope D. W., Linton M. G., Pevtsov A. A., 2000, Sol. Phys., 192, 119. 139The solar dynamo and emerging flux
- Ghizaru et al. (2010) Ghizaru M., Charbonneau P., Smolarkiewicz P. K., 2010, ApJL, 715, L133
- Guerrero & Käpylä (2011) Guerrero G., Käpylä P., 2011, A&A, 533, A40
- Higham (2001) Higham D., 2001, SIAM Rev., 43, 525
- Jabbari et al. (2013) Jabbari S., Brandenburg A., Kleeorin N., Mitra D., Rogachevskii I., 2013, A&A, 556, A106
- Jabbari et al. (2014) Jabbari S., Brandenburg A., Losada I. R., Kleeorin N., Rogachevskii I., 2014, A&A, in press, arXiv:1401.6107
- Käpylä et al. (2012a) Käpylä P., Brandenburg A., Kleeorin N., Mantere M., Rogachevskii I., 2012a, MNRAS, 422, 2465
- Käpylä et al. (2012b) Käpylä P. J., Mantere M. J., Brandenburg A., 2012b, ApJL, 755, L22
- Kemel et al. (2012a) Kemel K., Brandenburg A., Kleeorin N., Mitra D., Rogachevskii I., 2012a, Sol. Phys., 280, 321
- Kemel et al. (2012b) Kemel K., Brandenburg A., Kleeorin N., Rogachevskii I., 2012b, Astron. Nachr., 333, 95
- Kitiashvili et al. (2010) Kitiashvili I., Kosovichev A., Wray A., Mansour N., 2010, ApJ, 719, 307
- Kleeorin & Rogachevskii (1994) Kleeorin N., Rogachevskii I., 1994, Phys. Rev. E, 50, 2716
- Kleeorin et al. (1990) Kleeorin N., Rogachevskii I., Ruzmaikin A., 1990, Sov. Phys. JETP, 97, 1555
- Kleeorin et al. (1989) Kleeorin N., Rogachevskii I., Ruzmaikin A., 1989, Sov. Astron. Lett., 15, 274
- Krause & Rädler (1980) Krause F., Rädler K.-H., 1980, Mean-field magnetohydrodynamics and dynamo theory. Pergamon Press, Oxford
- Krause et al. (1971) Krause F., Rädler K.-H., Steenbeck M., 1971, Technical Report NCAR-TN/IA-60, The Turbulent Dynamo, A translation by P.H. Roberts and M. Stix of a series of papers by F. Krause, K.-H. Rädler and M. Steenbeck. National Center for Atmospheric Research, Boulder, Colorado.
- Longcope & Choudhuri (2002) Longcope D., Choudhuri A. R., 2002, Sol. Phys., 205, 63
- Losada et al. (2013) Losada I., Brandenburg A., Kleeorin N., Rogachevskii I., 2013, A&A, 556, A83
- Losada et al. (2014) Losada I., Brandenburg A., Kleeorin N., Rogachevskii I., 2014, A&A, 564, A2
- Losada et al. (2012) Losada I. R., Brandenburg A., Kleeorin N., Mitra D., Rogachevskii I., 2012, A&A, 548
- Mitra et al. (2010) Mitra D., Tavakol R., Käpylä P. J., Brandenburg A., 2010, ApJL, 719, L1
- Nelson & Miesch (2014) Nelson, N. J., Miesch, M. S., 2014, Plasma Phys. Control. Fusion, 56, 064004
- Parker (1955) Parker E. N., 1955, ApJ, 122,293
- Parker (1979) Parker E. N., 1979, ApJ, 232,282
- Pipin & Kosovichev (2011) Pipin V. V., Kosovichev A. G., 2011, ApJL, 727, L45
- Rempel & Cheung (2014) Rempel M., Cheung M., 2014, ApJ, 785, 90.
- Rogachevskii & Kleeorin (2007) Rogachevskii I., Kleeorin N., 2007, Phys. Rev. E, 76, 056307
- Schou et al. (1998) Schou J., Antia H., Basu S., Bogart R., Bush R., Chitre S., Christensen-Dalsgaard J., Di Mauro M., Dziembowski W., Eff-Darwich A., et al., 1998, ApJ, 505, 390
- Stefani & Gerbeth (2005) Stefani F., Gerbeth G., 2005, Phys. Rev. Lett, 94, 184506
- Stein & Nordlund (2012) Stein R. F., Nordlund A., 2012, ApJL, 753, L13
- Stenflo & Kosovichev (2012) Stenflo J., Kosovichev A., 2012, ApJ, 745, 129
- Tao et al. (1998) Tao L., Weiss N., Brownjohn D., Proctor M., 1998, ApJL, 496, L39
- Väisälä et al. (2013) Väisälä M., Brandenburg A., Mitra D., Käpylä P., Mantere M., 2013, A&A, in press (arXiv:1310.3157).
- Warnecke et al. (2013) Warnecke J., Losada I. R., Brandenburg A., Kleeorin N., Rogachevskii I., 2013, ApJL, 777, L37
- Yoshimura (1975) Yoshimura H., 1975, ApJ, 201,740