Lower glycolysis carries a higher flux than any biochemically possible alternative
Abstract
The universality of many pathways of core metabolism suggests a strong role for evolutionary selection, but it remains unclear whether existing pathways have been selected from a large or small set of biochemical possibilities. To address this question, we construct in silico all possible biochemically feasible alternatives to the trunk pathway of glycolysis and gluconeogenesis, one of the most highly conserved pathways in metabolism. We show that, even though a large number of alternative pathways exist, the alternatives carry lower flux than the real pathway under typical physiological conditions. Alternative pathways that could potentially carry higher flux often lead to infeasible intermediate metabolite concentrations. We also find that if physiological conditions were different, different pathways could outperform those found in nature. Our results demonstrate how the rules of biochemistry restrict the alternatives that are open to evolution, and suggest that the existing trunk pathway of glycolysis and gluconeogenesis represents a maximal flux solution.
I Introduction
The biochemical pathways of central carbon metabolism are highly conserved across all domains of life, and largely control the productivity of life on Earth Romano1996 ; EricSmith2004 . Yet it remains unknown whether these pathways are the result of historical contingency during early evolution Pal2006 , or are instead optimal solutions to the problem of energy and biomass production PentoseGame ; Ebenhoeh2001 ; Heinrich97 ; Flamholz2013 ; Wagner2013 ; Noor2010 . Put simply, are there alternative biochemically feasible pathways that could perform the same function, and if so, how do they perform compared to those found in nature?
Previous studies have mainly addressed this question either by constructing simplified artificial metabolic networks PentoseGame ; Ebenhoeh2001 ; Heinrich97 , or by mining databases of biochemical compounds and reactions for known organisms Flamholz2013 ; Wagner2013 ; Samal2011 ; Bar-EvenPNAS ; HandorfExpanding . Both of these approaches have drawbacks: the former does not capture real biochemistry, while the latter is limited to metabolites and reactions found in well-studied organisms. Nevertheless this work has led to suggested optimality principles including maximizing biochemical flux or yield Ebenhoeh2001 ; Heinrich97 , minimizing biochemical steps or protein costs PentoseGame ; Flamholz2013 , and ensuring that function is maintained in a changing environment Samal2011 . Only a few studies have attempted to explore the full universe of possible metabolic pathways, using realistic rules of biochemistry Melendez-Hevia97 ; Mittenthal1998 ; Hatzimanikatis2005 ; Henry2010 ; Noor2010 . In particular, using this approach Noor et al. Noor2010 recently suggested that central carbon metabolism, taken as a whole, uses the minimal number of enzymatic steps needed to generate a predefined set of biochemical precursors.
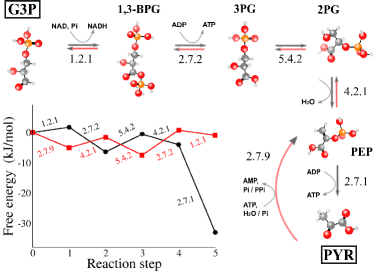
Here, we perform an exhaustive computational search for all possible biochemically feasible alternatives to one of the most ancient and most highly conserved sections of central carbon metabolism, the trunk pathway of glycolysis and gluconeogenesis. Glycolysis breaks down glucose to pyruvate, generating ATP, NADH and biosynthetic precursors, while gluconeogenesis uses ATP and NADH to generate glucose from pyruvate. The glycolytic-gluconeogenic pathway (Fig. S1) is almost linear and can be divided into two parts: an “upper” chain of reactions involving 6-carbon molecules, which connects glucose to glyceraldehyde-3-phosphate (G3P), and a “lower” chain of reactions involving 3-carbon molecules, which connects G3P to pyruvate (Fig. 1). This lower reaction chain is known as the trunk pathway. In prokaryotes, the glycolytic and gluconeogenic trunk pathways consist of almost the same set of 5 reactions, differing only in one step. In glycolysis, the exergonic conversion of phosphoenolpyruvate (PEP) to pyruvate is coupled to the phosphorylation of ADP to ATP, while in gluconeogenesis the reverse reaction is driven by the hydrolysis of ATP to AMP, either with release of inorganic phosphate (the phosphoenolpyruvate synthase (pps) route), or via consumption of inorganic phosphate and release of pyrophosphate (the phosphate dikinase (ppdk) route).
While the upper part of the glycolytic/gluconeogenic pathway exists in several very distinct variants, most notably the Embden-Meyerhof-Parnas and Entner-Doudoroff pathways (Fig. S1) Flamholz2013 ; Bar-Even2012 , the trunk pathway is ubiquitous, and contains enzymes which are highly conserved and universally distributed across the three domains of life Ronimus2002 ; Verhees2003 . The existence of such an ancient and universal pathway suggests three possible scenarios: (i) the trunk pathway is the only biochemical possibility, (ii) alternatives exist but the extant pathway is evolutionarily optimal and (iii) alternatives are possible but have not been found by evolution. Distinguishing these scenarios lies at the heart of much of evolutionary biology. Here, we address this question directly using a computational approach. By systematically constructing and exploring the full space of biochemically feasible metabolites and reactions, many of which are not currently exploited by any known organism, we find that hundreds of alternative trunk pathways are possible. The one observed in nature, however, carries the maximal biochemical flux, under reasonable constraints on the intermediate metabolite and enzyme concentrations. Our results suggest that the trunk pathway represents an optimal solution among many possible alternatives.
II Results
II.1 A network of all possible biochemical reactions
We used a computer program to generate the network of all possible biochemically feasible pathways between G3P and pyruvate.
Metabolites. Our program first systematically generates all possible relevant internal metabolites, i.e. molecules intermediate between G3P and pyruvate, including those that are not found in nature. Central carbon metabolism consists exclusively of reactions between “CHOP” molecules: those composed of carbon, hydrogen, oxygen and phosphorus atoms, with the latter being present only in phosphate groups. Nitrogen and sulfur are present only in cofactors such as ATP, NAD and CoA MorowitzPNAS ; MorowitzCOMPLEXITY . Moreover, the trunk pathway contains only unbranched aliphatic 3-carbon CHOP molecules, with the exception of the 4-carbon oxaloacetate, used in gluconeogenesis in liver and kidney cells Stryer . We therefore include in our analysis all possible unbranched aliphatic CHOP molecules containing up to 4 carbon atoms. We consider only molecules which are electrostatically charged (i.e. include carboxyl or phosphate groups). This condition is motivated by the need to avoid leakage through the lipid membrane, and is satisfied by almost all molecules in core metabolism Srinivasan2009 . Applying these criteria results in over 1000 different molecules, including all the internal metabolites in the real trunk pathway. We computed the free energy of formation for all our internal metabolites, using existing experimental data where possible alberty_biochemical_2006 or, in the absence of such data, using a variant of the group contribution method Mavrovouniotis91 ; Mavrovouniotis90 ; Jankowski2008 (see Methods and Supporting Information suppmatt ).
Reactions. Our program generates all possible reactions among our set of internal metabolites, based on 12 EC reaction classes EC , which encompass all the reactions between CHOP molecules of length 2-4 carbons in core metabolism (Table 1) Stryer . Many of these reactions involve cofactors such as ATP and NAD; we refer to these as external metabolites and we assume that they have fixed concentrations, which define the cellular (physiological) conditions. The external metabolites in our reaction network are ATP, ADP, AMP, NAD, NADH, inorganic phosphate Pi, pyrophosphate PPi, CO2 and H2O. For each of our reaction classes, we include all known couplings with the external metabolites (see Supporting Information suppmatt ).
| EC class | Example reaction | |
|---|---|---|
| 1.1.1 | oxidation | CH3-CH2(OH) + NAD+ CH3-CHO + NADH |
| 1.2.1 | CH3-CHO + NAD+ + Pi CH3-COp + NADH + H+ | |
| 2.7.1 | CHO-CH2(OH) + ATP CHO-CH2p + ADP | |
| 2.7.2 | phosphate transfer | CH3-COOH + ATP CH3-COp + ADP |
| 2.7.9 | CH3-CO-COOH + ATP + H2O/Pi CH2=Cp-COOH + AMP + Pi/PPi | |
| 3.1.3 | hydrolysis | CH3-CH2p + H2O CH3-CH2(OH) + Pi |
| 4.1.1 | decarboxylation | CH3-CH(OH)-COOH + H2O CH3-CH2(OH) + CO |
| 4.2.1 | dehydration | CH3-CH(OH)-COOH CH2=CH-COOH + H2O |
| 5.3.1 | isomerisation | CH3-CO-CH2(OH) CH3-CH(OH)-CHO |
| 5.3.2 | tautomerism | CH3-C(OH)=C(OH)-CH2p CH3-CO-CH(OH)-CH2p |
| 5.4.2 | isomerisation | CH3-CH(OH)-CH2p CH3-CHp-CH2(OH) |
| 6.4.1 | ATP-driven carboxylation | CH3-CH2(OH) + CO + ATP CH3-CH(OH)-COOH + ADP + Pi |
II.2 Our network generates many alternative trunk pathways
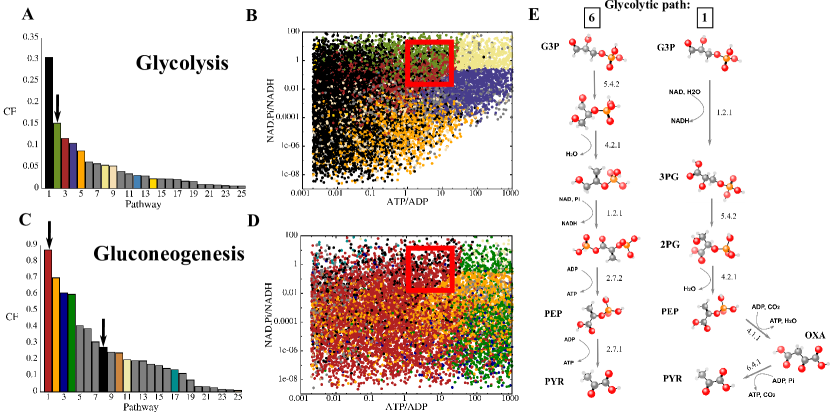
Our network reveals a huge number of alternative pathways connecting G3P and pyruvate, which are consistent with the rules of biochemistry. For example, in the glycolytic direction, we find 13 pathways of length 4, 532 pathways of length 5, and the number of pathways increases exponentially with the path length (Fig. S2). Some of these alternative pathways use the same set of reaction types as the real trunk pathway, but execute them in a different order (e.g. Fig.2 E, left). Others make use of a different set of reaction types (Fig 2E, right). A similar picture holds in the gluconeogenic direction (Fig. S2).
How many of these alternative trunk pathways are feasible under typical physiological conditions? We first demand that candidate pathways in the glycolytic direction should produce at least 2 ATP molecules. This is required to make the whole glycolytic pathway produce a net ATP yield, since the two dominant forms of glycolysis, the EMP and ED pathways, consume 1 ATP molecule per G3P in their upper halves. In the gluconeogenic direction, the real trunk pathway consumes 2 ATPs, one of which is converted to ADP and the other to AMP (Fig. 1); the AMP being eventually recycled to ADP via the consumption of a third ATP in the adenylate kinase reaction. In this direction, we exclude any candidate paths that have a poorer yield of G3P per ATP than the real path. Motivated by considerations of simplicity PentoseGame ; Noor2010 and cost of enzyme production Flamholz2013 , we then further restrict our analysis to those pathways with the minimum number of steps. In both the glycolytic and gluconeogenic directions, the minimum pathway length consistent with the above requirements is 5 steps; our network generates 202 candidate 5-step glycolytic paths, and 300 candidate 5-step gluconeogenic paths.
II.3 Real glycolysis and gluconeogenesis carry maximal flux under physiological conditions
We next evaluated the performance of the alternative trunk pathways generated by our network, by comparing their steady-state metabolic flux. For glycolytic pathways, the metabolic flux corresponds to the rate of ATP production, while for gluconeogenic pathways, it corresponds to the rate of production of G3P (and ultimately of glucose). This flux depends not only on the total free energy change across a given pathway, but also on the distribution of the individual reaction free energies (see e.g. Fig. 1), which in turn depends on the intracellular environment via the concentrations of the external metabolites. For linear pathways, the flux can be calculated analytically, assuming linear kinetics with diffusion-limited enzymes Heinrich97 ; Albery76 ; Heinrich91 (see Methods). We also assume that, for each pathway, the individual enzyme concentrations are optimised to maximise pathway flux, for a fixed total amount of enzyme (although similar results are obtained when we relax this assumption; Fig. S3).
Importantly, when calculating the metabolic flux, we impose constraints on the intermediate internal metabolite concentrations. For the bacterium E.coli, metabolite concentrations range from 0.1M to 100mM, with the total intracellular metabolite pool being around 300mM Bennett2009 . We expect that very low metabolite concentrations are undesirable due to molecular noise, while very high concentrations are precluded by osmotic considerations. We therefore set the flux to zero for a given pathway if any of its intermediate metabolite concentrations falls outside the range 1nM to 0.5M.
Imposing this constraint, we calculated the metabolic flux of all our 202 glycolytic, and 300 gluconeogenic candidate paths, across a wide range of intracellular conditions, as defined by the external metabolite concentrations. We randomly selected 10,000 points from the 10-dimensional parameter space consisting of the concentrations of the 8 external metabolites, G3P and pyruvate, sampling each parameter logarithmically over several orders of magnitude above and below its typical physiological concentration (see Supporting Information suppmatt ). For each point in parameter space we evaluated the flux of each candidate pathway.
As a simple metric, we first compare the performance of our candidate pathways, averaged over the entire parameter space. To this end, we compute the comparative flux (CF), which is the flux of a given pathway, divided by the maximum flux obtained amongst all pathways, at a given point in parameter space. Averaging this quantity across the whole parameter space gives a measure of relative performance, for each candidate path. We find that the real glycolytic and gluconeogenic pathways perform remarkably well, compared to the many alternatives (Fig. 2, left panels). For glycolysis (Fig. 2A), the natural trunk pathway (in green, indicated by the arrow) outperforms all the alternative pathways except one. For gluconeogenesis, the two natural variants, with different cofactor coupling for the pyruvate to PEP step, are ranked first (the pps route, shown in red in Fig. 2C) and 8th (the ppdk route, shown in black in Fig. 2C). These results strongly suggest that the natural trunk pathways carry a high flux compared to alternatives; however this metric is dependent on the range of parameter space that is sampled.
To investigate in more detail, we analyzed which of our candidate pathways achieved the highest flux at different points in the parameter space. This allows us to understand how the performance of a given pathway depends on the intracellular environment. Our results show that different candidate pathways perform best in different regions of the parameter space. In particular, pathway performance is very sensitive to the cellular energy state, as measured by the ratio of the ATP and ADP concentrations ([ATP]/[ADP]), and redox state, as measured by the ratio [NAD][Pi]/[NADH] (Fig. 2 (middle panels)). Focusing on the glycolytic pathways (Fig. 2B) we see that, remarkably, the natural trunk pathway (green dots) outperforms all the alternatives in the region of parameter space close to that found in living cells (red box). This suggests that the glycolytic trunk pathway represents a maximal flux solution for the conversion of G3P to pyruvate, under typical intracellular conditions. For the gluconeogenic pathways (Fig. 2D), a similar picture holds. Here, the two pathways found in nature, the pps-route (red) and the ppdk-route (black), both outperform the alternatives under typical physiological conditions (red box). The relative performance of these two pathways depends sensitively on the concentration of pyrophosphate (see Fig. S4).
II.4 Alternative trunk pathways
Our analysis reveals several alternative pathways that can, under different intracellular conditions, outperform the true glycolytic and gluconeogenic pathways (Fig. 2, middle panels and Fig. 3, Fig. S5-S8).
In the glycolytic direction, path 1 (black) outperforms the real trunk pathway for low [ATP]/[ADP] ratios (Fig. 2B), resulting in its apparently better performance than the real pathway when averaged over the whole parameter space (Fig. 2A). This pathway, shown on the right of Fig. 2E, differs from the real pathway in that it converts G3P directly to 3-phosphoglycerate (3-PG) without the production of ATP (Fig. 3, compare black and green). This means that it has a highly exergonic oxidation reaction as its first step. In a linear pathway, the initial reactions tend to exert the greatest control over the flux Heinrich97 , so an exergonic first reaction can result in a large flux. However, pathway 1 is highly sensitive to the constraints on the intermediate metabolite concentrations. Because of its exergonic first reaction, it tends to accumulate high concentrations of downstream metabolites, causing it to be deemed infeasible in our analysis over a large part of the parameter space.
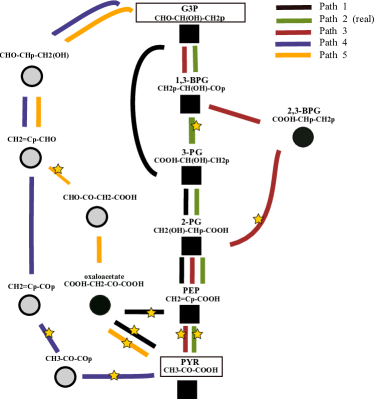
Pathway 3 (red), is similar to the real glycolytic trunk path, except that 1,3 bisphosphoglycerate (1,3-BPG) is first isomerized (to 2,3-BPG) and then dephosphorylated (to 2-phosphoglycerate 2PG, with ATP generation), rather than being first dephosphorylated and then isomerized as in the real pathway (Fig. 3 and Fig. S5). The large free energy change for the isomerization (kJmol-1) means that pathway 3 can in principle carry a higher flux than the real pathway, but because of this large drop in free energy it tends to accumulate high concentrations of 2,3-BPG and is therefore only favourable for low concentrations of the starting metabolite G3P. Interestingly, a similar pathway exists in red blood cells, where 2,3-BPG is produced from 1,3-BPG via the Rapoport-Leubering shunt Cho23bpg . In red blood cells, however, the 2,3-BPG is hydrolysed to either 3-PG or 2-PG without ATP generation Cho23bpg , thus sacrificing one ATP compared to the usual glycolytic pathway. It is tempting to hypothesize that nature is forced to sacrifice an ATP molecule when using this shunt, to prevent the buildup of 2,3-BPG, which is already the most concentrated organophosphate in erythrocytes.
Pathway 4 (violet) outperforms the real pathway at high ATP concentrations (Fig. 2B); this is because its ATP producing steps are at the end (4th and 5th steps), in contrast to the real pathway where ATP is produced in the 2nd and 5th steps (Fig. 3, Fig. S5). Because later steps in a linear pathway tend to have less impact on the flux Heinrich97 , this makes pathway 4 more tolerant of high ATP concentrations than the real pathway. Similarly, pathway 5 (orange) differs from the real pathway in that its oxidation step is moved to the end (the 4th step rather than the first as in the real pathway); this makes pathway 5 more tolerant of reducing conditions than the real pathway (Fig. 2B, Fig. S5). Several other interesting alternative glycolytic trunk pathways are discussed in the Supporting Information suppmatt , section XI.
In the gluconeogenic direction (Fig. 2, C and D; Fig. S7 and S8), pathways 1 (red) and 8 (black) correspond to the two prokaryotic trunk pathway variants found in nature, the pps and ppdk routes. Interestingly, alternative pathways 2-7 all contain the same set of reaction types as the real pps pathway, but carry out these reactions in varying order, thus making use of different intermediate internal metabolites. This affects their relative performance in different regions of the parameter space. For example, pathway 2 (orange) and pathway 4 (green) both differ from the real pps pathway in that ATP is consumed in the first two reactions (rather than in the 1st and 4th reactions as in the real pps pathway, Fig. S8). This makes their flux more sensitive to the ATP concentration, explaining why they dominate at high ATP/ADP ratio (Fig. 2D).
Interestingly, eukaryotes use a slightly different gluconeogenic trunk pathway, in which the conversion of pyruvate to PEP is a two-step process (via 4-carbon oxaloacetate) in which ATP is converted to ADP twice, rather than a 1-step process, converting ATP to AMP as in the prokaryotic pps and ppdk routes. Because the eukaryotic gluconeogenic trunk pathway is of length 6 steps, it was not considered in our analysis. However, when we repeat our analysis in the absence of dikinase reactions (i.e. not allowing the conversion of ATP to AMP), we find that the shortest feasible gluconeogenic pathways are 6 steps, and that the real eukaryotic pathway outperforms all alternatives under physiological conditions (Fig. S9).
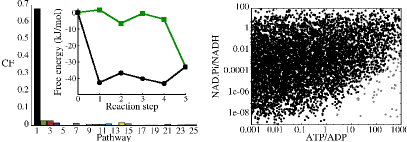
II.5 Constraints on metabolite concentrations are important
Imposing constraints on the intermediate internal metabolite concentrations is crucial to our analysis. Repeating our analysis without these constraints produces a very different outcome (Fig. 4). In the glycolytic direction, if the metabolite concentrations are unconstrained, glycolytic path 1 (Fig. 2E, right; black in Fig. 2A and B), which has a highly exergonic first reaction, produces the highest flux across the entirety of the parameter space. A similar picture emerges in the gluconeogenic direction (Fig. S10). The fact that our results are strongly affected by constraining the metabolite concentrations highlights the importance of considering metabolite concentrations when using methods such as flux balance analysis Varma1994 to study metabolic networks.
Interestingly, all the enzymes required for glycolytic pathway 1 exist in nature, in various organisms (Fig. S6), although this route is not known to be used in nature as a glycolytic pathway. Our analysis hints that constructing this pathway could provide an interesting target for synthetic biology, since it could, in principle, provide a new way to accelerate growth of organisms useful for biotechnological applications, if suitable branching pathways were provided to prevent the buildup of downstream metabolites.
We also repeated our analysis, imposing a narrower concentration range for the intermediate metabolite concentrations ( to M rather than to M). Under these constraints, we find that the real glycolytic pathway outperforms the alternatives over a wider range of parameter space, while the restricted concentration range has little effect on our results for the gluconeogenic paths (Fig. S11). This further supports the picture emerging from our analysis, that in the presence of reasonable limits on intermediate metabolite concentrations, the real glycolytic and gluconeogenic paths outperform the alternatives.
III Discussion
Despite the huge variety and complexity of life on Earth, the biochemistry of core metabolism is remarkably universal. Our analysis shows that this universality does not arise from an absence of other possibilities. Using a systematic approach, we have identified many alternatives to perhaps the most highly conserved set of metabolic reactions, the glycolytic and gluconeogenic trunk pathways. Our alternative pathways obey the rules of biochemistry, carry positive flux under reasonable intracellular conditions, and satisfy reasonable constraints on metabolite concentrations. Remarkably, of all these alternatives, we find that the trunk pathway observed in nature carries the highest biochemical flux in both the glycolytic and gluconeogenic directions, for parameters that represent typical intracellular physiological conditions. Of the two variants of the prokaryotic gluconeogenic pathway that are found in nature, the pps route is the best performer across a wide parameter range, while the ppdk route also carries a high flux, but is more sensitive to environmental conditions, requiring a low concentration of pyrophosphate (Fig. S4). The fact that our analysis identifies the real pathways using only flux maximization combined with constraints on intermediate metabolite concentrations and a requirement for minimal pathway length suggests that these three factors are all likely to have been important driving forces in the evolution of metabolism.
Flux maximization is widely recognized as an important concept in the study of metabolism; both from the perspective of glycolysis Heinrich97 ; Ebenhoeh2001 and more broadly Varma1994 . Our results support this picture, but suggest that evolutionary pressures on metabolic fluxes have to operate within the context of reasonable constraints on metabolite concentrations, and that neglecting these constraints can produce dramatically different outcomes. Our results expand on the recent suggestion of Noor et al. Noor2010 that central carbon metabolism can be understood as a minimal walk between the set of metabolites essential for growth. In our analysis, the real pathways do indeed minimize the total number of reaction steps; this imposes a strong constraint on the number of alternative paths. However we find that the requirement to produce a set of essential biochemical precursors is not sufficient to explain the biochemical structure of the natural trunk pathway. Firstly, alternative pathways are possible which produce the essential precursors with the same number of steps (e.g. glycolytic path 1). Secondly, many of our alternative pathways produce very similar, but not identical, intermediates to those of the real trunk pathway and it is conceivable that these could be used as alternative precursors. Our results show that flux maximization provides a criterion by which these alternative minimal-length pathways may be distinguished.
Our analysis also reveals alternative trunk pathways which can perform better than the real one under different concentrations of reactant, product and external metabolites. While some of these alternatives involve compounds and reactions which are not found in biochemical databases, others use enzymes which are known to exist in nature. The latter pathways are clearly plausible biochemically but are apparently not used in nature. In some cases (e.g. our alternative glycolytic paths 1 and 3) this is probably because they tend to generate large intermediate concentrations. In other cases (e.g. glycolytic pathways 4 and 5), the alternatives are not optimal under typical physiological conditions, but would be optimal if conditions were different.
In this study, we have limited our analysis to pathways which start and end at G3P and pyruvate. Relaxing this requirement would certainly lead to many more alternative pathways for the generation of energy, and for biosynthesis. While it is also important to consider other factors, including the need for integration within a wider metabolic network, our analysis suggests that key principles underlying the structure of core metabolism may emerge from simple biochemical, thermodynamic and biophysical considerations.
IV Methods
IV.1 Chemical compounds and reactions
We created a list of chemical compounds with 2, 3 or 4 carbon atoms by generating all possible linear combinations of the 17 “building blocks” shown in Table SI. Each of the building blocks was composed of a single carbon atom with associated oxygen, hydroxyl, hydrogen and/or phosphate groups. Building blocks were connected together in linear chains by single or double bonds. This procedure created 1008 linear molecules, 828 of which are electrostatically charged in solution, i.e. containing at least one carboxyl or phosphate group. These 828 molecules are our internal metabolites. Next, for every possible pair of molecules from this list we checked systematically whether the reactions from Table 1 could transform one molecule into another, allowing for all possible couplings with the external metabolites. In this way, a network of 7145 reactions was generated (see Supporting Information suppmatt section VII).
IV.2 Free energies of compounds and reactions
For those internal metabolites which are known biochemical species, standard free energies of formation were taken from the literature alberty_biochemical_2006 . For other internal metabolites, for which such data does not exist, we employed a variant of the group contribution method Mavrovouniotis91 ; Mavrovouniotis90 ; Jankowski2008 . For each such molecule , composed from building blocks , we calculated using
| (1) |
where is a constant, is the contribution of group and is a small correction due to neighbouring group-group interactions. The values of , the vector and matrix are determined by performing a least-squares fit to a training set of molecules with known s that correspond most closely to the linear CHOP molecules of our network (see Supporting Information suppmatt section III). Thermodynamic profiles in Figs 1 and 4 are plotted for 1M concentrations of all metabolites.
IV.3 Flux calculation
We used the method of Ref. Heinrich97 to calculate the flux carried by a linear pathway. This method assumes that the flux through reaction is given by Albery76 ; Heinrich97 :
| (2) |
where is the diffusion-controlled rate constant, is the enzyme concentration, and represent substrate and product concentrations and is the thermodynamic constant. This expression assumes that the enzyme acts as a perfect catalyst, and is used to derive an expression for pathway flux and metabolite concentrations (a complete explanation can be found in the Supporting Information suppmatt section IV and V). We then use Powell’s method NumericalRecipes to find the set of enzyme concentrations which maximize the flux subject to the constraints that (1) all steady-state intermediate concentrations are within the prescribed range and (2) the total enzyme concentration is fixed.
IV.4 Sampling the parameter space
We randomly selected 10000 points from the parameter space corresponding to the concentrations of 8 external metabolites and the G3P and pyruvate concentrations. Each parameter was sampled logarithmically over a range covering several orders of magnitude above and below its typical physiological concentrations (see Table SIV). For each of these parameter points, we calculated the optimized flux of each candidate pathway as detailed above, and computed the comparative flux of path as , by dividing its flux by the highest flux obtained across all pathways at the given point in parameter space.
IV.5 Robustness of our results to small free energy changes
Using the group contribution method, the typical error in our calculation of the free energy of formation for a given molecule is a few kJ/mol (see Supporting Information suppmatt section III). To check the robustness of our results to such errors, our entire analysis was repeated using values computed using different sets of training molecules, consisting of 80% of the molecules from the original training set, chosen at random. The qualitative results using such networks were identical from those obtained from the full set of training compounds. For example, the top 25 glycolytic pathways obtained from the reduced set contained 23 out of the 25 pathways from the original analysis. Although the rank order of the pathways in terms of comparative flux across the whole parameter space did differ, the top 3 performing pathways were the same in both cases.
Acknowledgments
BW and RJA contributed equally to this work. We thank Patrick Warren and Vincent Danos for many helpful discussions. SJC was supported by a Carnegie/Caledonian Scholarship from the Carnegie Trust for Scotland, BW was supported by a Leverhulme Trust Early Career Fellowship and by a Royal Society of Edinburgh Personal Research Fellowship, and RJA was supported by a Royal Society University Research Fellowship.
Conflict of interest
The authors declare no competing financial interests.
References
- (1) Romano, A. & Conway, T. Evolution of carbohydrate metabolic pathways. Res. Microbiol. 147, 448 – 455 (1996).
- (2) Smith, E. & Morowitz, H. J. Universality in intermediary metabolism. Proc. Natl Acad. Sci. USA 101, 13168–13173 (2004).
- (3) Pal, C. et al. Chance and necessity in the evolution of minimal metabolic networks. Nature 440, 667–670 (2006).
- (4) Meléndez-Hevia, E. & Isidoro, A. The game of the pentose phosphate cycle. J. Theor. Biol. 117, 251 – 263 (1985).
- (5) Ebenhöh, O. & Heinrich, R. Evolutionary optimization of metabolic pathways. theoretical reconstruction of the stoichiometry of ATP and NADH producing systems. B. Math. Biol. 63, 21–55 (2001).
- (6) Heinrich, R., Montero, F., Klipp, E., Waddell, T. G. & Meléndez-Hevia, E. Theoretical approaches to the evolutionary optimization of glycolysis: Thermodynamic and kinetic constraints. Eur. J. Biochem. 243, 191–201 (1997).
- (7) Flamholz, A., Noor, E., Bar-Even, A., Liebermeister, W. & Milo, R. Glycolytic strategy as a tradeoff between energy yield and protein cost. Proc. Natl Acad. Sci. USA (2013).
- (8) Barve, A. & Wagner, A. A latent capacity for evolutionary innovation through exaptation in metabolic system. Nature 500, 203–206 (2013).
- (9) Noor, E., Eden, E., Milo, R. & Alon, U. Central carbon metabolism as a minimal biochemical walk between precursors for biomass and energy. Mol. Cell 39, 809 – 820 (2010).
- (10) Samal, A., Wagner, A. & Martin, O. C. Environmental versatility promotes modularity in genome-scale metabolic networks. BMC. Syst. Biol. 5 (2011).
- (11) Bar-Even, A., Noor, E., Lewis, N. E. & Milo, R. Design and analysis of synthetic carbon fixation pathways. Proc. Natl Acad. Sci. USA 107, 8889–8894 (2010).
- (12) Handorf, T., Ebenhöh, O. & Heinrich, R. Expanding metabolic networks: Scopes of compounds, robustness, and evolution. J. Mol. Evol. 61, 498–512 (2005).
- (13) Meléndez-Hevia, E., Waddell, T. G., Heinrich, R. & Montero, F. Theoretical approaches to the evolutionary optimization of glycolysis: Chemical analysis. Eur. J. Biochem. 244, 527–543 (1997).
- (14) Mittenthal, J. E., Yuan, A., Clarke, B. & Scheeline, A. Designing metabolism: Alternative connectivities for the pentose phosphate pathway. B. Math. Biol. 60, 815–856 (1998).
- (15) Hatzimanikatis, V. et al. Exploring the diversity of complex metabolic networks. Bioinformatics 21, 1603–1609 (2005).
- (16) Henry, C. S., Broadbelt, L. J. & Hatzimanikatis, V. Discovery and analysis of novel metabolic pathways for the biosynthesis of industrial chemicals: 3-hydroxypropanoate. Biotechnol. Bioeng. 106, 462–473 (2010).
- (17) Bar-Even, A., Flamholz, A., Noor, E. & Milo, R. Rethinking glycolysis: on the biochemical logic of metabolic pathways. Nat. Chem. Biol. 8, 509–517 (2012).
- (18) Ronimus, R. S. & Morgan, H. W. Distribution and phylogenies of enzymes of the embden-meyerhof-parnas pathway from archaea and hyperthermophilic bacteria support a gluconeogenic origin of metabolism. Archaea 1, 199–221 (2002).
- (19) Verhees, C. H. et al. The unique features of glycolytic pathways in archaea. Biochem. J. 375, 231–246 (2003).
- (20) Morowitz, H. J., Kostelnik, J. D., Yang, J. & Cody, G. D. The origin of intermediary metabolism. Proc. Natl Acad. Sci. USA 97, 7704–7708 (2000).
- (21) Morowitz, H. J. A theory of biochemical organization, metabolic pathways, and evolution. Complexity 4, 39–53 (1999).
- (22) Berg, J., Tymoczko, J. & Stryer, L. Biochemistry (W H Freeman and Company, 2002), 5th edn.
- (23) Srinivasan, V. & Morowitz, H. J. Analysis of the intermediary metabolism of a reductive chemoautotroph. Biol. Bull. 217, 222–232 (2009).
- (24) Alberty, R. A. Biochemical Thermodynamics: Applications of Mathematica. Methods of Biochemical Analysis (2006).
- (25) Mavrovouniotis, M. L. Estimation of standard gibbs energy changes of biotransformations. Journal of Biological Chemistry 266, 14440–14445 (1991).
- (26) Mavrovouniotis, M. L. Group contributions for estimating standard gibbs energies of formation of biochemical compounds in aqueous solution. Biotechnology and Bioengineering 36, 1070–1082 (1990).
- (27) Jankowski, M. D., Henry, C. S., Broadbelt, L. J. & Hatzimanikatis, V. Group contribution method for thermodynamic analysis of complex metabolic networks. Biophys. J. 95, 1487 – 1499 (2008).
- (28) S. J. Court, B. W. & Allen, R. J. Supporting information. http://www2.ph.ed.ac.uk/~bwaclaw/suppmatt/Court_et_al_SupInfo.pdf (2014).
- (29) Webb, E. Enzyme nomenclature 1992: recommendations of the Nomenclature Committee of the International Union of Biochemistry and Molecular Biology on the nomenclature and classification of enzymes (Academic Press, San Diego, 1992), 6 edn.
- (30) Albery, J. W. & Knowles, J. R. Evolution of enzyme function and the development of catalytic efficiency. Biochemistry 15, 5631–5640 (1976).
- (31) Heinrich, R. & Hoffmann, E. Kinetic parameters of enzymatic reactions in states of maximal activity; an evolutionary approach. J. theor. Biol 151, 249–283 (1991).
- (32) Berg, J., Hung, Y. P. & Yellen, G. A genetically encoded fluorescent reporter of ATP:ADP ratio. Nat. Methods 6, 161–166 (2009).
- (33) Bennett, B. D. et al. Absolute metabolite concentrations and implied enzyme active site occupancy in escherichia coli. Nat. Chem. Biol. 5, 593–599 (2009).
- (34) http://www.genome.jp/kegg/.
- (35) Cho, J., King, J. S., Qian, X., Harwood, A. J. & Shears, S. B. Dephosphorylation of 2,3-bisphosphoglycerate by MIPP expands the regulatory capacity of the Rapoport-Luebering glycolytic shunt. Proc. Natl Acad. Sci. USA 105, 5998–6003 (2008).
- (36) Varma, A. & Palsson, B. O. Metabolic flux balancing - basic concepts, scientific and practical use. Nat. Biotech. 12, 994–998 (1994).
- (37) Press, W. H., Teukolsky, S. A., Vetterling, W. T. & Flannery, B. P. Numerical Recipes: The Art of Scientific Computing (Cambridge University Press, New York, NY, USA, 2007), 3rd edn.