TreQ-CG: Clustering Accelerates High-Throughput Sequencing Read Mapping
1 Abstract
As high-throughput sequencers become standard equipment outside of sequencing centers, there is an increasing need for efficient methods for pre-processing and primary analysis. While a vast literature proposes methods for HTS data analysis, we argue that significant improvements can still be gained by exploiting expensive pre-processing steps which can be amortized with savings from later stages. We propose a method to accelerate and improve read mapping based on an initial clustering of possibly billions of high-throughput sequencing reads, yielding clusters of high stringency and a high degree of overlap. This clustering improves on the state-of-the-art in running time for small datasets and, for the first time, makes clustering high-coverage human libraries feasible. Given the efficiently computed clusters, only one representative read from each cluster needs to be mapped using a traditional readmapper such as BWA, instead of individually mapping all reads. On human reads, all processing steps, including clustering and mapping, only require 11%–59% of the time for individually mapping all reads, achieving speed-ups for all readmappers, while minimally affecting mapping quality. This accelerates a highly sensitive readmapper such as Stampy to be competitive with a fast readmapper such as BWA on unclustered reads.
Availability:
TreQ-CG is freely available for download at http://bioinformatics.rutgers.edu/Software/TreqCG.
2 Introduction
The amount of data produced by current high-throughput DNA sequencing machines such as Illumina HiSeq 2500, which can generate as much as 100Gb a day, demands enormous computational power for primary analysis tasks such as read mapping. Although a large body of literature is concerned with read mapping [21, 20, 19, 33, 14, 11, 26, 12, 42, 27, 1], most approaches map one read at a time. The order of mapping is arbitrary regardless of similarities between reads which might hint towards the same mapping location. One notable exception is Masai [37], which jointly maps read prefixes using a radix tree, but necessarily has to rely on exact prefix matches. In high coverage libraries, reads originating from the same genomic locus share many bases, which, if processed together, can significantly reduce the computational effort. However, identifying partial overlap in the presence of sequencing errors, which are artifacts of library construction and other experimental errors, is itself a computationally expensive task.
From a computational point of view, read mappers can roughly be divided in two categories: Programs such as BWA [20] are very fast at mapping reads with low edit distance to the reference, but become exponentially slower with increasing edit distance. They often have an internal cut-off to keep running times in check. More sensitive programs, such as Stampy [26], can handle larger edit distance in the presence of a high degree of variation, as found in cancer datasets [35], at the price of being slower in general, typically by one order of magnitude. Interestingly, those two categories roughly correspond to the two sources of edit operations observed in HTS reads: sequencing errors and intergenomic variation. BWA is suitable for mapping reads from loci in the sample genome which are almost identical to the corresponding locus in the reference, and the edit distance is mostly due to a few sequencing errors. However, for the case of larger variation between sample and reference, read mappers such as Stampy are tailored towards large edit distance. In that case, mapping reads individually means the algorithm has to handle the difference between loci in sample and reference as many times as there are reads covering it, which is wasteful. As the difference between the overlapping segments of reads from the same genomic locus is solely due to sequencing errors, their mutual edit distance is usually less than their edit distance to the reference genome in the presence of a high degree of intergenomic variations. Consequently, identifying similar reads that most likely come from the same sample locus and mapping them jointly is faster than individual mapping. Unfortunately, Stampy and other sensitive readmappers do not utilize that observation.
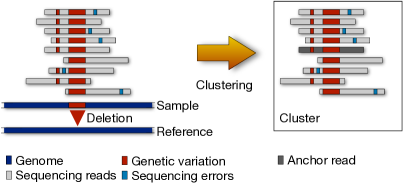
The first step in exploiting the redundancy among reads originating from the same genomic locus is to identify them through clustering. To compute clusters, we use an incremental greedy approach ensuring stringent criteria for cluster membership in terms of overlap length and similarity to the anchor read representing the cluster (see Figure 1). The clustering we use is unusual in two aspects: By design our number of clusters is very large (5-10% of the number of reads) and different clusters can contain reads from the same genomic locus. Both conditions are necessary to minimize mis-mappings due to clustering. Prior works on clustering HTS reads were concerned with detection of clusters in which members either completely or almost fully overlap with a high degree of similarity between them [3, 36, 6]. Relaxing that criterion makes clustering computationally feasible, and it is not detrimental to further analysis as the clusters are not per se focus of the investigation. Assuming that one cluster contains reads sequenced from the same genomic locus, we only map one anchor read per cluster and align other cluster members using a local alignment algorithm. Mapping clusters instead of individual reads speeds up computation irrespective of the readmapper used.
Since clustering large datasets is a fundamental pre-processing step in data analysis, it has been used extensively for many HTS-related problems. For example, in read compression, some tools exploit redundancy among reads to achieve higher compression rate without using a reference genome; e.g., Coil [43] and ReCoil [44] use an approach similar to us for grouping similar reads together before compression. Similar ideas have also been applied to multiple sequence alignment-based error correction tools such as Coral [34] and ECHO [16]. Redundancy removal is another application based on clustering, e.g., SEED [3] shows that removing redundant reads can improve running time, reduce memory requirement and improve de-novo assembly quality. Similarly, for RAD-Seq data, Rainbow [5] shows improved de-novo assembly after clustering. Although many diverse HTS tools exploit sequence redundancy through clustering, there are very few tools that use clustering as a pre-processing step before read mapping. One such tool, FreeClu [32], creates an interesting parent-child tree structure based on read frequency and Hamming distance between reads. They report increased read mapping rate by utilizing the relationship among reads represented as a tree. Unfortunately, their algorithm is not scalable to large datasets, and also restricted to full overlap between reads allowing a Hamming distance of at most one. Another tool, Oculus [40], combines redundancy check and read mapping together in one package. They process one read at a time in a streaming setting, align a previously unseen read using Bowtie, and store results in a hash table, thereby skipping expensive alignment step for redundant reads. Like FreClu, Oculus needs full overlap and, unlike FreClu, requires complete match between reads to declare them redundant. This approach can achieve moderate speed-up for very high coverage RNA-Seq data, but is unlikely to be useful for whole genome sequencing data in presence of sequencing errors. In contrast, we process up to a billion reads in one batch, and allow reads to partially overlap as well as contain mismatches in the overlap (similar in spirit to MSA-based error correction approaches), which leads to significant speed-up in read mapping.
3 Methods
By we denote the read library. We assume all reads to have a fixed length . We also assume to be produced by an Illumina-like sequencing experiment where substitution errors are dominant compared to insertion and deletion (indel) errors. In the following, we discuss how we efficiently cluster and use these clusters to accelerate read mapping.
3.1 Clustering billions of reads for mapping
Our two main design goals for the clustering are computational efficiency and stringency with respect to assigning reads from the same genomic locus to one cluster. Stringency and the size of the data imply large number of clusters, which precludes the use of iterative clustering methods. Note that the clusters themselves are not the focus of investigation, but rather a computational aid. Consequently, we allow reads from the same locus to be assigned to distinct clusters. We propose the following greedy approach based on shared -mers for clustering reads.
3.1.1 Clustering single-end reads
Given two reads and with a prefix-suffix overlap of length , where number of bases match, we say that they have an overlap of length with similarity . If and ( and are constants), we assume and are sufficiently similar to be member of the same cluster. Clusters are represented by their anchor reads (in contrast to centroids in -means clusters’ anchors remain fixed) and reads, which are sufficiently similar to the anchors, are greedily assigned to the clusters (Figure 1). If a read of sufficient quality—i.e., not a bad read as defined in the following—fails to find a sufficiently similar anchor it becomes an anchor read itself and thus forms a new cluster.
Specifically, we create a set of anchor reads and an array of lists , where stores pointers to the anchor reads that contain the -mer (note that there is a one-to-one relation between -mers and bit numbers), and perform the following steps for each read in the library.
-
1.
A base is defined as a bad base if it is ambiguous (represented by ’N’) or it has Phred score below the threshold . If there are too many bad bases uniformly distributed in we call a bad read and discard it from clustering. In particular, we discard if
-
•
and are the first and last non-bad bases respectively, and , or
-
•
the maximum length of a contiguous sub-sequence containing no bad base is less than .
-
•
-
2.
For each -mer in , we
-
(a)
compute the corresponding -bit integer representation and get the list of anchor reads that share the same -mer from .
-
(b)
For each anchor read in , whose content is already stored in , if and has a prefix-suffix overlap of at least bases respecting the position of the shared -mer, we compute similarity between and in the overlapped region.
-
(c)
If at least number of bases match in the overlapped region, we declare as a member of the cluster formed around the anchor read and halt further computation for .
-
(d)
Otherwise, we proceed with the next -mer.
-
(a)
-
3.
If fails to be assigned to any cluster, it qualifies to be an anchor read and forms it’s own cluster. We store in the set of anchor reads and for every -mer present in ’s -length prefix and suffix we insert a record in .
3.1.2 Clustering paired-end reads
Although clustering a paired-end read library in single-end mode is acceptable for many applications, for paired-end read mapping it is necessary to take pairing information into account. Unlike single-end clustering, where we consider one read at a time, in paired-end clustering, we process a pair of reads simultaneously and do not allow one end of a pair to be anchor read and the other end to be non-anchor read. This constraint lets us map anchor reads in paired-end mode using a traditional readmapper. If the constraint is violated for a pair and , where, lets say, is an anchor read but is not, we resolve it in the following order.
-
1.
If is a bad read, we force it to be an anchor read and form a new cluster.
-
2.
If is a member of the cluster formed by anchor read , whose other end is another anchor read , we try to find a prefix-suffix overlap of length between and where bases match (since already provides some evidence for this choice we relax the overlap length restriction from to ). If such an overlap is found we force to be a member of .
-
3.
Otherwise, is forced to be an anchor read and form a new cluster.
3.1.3 Optimal cluster assignment
The above procedure partitions the read library into three sets; bad reads, anchor reads and member reads. Since not all anchor reads were known before the completion of the first phase, we defer final cluster assignment to the second phase of the algorithm. In particular, for each member read with an overlap of length with it’s current cluster’s anchor read, we try to change the assigned cluster by finding another anchor read with an overlap . We perform this by running only step 2 from the single-end algorithm and modifying step 2.c to find the best possible cluster assignment.
3.1.4 Sub-optimal cluster assignment for repeat resolution
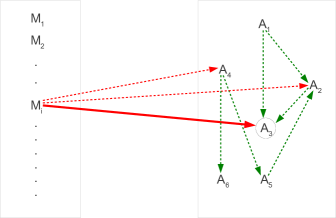
Another crucial aspect to take into consideration is the complexity of the underlying genome from which sequencing reads originate. Because of the non-uniformity and repetitiveness present in the genome, sub-optimal cluster assignments are sometimes preferred. Towards this goal, in the second phase, along with the cluster with highest overlap, we also store at most number of sub-optimal (allowing ) cluster assignments for each member read (red dotted arrows in Figure 2). We take this idea further and, for an anchor read, store at most number of similar anchor reads by modifying the first phase of the algorithm (green dotted arrows in Figure 2). Storing these two kinds of sub-optimal choices can be very useful in resolving ambiguity and repeats in read mapping.
3.1.5 Practical Considerations
Even our greedy two stage clustering strategy can become infeasible already for one billion reads. We have carefully taken some decisions and made some parameter choices to keep the clustering process feasible. In particular, smaller values of increase sensitivity but require more computational resources due to more frequent -mer hits. Since our cluster definition is comparatively relaxed, a large , in this case 15, is suitable for read libraries with few sequencing errors such as Illumina’s. Additionally, we have made the following choices: One, we ignore indels introduced by sequencing and perform a Hamming distance computation on the overlap between two reads only if they share at least two -mers, which decreases the probability of spurious hits due to the choice of and the presence of sequencing errors; two, since overlapping -mers in a read are not independent and, hence, considering all -mers increases computational demand without significant improvement in optimal cluster assignment, in the second phase, we abandon the search for best cluster assignment after considering equally spaced -mers from the read; three, since frequent -mers are less informative, the size of the list , storing the anchor reads containing , is restricted to 256; four, we restrict the number of sub-optimal choices to 16 and to 256 and store them in external memory; finally, we set , and , which restricts the allowed read length to be at least 31 and guarantees that the clustering algorithm can overcome at least one error in the overlap. See supplement for a detailed discussion on choosing parameters and .
3.1.6 Running time and memory usage
For each of the reads of length in the library, the clustering process computes Hamming distance between the read and potential anchor reads found using shared -mers. Consequently, the running time complexity of the algorithm is . Due to the practical choices from the previous section, in practice, the total running time is not quadratic in , and the average running time is approximately . For space complexity, lets assume the clustering algorithm finds clusters, where . In that case, the set of 2-bit encoded anchor reads needs bytes, the array of lists needs bytes and cluster membership information takes bytes. Thus, the total amount of space required by these three objects is . Including other overhead, specially for multi-threading support, a -bp billion human read dataset, where () for single-end (paired-end), requires GB (GB) memory. If the read sequences were error free, we would need significantly less amount of memory since would be . But, unfortunately, HTS libraries contain frequent sequencing errors, and hence, this large space requirement is unavoidable for de-novo clustering.
3.2 Mapping clusters
In resequencing experiments the first step in the analysis typically is mapping reads to a reference genome. The choice of a tool depends on the biological question under investigation, the expected genetic variation between sample and reference genome and the computational resources available. The tools roughly fall into two categories: fast read-mappers which trade losses in mapping reads for speed such as SOAP2 [21], Bowtie 2 [18] or BWA [20] or highly-sensitive, but much slower tools such as mrFAST [2], RazerS [41], LAST [7], Novoalign (http://www.novocraft.com) or Stampy [26]. We will show how we accelerate read mapping based on the clustering irrespective of the readmapper used.
Our clustering algorithm works under the assumption that members of a cluster originate from the same genomic locus in the sample genome. We exploit this assumption by mapping the anchors in single-end or paired-end mode to a reference genome and subsequently use the information about the mapped position of the anchor read to find good mappings for member reads. As a result the running time complexity of read mapping reduces to the proportion of clusters found; in practice we need more time as the cost of mapping a single read varies considerably. Although we can find more than one location for non-unique, repetitive reads using multiple hits for the anchor reads and utilizing sub-optimal cluster choices, in this study, for a suitable comparison between clustered vs. individual read mapping, we only report single best hits for reads. Specifically, given the read library we perform the following steps to compute the read alignments assuming fixed costs , , , and for nucleotide match, mismatch, gap open, and gap extension.
-
1.
Identify the anchor reads and map them in single best mode using a readmapper. Report the alignments in a SAM file .
-
2.
Extract mapping information of the anchor reads from .
-
3.
For each read in ,
-
(a)
If is an anchor read, do nothing.
-
(b)
If is a bad read, report the read as unmapped in .
-
(c)
If is a member read,
-
•
we use the overlap information between anchor read and member read to identify the genomic position from where the member read may have originated, and compute Hamming distance.
-
•
If the total cost of mismatches from previous step is greater than a single gap opening cost (for the tested datasets it happens for approximately 30% of the reads) we run the Smith-Waterman algorithm [38] to find the best local alignment between the read and the mapped position of the anchor in the genome ( bases). We use a modified version of a SSE based library [46] for Smith-Waterman computation.
-
•
We repeat the above two steps for the sub-optimal cluster choices (Figure 2). In particular, we increase the search space by following a path, through the dotted red and green links, of length at most two, from the member read to the anchor reads.
-
•
If the best alignment has score less than min_score (default ) we report the read as unmapped. Otherwise, we append the alignment information at the end of file .
-
•
For paired-end reads, if pairs are concordant we do nothing. For discordant pairs, we use one end’s mapping information to find a better alignment for the other end before reporting them in .
-
•
-
(a)
Since readmappers often use different kinds of alignments — choice varies among local, global, and semi-global alignment, score values, heuristics, and strategies to improve paired-end mapping, it is difficult to select an universal set of criteria which is good for all. The differences in choices and heuristics used give them distinguishing characteristics which is often desirable by downstream analysis tools. We believe that the choices we have made here are not necessarily the best for every readmapper, and it makes sense to have different clustered mapper for different readmappers. However, we will not pursue that direction in this article.
4 Results and discussion
We have selected four datasets to analyze our method.
-
•
SIM: 2 million simulated 100bp paired-end reads (mean insert length 300 and standard deviation 30) simulated with a coverage of 50x obtained with the popular read simulator ART [15] from human chromosome 17 (from the 10Mbp to 14Mbp region) after artificially introducing SNPs (SIM-SNP) and inserting indels (SIM-INDEL).
-
•
ECOL: 21 million 36bp paired-end E. coli reads (SRX000429) with a coverage of 160x at a genome size of 5Mb. We estimated the insert length to be 215bp with a standard deviation of 10bp.
-
•
DROS: 48 million 76bp paired-end Drosophila reads (SRR097732) [17] with a coverage of 29x at a genome size of 120Mb. We estimated the insert length to be 320bp with a standard deviation of 18bp.
-
•
YOR: 1.46 billion 100bp paired-end Illumina reads of a Yoruba individual (ERA015743) (HapMap: NA18507) with a coverage of 46x at a genome size of 3.2Gb. We estimated the insert length to be 310bp with a standard deviation of 20bp.
For all datasets we use and . The experiments are performed on a Linux machine with 48 AMD Opteron cores clocked at 2.2 GHz and 256GB memory. Whenever possible, in particular for multi-threaded tools, 22-24 cores were assigned, and for both multithreaded and non-multi-threaded programs total system time is reported.
In the following, we will show the effectiveness of our clustering algorithm and the benefits of using clusters in read mapping. We will also discuss how the characteristics of the read library affect performance and parameter choices.
4.1 Clustering performance
Since clustering is a fundamental technique for large data analysis, many tools have been developed in the past for biological data; i.e. for protein clustering [30, 25, 23], meta-genomics [28, 10, 45, 24], and expressed sequence tags (ESTs) [29, 4, 31, 13]. Recently, there is a trend of developing alignment-based (for alignment-free clustering see [39]) fast clustering tools for very large HTS data sets; among these, CD-HIT [8], DNACLUST [9], UCLUST [6] and SEED [3] are prominent. These four tools use greedy incremental approaches and apply heuristics to accelerate clustering (our clustering algorithm also belongs to this group). Except DNACLUST, which uses a suffix array, these tools also use some kind of hash/seed based data structure. Among them, SEED [3] has been identified as the state-of-the-art in read clustering. Although it can cluster up to tens of millions of reads given enough time and memory, SEED, and other tools, are still not very attractive as a pre-processing step before read mapping. There are two reasons behind that: First, they require highly overlapping reads, usually , and, in some cases, high similarity in the overlap, which results in a large number of clusters; Second, their algorithms and data structures are not designed to process billions of reads. While large overlap is absolutely necessary for very short reads (say bp), for moderate to large sized reads (say bp), is sufficient for declaring two reads similar for read mapping purpose since per base error rate for Illumina reads are small. To overcome these difficulties, and to support particular requirements of read mapping, such as paired-end support and sub-optimal cluster choices, we have designed our own clustering algorithm TreQ-CG. As a representative of the fast clustering tools (see [22] for a set of examples) we have selected UCLUST and SEED, and compared their performance with TreQ-CG (Table 1). We indirectly measure the quality of the produced clusters by using them for read mapping in a later step. Among the two tools in consideration, only SEED allows non-overlapping bases (at most 6 bases can be excluded), and it allows at most 3 mismatches in an overlap which corresponds to parameters , and for ECOL, DROS and YOR respectively. On the other hand, UCLUST allows a flexible but it does not allow users to select . Compared to them, TreQ-CG allows both parameters to be modified. Taking these differences into consideration we have selected three set of parameters for comparison: allows UCLUST to run with smallest possible allowed by SEED, allows smallest possible and allowed by SEED, and is the parameter set used by TreQ-CG for subsequent analysis.
Along with memory requirement and running time, our primary criteria for evaluating clustering tools is the number of clusters produced, which is normalized as . Since SEED depends on large overlap between reads, it produces clusters for DROS in hours and does not complete on the YOR dataset. On the other hand, UCLUST’s use of full overlap and gapped alignment makes it very slow on large datasets. It takes 52 hours on the ECOL dataset but on the larger datasets it did not complete in one week. In comparison, TreQ-CG works with a wide range of parameter choices in both single-end and paired-end mode, produces fewer clusters, and runs faster than SEED. Additionally, for parameter set , TreQ-CG discards , , and reads as bad reads in single-end mode, and , , and reads in paired-end mode. The clusters produced by SEED and other clustering tools on smaller datasets such as ECOL are useful for other applications, for example in meta-genomics. But unless they support smaller overlap length, which is difficult for their particular choice of data structures and algorithms, they will not be attractive choices for pre-processing reads before read mapping. We do not consider them for subsequent analysis in the following section.
| Dataset | Parameters | Program | Time | Memory | Clusters |
| (h:mm) | (GB) | () | |||
| ECOL | UCLUST | 52:07 | 2 | 17.47 | |
| SEED | 0:32 | 12 | 38.97 | ||
| TreQ-CG (S.E.) | 0:24 | 17 | 23.86 | ||
| TreQ-CG (P.E.) | 0:30 | 17 | 31.21 | ||
| UCLUST | — | — | — | ||
| SEED | 0:27 | 11 | 5.71 | ||
| TreQ-CG (S.E.) | 0:12 | 16 | 4.07 | ||
| TreQ-CG (P.E.) | 0:13 | 16 | 5.14 | ||
| UCLUST | — | — | — | ||
| SEED | 0:30 | 11 | 7:30 | ||
| TreQ-CG (S.E.) | 0:14 | 16 | 7.30 | ||
| TreQ-CG (P.E.) | 0:15 | 16 | 8.57 | ||
| DROS | UCLUST | — | — | — | |
| SEED | 3:22 | 25 | 75.97 | ||
| TreQ-CG (S.E.) | 3:36 | 34 | 70.34 | ||
| TreQ-CG (P.E.) | 4:02 | 35 | 76.73 | ||
| UCLUST | — | — | — | ||
| SEED | 7:56 | 25 | 37.79 | ||
| TreQ-CG (S.E.) | 2:00 | 23 | 24.50 | ||
| TreQ-CG (P.E.) | 2:30 | 24 | 30.09 | ||
| UCLUST, SEED | — | — | — | ||
| TreQ-CG (S.E.) | 1:09 | 20 | 7.29 | ||
| TreQ-CG (P.E.) | 1:18 | 20 | 9.18 | ||
| YOR | UCLUST, SEED | — | — | — | |
| TreQ-CG | |||||
| UCLUST, SEED | — | — | — | ||
| TreQ-CG (S.E.) | 197:35 | 196 | 29.45 | ||
| TreQ-CG (P.E.) | — | — | — | ||
| UCLUST, SEED | — | — | — | ||
| TreQ-CG (S.E.) | 107:52 | 76 | 7.48 | ||
| TreQ-CG (P.E.) | 133:22 | 91 | 10.90 |
4.2 Read mapping performance
On biological datasets there is no ground truth available for deciding whether a read is mapped correctly. There are also differences—in particular for low-quality reads and in presence of genetic variations—in mapping performance between individual readmappers, and likewise we expect some differences between clustered mapping and individual mapping even with the same readmapper.
We compare clustered and individual mapping for Bowtie 2 [18] version 2.1.10, BWA [20] version 0.5.9, Novoalign (http://www.novocraft.com/) version 2.07.13 and Stampy [26] version 1.0.19. All mappers, chosen because they are widely used and implement different algorithmic approaches, were run with default parameters except forcing reporting of a single best hit. We expect other readmappers, specially highly sensitive computationally intensive ones, to benefit from clustered approach and their overall performance to follow the performance of the readmappers chosen for comparison.
Including clustering time, clustered read mapping achieves a speed-up compared to the time of mapping individual reads for all readmappers tested, see Table 2 for single-end reads and supplementary Table S.1 for paired-end reads. The speed-up ranges from 8.9 using Stampy on YOR to 1.4 using Novoalign on ECOL. One would expect that the time needed for mapping anchor reads should be proportional to the number of anchors. But in practice, reads with high sequencing errors form singleton clusters (that is a cluster without any member except the anchor read) and read mappers take more time to map these reads. As a result the speed-up is not exactly proportional to the number of clusters. Still, due to the achieved speed-up, the use of sensitive readmappers like Stampy becomes computationally as feasible as running BWA.
For qualitative assessment of clustered read mapping we use the following three metrics.
-
•
Accuracy. Since the true originating position of a read is known for simulated data, we define accuracy as the proportion of reads that map within bases of the true position [12]. We do not require a strict match because there can be ambiguity in the starting position of the optimal alignment due to the presence of gaps and exact alignment parameters.
-
•
Alternate mapping rate. Since the ground truth is not known for biological data, we compute alternate mapping rate between individual mapping and clustered mapping. Alternate mapping rate is defined as the percentage of reads for which either both approaches report mapping positions not within bases of each other, or one approach maps the read while the other fails. This essentially measures how well the clustered read mapping recreates the exact output of the individual read mapping.
-
•
Concordance. For biological data, another important measure is concordance of read pairs. We define it as the proportion of read pairs for which the estimated insert size is within the mean insert length of the library, allowing for standard deviation. It has been argued in the literature [26] that the concordance of paired-end reads mapped in single-end mode provides an indirect measure of mapping accuracy.
4.2.1 Simulated Data
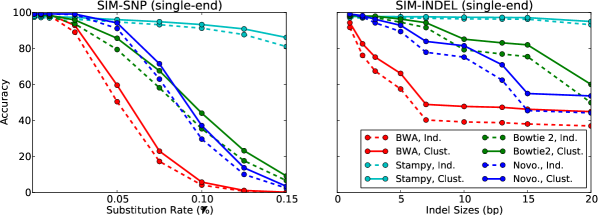
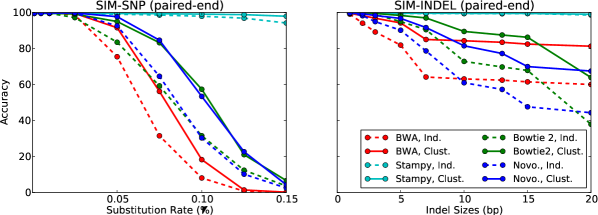
We have tested the effect of SNPs and indels on single-end and paired-end clustered mapping; the results are reported in Figure 4 (single-end) and S.1 (paired-end). For SIM-SNP we have modified the sample genome with substitution rate ranging from 0.001 to 0.15 while allowing no indels. For SIM-Indel we have inserted indels of a particular size with an indel rate of 0.01 per base. For each SNP and indel size configuration we have sequenced 2 million reads using the read simulator ART, which applies Illumina-specific sequencing errors on top of the genetic variations present in the artificial sample genome. Since indels are randomly placed in the sample genome before sequencing, approximately 40% reads in the SIM-Indel dataset do not contain any indel. As expected, Stampy’s performance stays excellent for the range of variations tested but others do not perform well in presence of high genetic variation. In case of Stampy, clustered mapping closely follows individual mapping. On the other hand, clustered mapping performs better than individual BWA, Bowtie 2, and Novoalign. To gain efficiency these readmappers limit their mapping process through limited edit distance or score cutoff. In contrast, clustered mapping is more permissive due to low score cutoff (default ).
4.2.2 Biological Data
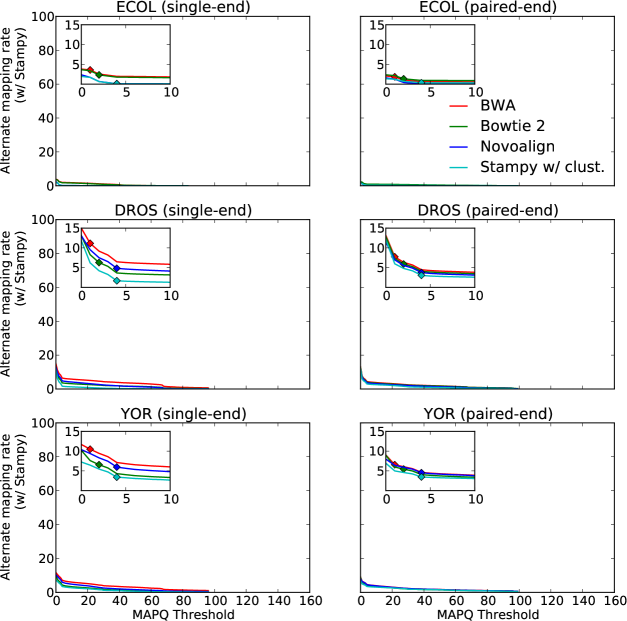
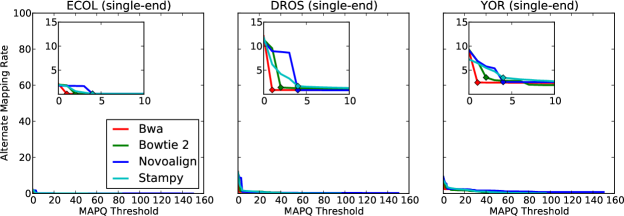
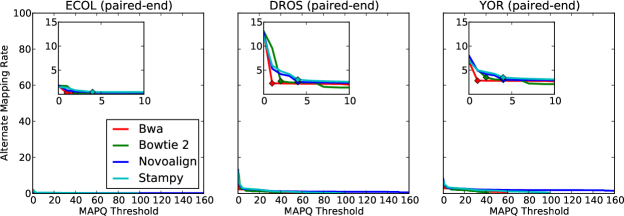
It is reasonable to expect that the reads mapped with low alignment quality are those which should cause the most differences between clustered and individual mapping, and consequently influence the accuracy measures. We use the MAPQ value reported in the SAM file, where higher value indicates higher confidence in a particular alignment, as thresholds to limit the read alignments considered to compute alternate mapping rate. In practice, along with unmapped reads (reported with default MAPQ value 0), low quality alignments are frequently excluded from downstream analysis. Following [20], we select MAPQ value of 1 and 2 for BWA and Bowtie 2 respectively, and 4 for Novoalign and Stampy, as a cutoff to report alternate mapping rate in Table 2 and Table S.1. Alternate mapping rates computed using different values of MAPQ threshold are reported in Fig. 5 and Fig. S.2. We also report concordance of reads mapped in Table 2 and Table S.1.
From Figure 5 we observe that the alternate mapping rate among all reads above a MAPQ threshold strictly decreases as a function of the threshold and eventually drops below 1%. At the selected MAPQ thresholds, depending on the readmapper used, clustered mapping reports alternate mapping for about 0–1%, 1–3%, and 2–4% reads for ECOL, DROS and YOR datasets respectively. Compared to single-end reads, there is an 1-2% increase in alternate mapping rate for paired-end mode (see Table S.1). The observations are consistent with alternate mapping rates when comparing two different readmappers and are largely explained by differences in alignment parameters (see Fig. S.4). As for concordance of single-end reads in clustered approach, there is a small gain in concordance for ECOL and DROS, and a small loss in concordance for YOR (Table 2). On the other hand, for paired-end reads, except for ECOL dataset, there is always a gain in concordance, which is mostly due to altering mapping locations based on pairing information (see Table S.1). Increase in alternate mapping rate and gain in concordance for paired-end reads indicates that our paired-end mapping might be too permissive compared to what is allowed by an individual readmapper.
| Dataset (single- end) | Mapper | Memory (GB) | Time (hh:mm) | Speed-up | Mapping quality | ||||||
|---|---|---|---|---|---|---|---|---|---|---|---|
| Individual mapping | TreQ-CG | Individual mapping | TreQ-CG | Alternate mapping rate | Concordance | ||||||
| Clust. | Map. | Clust. | Map. | Ind. | Clust. | ||||||
| ECOL | BWA | 0.1 | 16 | 0.9 | 0:49 | 0:14 | 0:12 | 1.9 | 0.06 | 92.93 | 93.44 |
| Bowtie 2 | 0.3 | 0.9 | 0:43 | 0:13 | 1.6 | 0.06 | 93.41 | 93.64 | |||
| Novoalign | 0.0 | 1.0 | 0:38 | 0:14 | 1.4 | 0.10 | 96.59 | 96.80 | |||
| Stampy | 0.0 | 1.0 | 4:17 | 0:28 | 6.1 | 0.08 | 96.23 | 96.19 | |||
| DROS | BWA | 0.3 | 20 | 1.4 | 3:29 | 1:09 | 0:49 | 1.8 | 0.88 | 71.02 | 72.07 |
| Bowtie 2 | 0.4 | 1.4 | 2:53 | 0:39 | 1.6 | 1.41 | 74.82 | 73.87 | |||
| Novoalign | 0.6 | 1.4 | 6:19 | 1:09 | 2.8 | 0.85 | 71.20 | 73.87 | |||
| Stampy | 0.3 | 1.4 | 28:08 | 2:59 | 6.8 | 1.68 | 74.06 | 74.31 | |||
| YOR | BWA | 5.0 | 76 | 8.3 | 477:30 | 107:52 | 157:29 | 1.8 | 2.43 | 78.43 | 77.54 |
| Bowtie 2 | 3.5 | 8.2 | 307:45 | 75:04 | 1.7 | 3.47 | 82.38 | 79.75 | |||
| Novoalign | 7.8 | 8.3 | 714:07 | 230:47 | 2.1 | 2.55 | 79.40 | 78.24 | |||
| Stampy | 2.7 | 8.2 | 3203:39 | 251:40 | 8.9 | 3.43 | 80.51 | 78.87 | |||
5 Conclusions
We propose to cluster high-throughput sequencing reads as a first step in the analysis and show, as a proof of concept, that our greedy clustering algorithm accelerates read mapping. We observe speed-ups for all readmappers tested ranging from 1.4 to 8.9 with very little alternate mapping between individual and clustered mapping for high-quality reads, and low level of alternate mapping rate for all reads with a small loss in concordance for some datasets. We do expect even more favorable results for read mapping if there is a lot of genetic variation in the sample genome, such as in cancer datasets, or the evolutionary distance between sample and reference genome is large.
There are several areas in which the method can be improved, the most important ones being cluster quality and size, as running time is inversely proportional to the total number of clusters. It seems reasonable that the singleton clusters (that is a cluster with cardinality one, which arises either due to high sequencing error or very low coverage) can be reduced by additional passes, possibly with a smaller value of for k-mers. The additional effort in clustering is very likely to be made up in mapping, by net savings in running time. So far read mapping is performed with anchor reads without any post-processing. An obvious improvement can be made by considering clusters as an instance of multiple sequence alignment problem, and correcting errors using the alignment information. Moreover, computing an elongated consensus sequence and using it instead of the anchor read is also desirable. However, one has to judiciously choose, based on coverage and within cluster sequence variation, the actual fragment of the consensus to use for mapping to see further improvements.
References
- [1] A. Ahmadi, A. Behm, N. Honnalli, C. Li, L. Weng, and X. Xie. Hobbes: optimized gram-based methods for efficient read alignment. Nucleic Acids Research, 40(6):e41, 2012.
- [2] C. Alkan, J. M. Kidd, T. Marques-Bonet, G. Aksay, F. Antonacci, F. Hormozdiari, J. O. Kitzman, C. Baker, M. Malig, O. Mutlu, S. C. Sahinalp, R. A. Gibbs, and E. E. Eichler. Personalized copy number and segmental duplication maps using next-generation sequencing. Nat Genet, 41(10):1061–1067, Oct. 2009.
- [3] E. Bao, T. Jiang, I. Kaloshian, and T. Girke. SEED: efficient clustering of next-generation sequences. Bioinformatics, 27(18):2502–2509, Sept. 2011.
- [4] J. Burke, D. Davison, and W. Hide. d2 cluster: A validated method for clustering est and full-length cdna sequences. Genome Research, 9(11):1135–1142, 1999.
- [5] Z. Chong, J. Ruan, and C.-I. Wu. Rainbow: an integrated tool for efficient clustering and assembling rad-seq reads. Bioinformatics, 28(21):2732–2737, 2012.
- [6] R. C. Edgar. Search and clustering orders of magnitude faster than blast. Bioinformatics, 26(19):2460–2461, 2010.
- [7] M. C. Frith, R. Wan, and P. Horton. Incorporating sequence quality data into alignment improves dna read mapping. Nucleic Acids Research, 38(7):e100, 2010.
- [8] L. Fu, B. Niu, Z. Zhu, S. Wu, and W. Li. Cd-hit: accelerated for clustering the next-generation sequencing data. Bioinformatics, 28(23):3150–3152, 2012.
- [9] M. Ghodsi, B. Liu, and M. Pop. Dnaclust: accurate and efficient clustering of phylogenetic marker genes. BMC Bioinformatics, 12(1):271, 2011.
- [10] J. A. Gilbert, D. Field, Y. Huang, R. Edwards, W. Li, P. Gilna, and I. Joint. Detection of large numbers of novel sequences in the metatranscriptomes of complex marine microbial communities. PLoS ONE, 3(8):e3042, 08 2008.
- [11] F. Hach, F. Hormozdiari, C. Alkan, F. Hormozdiari, I. Birol, E. E. Eichler, and S. C. Sahinalp. mrsFAST: a cache-oblivious algorithm for short-read mapping. Nature Methods, 7(8):576–577, Aug. 2010.
- [12] M. Hamada, E. Wijaya, M. C. Frith, and K. Asai. Probabilistic alignments with quality scores: an application to short-read mapping toward accurate SNP/indel detection. Bioinformatics, 27(22):3085–3092, Nov. 2011.
- [13] S. Hazelhurst and Z. Lipták. Kaboom! a new suffix array based algorithm for clustering expression data. Bioinformatics, 27(24):3348–3355, 2011.
- [14] S. Hoffmann, C. Otto, S. Kurtz, C. M. Sharma, P. Khaitovich, J. Vogel, P. F. Stadler, and J. Hackermüller. Fast mapping of short sequences with mismatches, insertions and deletions using index structures. PLoS Computational Biology, 5(9):e1000502, Sept. 2009.
- [15] W. Huang, L. Li, J. R. Myers, and G. T. Marth. Art: a next-generation sequencing read simulator. Bioinformatics, 28(4):593–594, 2012.
- [16] W.-C. Kao, A. H. Chan, and Y. S. Song. ECHO: A reference-free short-read error correction algorithm. Genome Research, 21(7):1181–1192, July 2011.
- [17] C. H. Langley, M. Crepeau, C. Cardeno, R. Corbett-Detig, and K. Stevens. Circumventing heterozygosity: Sequencing the amplified genome of a single haploid drosophila melanogaster embryo. Genetics, 188(2):239–246, 2011.
- [18] B. Langmead and S. L. Salzberg. Fast gapped-read alignment with Bowtie 2. Nat Methods, 9(4):357–359, Apr 2012.
- [19] B. Langmead, C. Trapnell, M. Pop, and S. L. Salzberg. Ultrafast and memory-efficient alignment of short DNA sequences to the human genome. Genome Biol, 10(3):R25, 2009.
- [20] H. Li and R. Durbin. Fast and accurate short read alignment with burrows–wheeler transform. Bioinformatics, 25(14):1754–1760, 2009.
- [21] R. Li, C. Yu, Y. Li, T.-W. Lam, S.-M. Yiu, K. Kristiansen, and J. Wang. Soap2: an improved ultrafast tool for short read alignment. Bioinformatics, 25(15):1966–1967, 2009.
- [22] W. Li, L. Fu, B. Niu, S. Wu, and J. Wooley. Ultrafast clustering algorithms for metagenomic sequence analysis. Briefings in Bioinformatics, 13(6):656–668, Nov. 2012.
- [23] W. Li and A. Godzik. Cd-hit: a fast program for clustering and comparing large sets of protein or nucleotide sequences. Bioinformatics, 22(13):1658–1659, 2006.
- [24] W. Li, J. C. Wooley, and A. Godzik. Probing metagenomics by rapid cluster analysis of very large datasets. PLoS ONE, 3(10):e3375, 10 2008.
- [25] Y. Loewenstein, E. Portugaly, M. Fromer, and M. Linial. Efficient algorithms for accurate hierarchical clustering of huge datasets: tackling the entire protein space. Bioinformatics, 24(13):i41–i49, 2008.
- [26] G. Lunter and M. Goodson. Stampy: a statistical algorithm for sensitive and fast mapping of Illumina sequence reads. Genome Res, 21(6):936–939, Jun 2011.
- [27] M. P. Mahmud, J. Wiedenhoeft, and A. Schliep. Indel-tolerant read mapping with trinucleotide frequencies using cache-oblivious kd-trees. Bioinformatics, 28(18):i325–i332, Sept. 2012.
- [28] B. Niu, L. Fu, S. Sun, and W. Li. Artificial and natural duplicates in pyrosequencing reads of metagenomic data. BMC Bioinformatics, 11(1):187, 2010.
- [29] G. Pertea, X. Huang, F. Liang, V. Antonescu, R. Sultana, S. Karamycheva, Y. Lee, J. White, F. Cheung, B. Parvizi, J. Tsai, and J. Quackenbush. Tigr gene indices clustering tools (tgicl): a software system for fast clustering of large est datasets. Bioinformatics, 19(5):651–652, 2003.
- [30] P. Pipenbacher, A. Schliep, S. Schneckener, A. Schönhuth, D. Schomburg, and R. Schrader. Proclust: improved clustering of protein sequences with an extended graph-based approach. Bioinformatics, 18(suppl 2):S182–S191, 2002.
- [31] A. Ptitsyn and W. Hide. Clu: A new algorithm for est clustering. BMC Bioinformatics, 6(Suppl 2):S3, 2005.
- [32] W. Qu, S.-i. Hashimoto, and S. Morishita. Efficient frequency-based de novo short-read clustering for error trimming in next-generation sequencing. Genome Research, 19(7):1309–1315, 2009.
- [33] S. M. Rumble, P. Lacroute, A. V. Dalca, M. Fiume, A. Sidow, and M. Brudno. SHRiMP: accurate mapping of short color-space reads. PLoS Computational Biology, 5(5):e1000386, May 2009.
- [34] L. Salmela and J. Schröder. Correcting errors in short reads by multiple alignments. Bioinformatics, 27(11):1455–1461, June 2011.
- [35] S. P. Shah, A. Roth, R. Goya, A. Oloumi, G. Ha, Y. Zhao, G. Turashvili, J. Ding, K. Tse, G. Haffari, A. Bashashati, L. M. Prentice, J. Khattra, A. Burleigh, D. Yap, V. Bernard, A. McPherson, K. Shumansky, A. Crisan, R. Giuliany, A. Heravi-Moussavi, J. Rosner, D. Lai, I. Birol, R. Varhol, A. Tam, N. Dhalla, T. Zeng, K. Ma, S. K. Chan, M. Griffith, A. Moradian, S. W. G. Cheng, G. B. Morin, P. Watson, K. Gelmon, S. Chia, S.-F. Chin, C. Curtis, O. M. Rueda, P. D. Pharoah, S. Damaraju, J. Mackey, K. Hoon, T. Harkins, V. Tadigotla, M. Sigaroudinia, P. Gascard, T. Tlsty, J. F. Costello, I. M. Meyer, C. J. Eaves, W. W. Wasserman, S. Jones, D. Huntsman, M. Hirst, C. Caldas, M. A. Marra, and S. Aparicio. The clonal and mutational evolution spectrum of primary triple-negative breast cancers. Nature, 486(7403):395–399, June 2012.
- [36] K. Shimizu and K. Tsuda. SlideSort: all pairs similarity search for short reads. Bioinformatics, 27(4):464–470, Feb. 2011.
- [37] E. Siragusa, D. Weese, and K. Reinert. Fast and accurate read mapping with approximate seeds and multiple backtracking. Nucleic acids research, 41(7):e78, Apr. 2013.
- [38] T. Smith and M. Waterman. Identification of common molecular subsequences. Journal of Molecular Biology, 147(1):195 – 197, 1981.
- [39] A. Solovyov and W. Lipkin. Centroid based clustering of high throughput sequencing reads based on n-mer counts. BMC Bioinformatics, 14(1):268, 2013.
- [40] B. Veeneman, M. Iyer, and A. Chinnaiyan. Oculus: faster sequence alignment by streaming read compression. BMC Bioinformatics, 13(1):297, 2012.
- [41] D. Weese, A.-K. Emde, T. Rausch, A. Döring, and K. Reinert. Razers fast read mapping with sensitivity control. Genome Research, 19(9):1646–1654, 2009.
- [42] D. Weese, M. Holtgrewe, and K. Reinert. RazerS 3: faster, fully sensitive read mapping. Bioinformatics, 28(20):2592–2599, Oct. 2012.
- [43] W. T. White and M. Hendy. Compressing dna sequence databases with coil. BMC Bioinformatics, 9(1):242, 2008.
- [44] V. Yanovsky. Recoil - an algorithm for compression of extremely large datasets of dna data. Algorithms for Molecular Biology, 6(1):23, 2011.
- [45] S. Yooseph, G. Sutton, D. B. Rusch, A. L. Halpern, S. J. Williamson, K. Remington, J. A. Eisen, K. B. Heidelberg, G. Manning, W. Li, L. Jaroszewski, P. Cieplak, C. S. Miller, H. Li, S. T. Mashiyama, M. P. Joachimiak, C. van Belle, J.-M. Chandonia, D. A. Soergel, Y. Zhai, K. Natarajan, S. Lee, B. J. Raphael, V. Bafna, R. Friedman, S. E. Brenner, A. Godzik, D. Eisenberg, J. E. Dixon, S. S. Taylor, R. L. Strausberg, M. Frazier, and J. C. Venter. The ¡italic¿sorcerer ii¡/italic¿ global ocean sampling expedition: Expanding the universe of protein families. PLoS Biol, 5(3):e16, 03 2007.
- [46] M. Zhao, W.-P. Lee, E. Garrison, and G. T. Marth. SSW Library: An SIMD Smith-Waterman C/C++ Library for Use in Genomic Applications. CoRR, abs/1208.6350v2, 2013.
Appendix
Results for paired-end datasets
Accuracy of mapping simulated paired-end reads between individual and clustered approach is shown in Fig. S.1. Running time, memory requirement and mapping quality of individual and clustered paired-end read mapping are reported in Table S.1. Read mapping agreement is shown in Fig. S.2 as a function of MAPQ threshold.
| Dataset (paired- end) | Mapper | Memory (GB) | Time (hh:mm) | Speed-up | Mapping quality | ||||||
|---|---|---|---|---|---|---|---|---|---|---|---|
| Individual mapping | TreQ-CG | Individual mapping | TreQ-CG | Alternate mapping rate | Concordance | ||||||
| Clust. | Map. | Clust. | Map. | Ind. | Clust. | ||||||
| ECOL | BWA | 0.2 | 16 | 0.9 | 1:01 | 0:15 | 0:13 | 2.2 | 0.27 | 98.77 | 98.62 |
| Bowtie 2 | 0.3 | 0.9 | 0:49 | 0:12 | 1.8 | 0.28 | 98.39 | 98.36 | |||
| Novoalign | 0.0 | 1.0 | 0:57 | 0:15 | 1.9 | 0.33 | 99.57 | 99.28 | |||
| Stampy | 0.0 | 1.0 | 4:08 | 0:31 | 5.4 | 0.33 | 99.41 | 99.18 | |||
| DROS | BWA | 0.4 | 20 | 1.4 | 3:57 | 1:18 | 1:09 | 1.6 | 2.25 | 84.17 | 85.62 |
| Bowtie 2 | 0.5 | 1.4 | 5:33 | 1:05 | 2.3 | 2.71 | 84.56 | 85.51 | |||
| Novoalign | 0.6 | 1.4 | 11:25 | 1:35 | 4.0 | 2.53 | 82.82 | 85.24 | |||
| Stampy | 0.3 | 1.4 | 38:51 | 4:17 | 7.0 | 3.05 | 82.52 | 86.08 | |||
| YOR | BWA | 5.0 | 91 | 11.0 | 533:38 | 133:22 | 171:31 | 1.8 | 2.82 | 89.24 | 90.56 |
| Bowtie 2 | 3.7 | 10.9 | 352:49 | 89:11 | 1.6 | 3.50 | 90.48 | 91.46 | |||
| Novoalign | 8.0 | 10.9 | 969:19 | 368:39 | 1.9 | 2.98 | 87.52 | 90.41 | |||
| Stampy | 2.7 | 10.9 | 3397:02 | 453:59 | 5.8 | 3.48 | 88.38 | 91.18 | |||
Additional points
Coverage and read length
Statistically significant findings in the downstream analysis require high coverage sequencing. For example, Illumina’s cancer pipeline recommends 40x coverage for normal and 80x coverage for cancer tissues. The higher the coverage of the library the more advantageous the clustering becomes, as we expect the average cluster size to increase. We tested read libraries with reads of 36–100bp and we expect results to improve for even longer reads. For significantly shorter reads read mapping based on clusters will likely fail to achieve any significant speed-up or the loss of sensitivity will be non-negligible.
Bias of 15-mer
An overlap of length at least is guaranteed to overcome errors in our algorithm. Since we use a fixed value for , some reads will not be detected as members and possibly create singleton clusters. Smaller will lessen this problem, but to keep the algorithm efficient for large datasets we do not want to lower . Instead, if a read library is suspected to contain many reads with large number of errors can be increased to deal with the issue.
Parameter choices
If the sequencing error rate (typically less than for Illumina experiments) can be determined a priori, we suggest using a similarity cutoff . Too large a value for makes it difficult to assign a read to clusters, thus creating too many clusters, while a value too low might assign reads to wrong clusters.
For , if we choose a smaller value, we will get fewer clusters, which will in turn decrease running time, but unfortunately read mapping sensitivity will drop. On the other hand, a value too large leads to more clusters. This increases running time of both clustering and mapping, but it also increases mapping sensitivity. The values we used, and , worked well for three genomes of very different sizes and we expect that the choice will work well for experiments with similar coverage, read length and genome size and structure. Should the parameters of the experiment change drastically the choices might have to be re-evaluated in a preliminary study.
Automatic choice of parameters
It is possible to design a scheme to automatically select the necessary parameters and . A small, randomly selected set of reads can be mapped to the reference genome to compute the error rate from the uniquely mapped reads. Given , we can perform a grid search over the possible values of and . A chosen set of parameters should fulfill two criteria: One, a valid overlap, defined by and , between two reads from different genomic locus should only occur with very low probability, and two, the amount of required memory, which is primarily determined by the number of clusters, should be less than the available system memory. Next, we show an analysis of the expected number of clusters produced by a set of parameters.
Number of clusters:
We will assume that the reads are numbered in the order they are processed. Let means that read has an overlap with read of length at least and their overlapped portion and has similarity less than . Let the number of sequencing errors in be . Assuming is binomially distributed with rate , . Let be the set of anchor reads with at least overlap with . Given , the probabity of read becoming an anchor read and forming it’s own cluster is . We simplify the analysis by assuming that all the reads in has overlap of length , which is the expected length of a valid overlap. The updated probability is . Since the number of mismatches allowed is at most , is upper bounded by
Let be the number of clusters formed after processing reads. Assuming the reads were sequenced uniform randomly from the genome, . Now, if we replace with , is approximately equal to
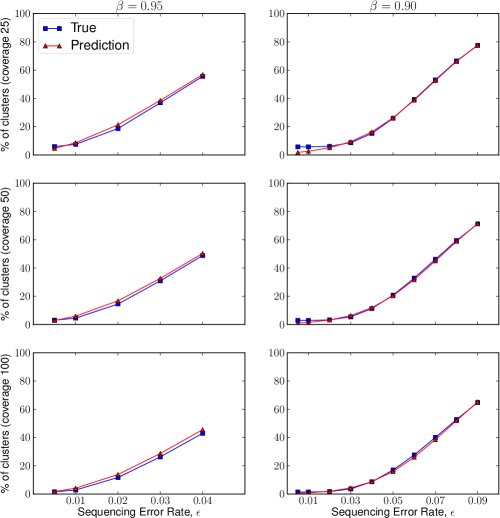
We numerically evaluate the approximate upper bound for the number of clusters . See Figure S.3 for an application of this analysis.
Commands
Here we assume that the read files are named reads_1.fq and reads_2.fq. TreQ-CG is a collection of three programs - treq-cluster, treq-split, and treq-map. At first we compute clusters, then extract anchor reads to be mapped by a traditional read mapper, and finally, use the mapping information of anchor reads to find alignment of the remaining reads. The commands to run these programs are given below. Appropriate changes were made for single end libraries and for libraries with pre-Illumina 1.8 quality scores.
-
•
Clustering reads:
treq-cluster [-q 0] -t 24 -s 0.95 cluster_prefix reads_1.fq reads_2.fq -
•
Extracting anchor reads:
treq-split cluster_prefix anchor_prefix reads_1.fq reads_2.fq -
•
Mapping anchor reads:
-
–
BWA
bwa aln -t 24 index anchor_prefix_1.fq tmp_1.sai
bwa aln -t 24 index anchor_prefix_2.fq tmp_2.sai
bwa sampe -a 1000 index tmp_1.sai tmp_2.sai anchor_prefix_1.fq anchor_prefix_2.fq anchor_reads.sam -
–
Bowtie2
bowtie2 [--phred64] -x index -p 24 -S anchor_reads.sam -1 anchor_prefix_1.fq -2 anchor_prefix_2.fq -
–
Novoalign
novoalign -F [ILM1.8 | ILMFQ] -e 1 -r Random -o SAM -d index -f anchor_prefix_1.fq anchor_prefix_2.fq anchor_reads.sam -
–
Stampy
stampy [--solexa] -g index -h index -o anchor_reads.sam -t 24 -M anchor_prefix_1.fq anchor_prefix_2.fq
-
–
-
•
Clustered mapping:
treq-map -t 24 genome.fa cluster_prefix anchor_reads.sam all_reads.sam reads_1.fq reads_2.fq