789\Yearpublication2006\Yearsubmission2005\Month11\Volume999\Issue88
later
Photometry and spectroscopy of the newly discovered
eclipsing binary GSC 4589-2999
Abstract
New CCD light curves of the recently detected eclipsing variable GSC 4589-2999 were obtained and analysed using the Wilson-Deninney code. Spectroscopic observations of the system allowed the spectral classification of the components and the determination of their radial velocities. The physical properties and absolute parameters of the components and an updated ephemeris of the system are given.
keywords:
stars: binaries: eclipsing – stars: fundamental parameters – stars: individual (GSC 4589-2999) – techniques: photometric – techniques: spectroscopic1 Introduction and Observations
Eclipsing binary systems offer unique conditions to measure
fundamental parameters of stars, such as stellar masses, radii and
luminosities, which are of great importance in stu-
dies of
stellar structure and evolution.
Using extensive photometric and spectroscopic data, we performed a
comprehensive study of the newly discovered eclipsing system GSC
4589-2999 (=TYC 4589-2999-1,
, V=10.6 mag). The light variability report
(as a by-product of observations of the eclipsing system EG Cep),
the first light curves and ephemeris of the system were published
by Liakos & Niarchos (2007).
The new photometric observations of the system were carried out at
the Gerostathopoulion Observatory of the Un-
iversity of Athens,
during 44 nights in June-October 2007 and 12 nights in June-July
2008, using the 0.4m Cassegrain telescope equipped with the
ST-8XMEI CCD camera and the BVRI Bessell photometric filters.
The spectroscopic observations were obtained with the 1.3m Ritchey-Cretien telescope equipped with a 2000800 ISA SITe CCD camera at Skinakas Observatory, located on the island of Crete, Hellas, on September 2007, September 2008 and May 2009. For the spectral classification, we used the Low Resolution Spectrograph which is incorporated in the Focal Reducer instrument. For the spectral classification we used a reflection grating of 1302 lines/mm giving a nominal dispersion of 1.04 Å/pixel, and an appropriate wavelength coverage (see Table 2) to include both Hα and Hβ Balmer lines. For the radial velocity (hereafter RVs) measurements a 2400 lines/mm grating was used, giving a nominal dispersion of 0.55 Å/pixel, while the wavelength range was selected to include the Mg I triplet and other metallic lines.
2 Data reduction
2.1 Photometry
Differential magnitudes were obtained using the software MuniWin v.1.1.23 (Hroch 1998). The magnitudes have not been transformed to a standard system and the colour extinction was not taken into account since standard star observations were not performed. Information about the comparison stars can be found in Table 1.
| Star | BTYC | VTYC | remarks |
|---|---|---|---|
| GSC 4589-2999 | 11.33 (6) | 10.61 (4) | variable |
| GSC 4589-2984 | 11.86 (8) | 10.93 (6) | comparison |
| GSC 4589-2842 | 13.4 (3) | 11.6 (1) | check |
2.2 Spectroscopy
Various exposure times for the observations of 2007, 2008, 2009 were used (for details see Table 2). Before and after each on-target observation, an arc calibration exposure (Ne- HeAr) was recorded. Arc spectra were extracted from the arc exposures by applying exactly the same profiles as to the corresponding object spectra and they were used to calibrate the object spectra.
For the spectral classification procedure, a total of 44 standards of spectral types ranging from O8 to M6 were observed with an identical instrument configuration as the targets: 15 were observed on September 29, 2007, 14 were observed on 31 August 2008 and another 15 were taken from Hatzidimitriou et al. (2006). All standard star spectra were reduced and calibrated in exactly the same way as the targets, following the procedure described in the following. The data reduction was performed using the IRAF package 2.13-BETA2 (2006). The frames were bias subtracted and the sky background was removed. The spectra were subsequently traced and extracted using the all-in-one subpackage apextract.
For the determination of the RVs, the softwares Radial Velocity reductions v.2.1d (Nelson 2009) and Broadening Functions v.2.4c (Nelson 2009) were used.
| Date of | UT | Phase | Exposure | Wavelength |
|---|---|---|---|---|
| observation | time (sec) | coverage (Å) | ||
| 29-9-2007 | 17:36 | 0.544 | 300 | 4728-6828 |
| 29-9-2007 | 17:42 | 0.547 | 300 | 4728-6828 |
| 29-9-2007 | 19:28 | 0.590 | 300 | 4728-6828 |
| 29-9-2007 | 19:35 | 0.593 | 300 | 4728-6828 |
| 3-9-2008 | 01:44 | 0.497 | 600 | 4713-6792 |
| 12-5-2009 | 23:54 | 0.688 | 1800 | 4535-5621 |
| 13-5-2009 | 21:19 | 0.216 | 1800 | 4535-5621 |
| 14-5-2009 | 20:09 | 0.780 | 1800 | 4535-5621 |
| 14-5-2009 | 20:49 | 0.795 | 1800 | 4535-5621 |
3 Data analysis
3.1 Spectroscopic analysis
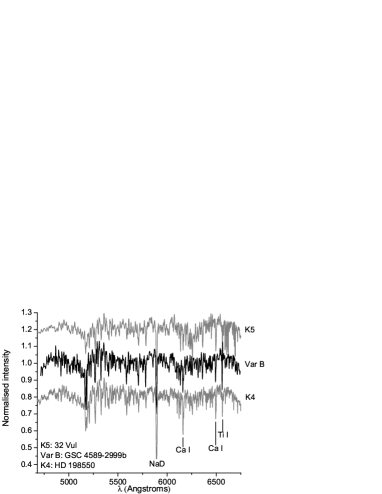
On September 2007 the spectra were obtained on the rising branch of the secondary minimum, and particularly the second set of spectra includes the spectra of both stars. On September 2008 the spectroscopic observations were obtained during the total eclipse, thus obtaining a clear spectrum for the primary (larger, hotter and more massive) component. The exact phase moments when the spectra were taken are given in Table 2. The spectrum of the secondary component was obtained by the subtraction of the two spectra (the spectra of 2008 from those of 2007), after normalizing them to the same continuum, line-free point. The resulting spectrum is of quite high signal-to-noise and clearly indicates a cooler star (see Fig. 1b), as it will be discussed below.
The classification of the spectra was achieved in two steps:
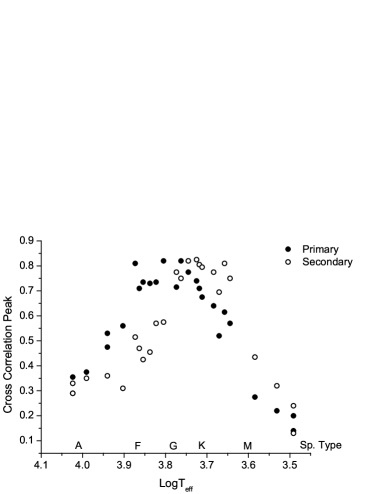
(i) Cross-correlation with the 44 standard star spectra, using the method described in detail in Hatzidimitriou et al. (2006). The accuracy of the spectral classification achieved with this method depends on the fineness of the grid of standard spectra used and on the signal-to-noise ratio of the cross-correlated spectra, and it is found to be around 0.3-0.4 of a spectral type (cf. Bonfini et al. 2009).
(ii) Visual detailed comparison of spectral features with standard spectra around the spectral type indicated by step (i). This procedure required prior normalization of the continua of the spectra, and leads to a confirmation and fine-tuning of the cross-correlation result.
Using steps (i) and (ii), we estimate that the primary component
of the system, namely GSC 4589-2999a (spectrum obtained in
September 2008), is of spectral type G1.5
0.5. The spectrum
is shown in Fig. 1a (solid black line), along with the spectrum of
the G2 standard star HD 196755 and of the G0 standard SF-18, for
comparison. The spectrum of the secondary component, GSC
4589-2999b, resulted from the subtraction of the spectra taken in
2007 and 2008, is of K4 type, with an uncertainty of one subclass.
The spectrum is shown in Fig. 1b together with the comparison
spectra of the K4 star HD 198550 and the K5 star 32 Vul. The cross
correlation diagrams for each component are overplotted in Fig.
1c.
For the RVs determination, the Broadening Functions (hereafter BFs) method (Rucinski 2002) on the spectra of 2009 was used. We cropped all spectra in order to avoid the broad Hβ line, and we included all the sharp metallic lines between 4865-5355 Å. Each RV value and its error was derived statistically (mean value and error) from the respective velocities resulted from BFs method by using different standard stars. The standard stars were HIP 40497, HIP 61317, HIP 65721 which are of F7, G0 and G5 spectral type, respectively. The heliocentric RVs with their errors in parentheses are given in Table 3, and the RVs plot is illustrated in Fig. 5.
| HJD - 2450000 | Phase | V1 | V2 |
|---|---|---|---|
| (Km/sec) | (Km/sec) | ||
| 4964.5048 | 0.688 | 51 (29) | -165 (17) |
| 4965.3971 | 0.216 | -93 (24) | 156 (29) |
| 4966.3490 | 0.780 | 57 (24) | -180 (18) |
| 4966.3747 | 0.795 | 71 (32) | -170 (16) |
 |
(a) |
 |
(b) |
 |
(c) |
3.2 Photometric and radial velocity analysis
The updated ephemeris of the system was calculated by applying the least squares method on all the available minima timings (Liakos & Niarchos 2009) and it is given by the following relation:
Min.I=HJD 2454642.4992(2)+1.688653(1) E
The light curves and the RVs curves were analyzed with the
PHOEBE v.0.29d software (Prša & Zwitter 2005),
whi-
ch uses the 2003 version of the Wilson-Devinney code (Wilson
& Devinney 1971; Wilson 1979, 1990). The code was applied in MODE
2 (detached system) and all light (BVRI) and RV curves were
analysed simultaneously.
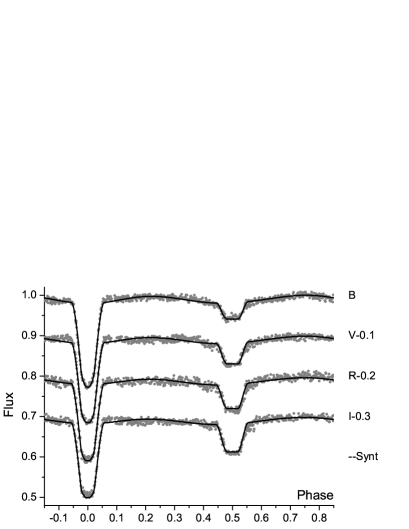
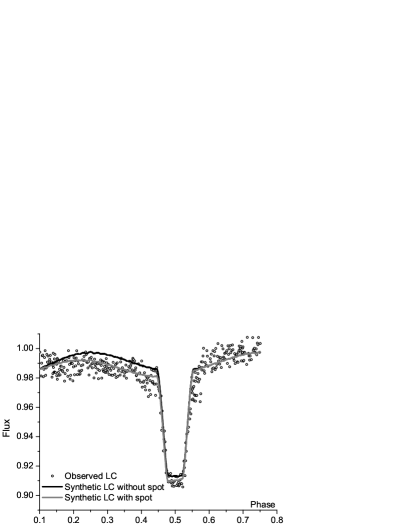
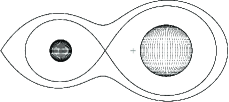
The temperature of the primary was fixed to the typical value of a G1.5 star, namely 5830 K, while the temperature of the secondary was given initially the value 4550 K, a typical value for a K4 star, but during the iterations it was left as free parameter. Given the spectroscopic error of the primary’s spectral type (see section 3.1), its corresponding temperature has an accuracy of 40 K. Hence, the error of the value was calculated according to the error propagation method. The albedo of each component, namely and , and the gravity darkening coefficients, and , were assigned theoretical values, according to the spectral types of the components. The values of limb darkening coefficients, and , were taken from the tables of van Hamme (1993). The dimensionless potentials and , the mass ratio , the fractional luminosity of the primary component, the systemic radial velocity , the semi major axis a and the inclination of the system’s orbit were treated as adjustable parameters. Due to asymmetries near the primary maxima of the light curves, a cool spot on the surface of the cooler component was assumed and its parameters (latitude , longitude , radius and temperature factor ) were also adjusted. Another analysis without the cool spot was also performed, but the result was worse. The spotted solution resulted in a sum of squared residuals =0.0032, while the unspotted one yielded to a value of 0.0059, therefore we chose to adopt the spotted solution. The comparison between the models including or not the spot is presented in Fig. 3. The maximum radial velocity of each component, namely and , was calculated by fitting a sinusoidal function on the points of each RV curve. The synthetic and observed light and RV curves are shown in Figs 2 and 5, respectively, the 3D representation is illustrated in Fig. 4, and the derived parameters are listed in Table 4.
 |
 |
 |
|
| (a) | (b) |

| Parameter | Value | Parameter | Value |
| i (deg) | 86.3 (2) | x1,B | 0.731 |
| q () | 0.46 (3) | x2,B | 0.898 |
| (R⊙) | 8.3 (3) | x1,V | 0.597 |
| K1 (km/sec) | 78 (3) | x2,V | 0.758 |
| K2 (km/sec) | 169 (1) | x1,R | 0.514 |
| V0 (km/sec) | -13 (3) | x2,R | 0.658 |
| T1 (K) | 5830 (40) | x1,I | 0.434 |
| T2 (K) | 4616 (116) | x2,I | 0.549 |
| 4.59 (1) | Spot | ||
| 5.75 (2) | Co-lat (deg) | 86 (6) | |
| L1/(L1+L2)B | 0.961 (1) | Co-lon (deg) | 44 (2) |
| L1/(L1+L2)V | 0.949 (1) | R (deg) | 20 (6) |
| L1/(L1+L2)R | 0.940 (1) | Tspot/Tsur | 0.6 (2) |
| L1/(L1+L2)I | 0.929 (1) | Fractional radii | |
| L2/(L1+L2)B | 0.039 (1) | r1 (pole) | 0.24 |
| L2/(L1+L2)V | 0.051 (1) | r1 (point) | 0.25 |
| L2/(L1+L2)R | 0.060 (1) | r1 (side) | 0.24 |
| L2/(L1+L2)I | 0.071 (1) | r1 (back) | 0.25 |
| g1 | 0.32 | r2 (pole) | 0.10 |
| g2 | 0.32 | r2 (point) | 0.10 |
| A1 | 0.5 | r2 (side) | 0.10 |
| A2 | 0.5 | r2 (back) | 0.10 |
4 Absolute elements of the components
The geometric and photometric elements, derived from the simultaneous analysis of the light and RV curves, were used to compute the absolute elements of the components. These elements, listed in Table 5, are used to place the two components on the Mass-Radius (M–R) diagram (Fig. 6) in order to examine their evolutionary status.
Both components lie inside the Terminal Age Main Sequence (TAMS) and Zero Age Main Sequence (ZAMS) limits, revealing their Main-Sequence (MS) nature. However, the primary component is closer to TAMS line, while the secondary one is almost in the middle of the limits. This result is in agreement with the theory of stellar evolution according to their initial mass, since the more massive component is found to be more evolved than the secondary, assuming a simultaneous birth.
| M | R | Teff | L | Mbol | |
|---|---|---|---|---|---|
| (M⊙) | (R⊙) | (K) | (L⊙) | (mag) | |
| P | 1.8 (1) | 2.02 (4) | 5830 (40) | 4.2 (2) | 3.2 (3) |
| S | 0.8 (1) | 0.85 (2) | 4616 (116) | 0.3 (1) | 6.1 (8) |

5 Discussion and conclusions
The main contribution of the present paper is the first determination of the physical parameters of the newly discovered eclipsing binary system GSC 4589-2999. This study is based on high-quality spectroscopic and multicolour CCD observations.
The two components of the system are classified as G1.5
0.5
(primary) and K41 (secondary), respectively. The light curve
analysis yielded a temperature of the secondary component as 4616
K, in very good agreement, within the error limit, with the
temperature corresponding to the spectral type (K3/5, 4685 K -
4415 K), derived from our spectroscopic observations.
The shape of the light curves indicates an Algol-type eclipsing binary with a period close to 1.69 d. A simultaneous analysis of the light and radial velocity curves resulted in a detached configuration with zero eccentricity. A small asymmetry near the primary maximum was better explained by assuming a cool spot on the surface of the secondary component, but it is well known that spot solution suffers from non-uniqueness.
The derived absolute elements were used to study the evolutionary status of the two components. It was found that both components belong to the MS, while the primary component (more massive and hotter) is more evolved than the secondary.
Acknowledgements.
This work has been financially supported by the Special Account for Research Grants No 70/4/9709 of the National & Kapodistrian University of Athens, Hellas. We thank P. Reig for the spectroscopic observations of September of 2008. Part of the work presented here was done while P. Bonfini was still a student at the University degli Studi di Milano - Bicocca, Italy and was possible thanks to the Erasmus Program. Skinakas Observatory is a collaborative project of the University of Crete, and the Foundation for Research and Technology-Hellas.References
- [1] Bonfini, P., Hatzidimitriou, D., Pietsch, W., Reig, P.: 2009, A&A 507, 705
- [2] Hatzidimitriou, D., Pietsch, W., Misanovic, Z., Rieg, R., Haberl, F.: 2006, A&A 451, 835
- [3] Hg, F.: 2000, Encyclopedia of Astronomy and Astrophysics, Edited by Paul Murdin, article 2862. Bristol: Institute of Physics Publishing, 2001
- [4] Hroch, F.: 1998, Proceedings of the 29th Conference on Variable Star Research 30
- [5] Liakos, A. & Niarchos, P.: 2007, IBVS 5900, 2
- [6] Liakos, A. & Niarchos, P.: 2009, IBVS 5897, 1
- [7] Nelson, R. H.: 2009, Software by Bob Nelson http://members.shaw.ca/bob.nelson/software1.htm
- [8] Prša, A. & Zwitter, T.: 2005, ApJ 628, 426
- [9] Rucinski, S.: 2002, AJ 124, 1746
- [10] van Hamme, W.: 1993, AJ 106, 2096
- [11] Wilson, R.E. & Devinney, E.J.: 1971, ApJ 166, 605
- [12] Wilson, R.E.: 1979, ApJ 234, 1054
- [13] Wilson, R.E.: 1990, ApJ 356, 613