Randall Division of Cell and Molecular Biophysics, King’s College London, New Hunts House, London SE1 1UL, United Kingdom
1 \secondaddress London Institute for Mathematical Sciences, 35a South St, Mayfair, London W1K 2XF, United Kingdom
Random graph ensembles with many short loops
Abstract.
Networks observed in the real world often have many short loops. This violates the tree-like assumption that underpins the majority of random graph models and most of the methods used for their analysis. In this paper we sketch possible research routes to be explored in order to make progress on networks with many short loops, involving old and new random graph models and ideas for novel mathematical methods. We do not present conclusive solutions of problems, but aim to encourage and stimulate new activity and in what we believe to be an important but under-exposed area of research. We discuss in more detail the Strauss model, which can be seen as the ‘harmonic oscillator’ of ‘loopy’ random graphs, and a recent exactly solvable immunological model that involves random graphs with extensively many cliques and short loops.
Les réseaux observés dans la Nature ont souvent des cycles courts. Ceci contredit le postulat de hiérarchie sur lequel se base la majorité des modèles de réseaux aléatoires et la plupart des méthodes utilisées pour leur analyse. Dans cet article, nous esquissons des directions de recherches possibles, afin de progresser sur les réseaux contenant beaucoup de cycles courts, faisant appel à des modèles de réseaux aléatoires éprouvés ou nouveaux, et des idées pour de nouvelles méthodes mathématiques. Nous ne présentons pas de solutions définitives, mais notre but est d’encourager et de stimuler de nouveaux travaux dans ce que nous croyons être une direction de recherche importante, bien que insuffisamment explorée. Nous discutons en détail le modèle de Strauss, qui peut être interprété comme ‘l’oscillateur harmonique’ des réseaux aléatoires ‘à boucles’, ainsi qu’un modèle immunologique soluble exactement qui implique des réseaux aléatoires avec de nombreux cliques et cycles courts.
1. Motivation and background
Tailored random graph ensembles, whose statistical features are sculpted to mimic those observed in a given application domain, provide a rational framework within which we can understand and quantify topological patterns observed in real life networks. Most analytical approaches for studying such networks, or for studying processes for which they provide the interaction infrastructure, assume explicitly or implicitly that they are locally tree-like. It permits, usually after further mathematical manipulations and in leading orders in the system size, factorisation across nodes and/or links. This in turn allows for the crucial combinatorial sums over all possible graphs with given constraints to be done analytically in the relevant calculations. However, real-world networks - for example protein-protein interaction networks (PPIN), immune networks, synthetic communication networks, or social networks - tend to have a significant number of short loops. It is widely accepted that the abundance of short loops in, for example, PPINs is intrinsic to the function of these networks. The authors of [1] suggested that the stability of a biological network is highly correlated with the relative abundance of motifs (e.g. triangles). The authors of [2] and [3] observed an apparent relationship between short cycles in gene-regulation networks and the system’s response to stress and heat-shock. A highly cited paper [4] went as far as to propose that motifs (e.g. triangles) are the basic building blocks of most networks. Similarly, in many-particle physics we know that lattice models are difficult to solve, mainly because of the many short loops that exist between the interacting variables on the lattice vertices [5]; calculating the free energy of statistical mechanical models on tree-like lattices, in contrast, is relatively straightforward. It is evident that incorporating constraints relating to the statistics of short loops into the specifications of random graph ensembles is important for this branch of research to be able to more closely align with the needs of practitioners in the bioinformatics and network science communities.
In this paper we review the analytical techniques that are presently available to model and analyse ensembles of random graphs with extensive numbers of short loops, and we discuss possible future research routes and ideas. We will use the terms ‘network’ and ‘graph’ without distinction. We start with a description of tailored random graph ensembles, and argue why graphs with short loops should become the focus of research, to increase their applicability to real-world problems and for mathematical and methodological reasons. We then discuss the simplest network model with short loops that even after some forty years we still cannot solve satisfactorily: the Strauss model [6], which is the archetypical ensemble of finitely connected random graphs with controlled number of triangles. We describe some new results on the entropy of this ensemble, continuing the work of e.g. [7], as well as an as yet unexplored approach based on combining graph spectral analysis with the replica method. The next section discusses some recent results on the statistical mechanics of an immune network model [8]; in spite of its many short loops, this model could quite unexpectedly be solved analytically with the finite connectivity replica method [11, 12, 13], suggesting a possible and welcome new mechanism for analysing more general families of ‘loopy’ graphs. We then show how the model of [8] can indeed be used in other scenarios where short loops in networks play a functional role, and we work out in more detail its application in the context of factor graph representations of protein-protein interaction networks.
2. Modelling with random graphs – the imporance of short loops
Networks are powerful conceptual tools in the modelling of real-world phenomena. In large systems of interacting variables they specify which pairs can interact, which leads to convenient visualisations and reduces the complexity of the problem. Random graphs serve as proxies for interaction networks that are (fully or partially) observed or built in biology, physics, economics, or engineering. Random graphs allow us to analytically solve statistical mechanical models of the processes for which the networks represent the infrastructure, by appropriate averaging of generating functions of observables over all ‘typical’ interaction networks. Or they can be used as ‘null models’ to quantify the statistical relevance of topological measurements which are taken from observed networks. In all cases it is vital that the random graphs actually resemble the true real-world networks in a quantitatively controllable way.
In this paper we limit ourselves, for simplicity, to nondirected graphs without self-links. Generalisation of the various models and arguments to directed and/or self-interacting graphs is usually straightforward. A nondirected simple -node graph is characterised by its nodes and by the values of link variables . Here if the nodes are connected by a link, and otherwise. We always have (since our graphs are nondirected) and (since our graphs are simple), for all . We will denote the set of all such graphs as . A random graph ensemble is defined by a probability measure on .
2.1. Tailored random graph ensembles
If we wish to use random graph ensembles to study real-world phenomena, it is vital that our measure favours graphs that mimic those in our application domain. For instance, it makes no sense to use Erdös-Rényi graphs [14] as null models against which to test occurrence frequencies of motifs in biological networks: almost any measurement will come out as significant, simply because our yardstick is not realistic. Tailored random graph ensembles [15, 16, 17, 18] involve measures that are constructed such that specified topological features of the generated graphs will systematically resemble those of a given real-world graph . To construct such measures one first defines the set of observables whose values the random graphs is supposed to inherit from . One then defines as the maximum entropy ensemble on , subject to the imposition of the values of , with the Shannon entropy [19] . This can be done via hard constraints, where each with must have the specified values, or via soft constraints, where our random graphs will be described by an exponential ensemble and exhibit the specified values of the observables only on average:
| (1) | |||||
| (2) |
The maximum entropy formulation is essential to make sure one does not introduce any unwanted bias into our tailored graphs; we want to build in the features of and nothing else.
This leads to the question of which would be sensible choices for the observables to carry over from to our ensemble? Sensible choices are those for which we can do the relevant calculations, and for which the Shannon entropy of would be smallest111Since the effective number of graphs in an ensemble is given by , the Shannon entropy can be interpreted as a measure of the size of the smallest box in Figure 1. The smaller this box, the more information on has been carried over to our graph ensemble.. The calculations we might wish to do usually relate to stochastic processes for variables placed on the nodes of the graph, and the crucial question is whether the relevant combinatorial sums over all graphs generated from can be carried out analytically. In equilibrium systems we would want to calculate the typical free energy per degree of freedom, averaged over the random graph ensemble, for Hamiltonians of the form . The replica method [9, 10, 11, 12, 13] then leads us for hard-constrained ensembles of finitely connected graphs to a combinatorial problem of the following form:
| (3) |
Similarly, in dynamical studies based on generating functional analysis [20, 21, 22] we would be required to evaluate
| (4) |
In both cases we see that our observables should be chosen such that sums of the form are analytically tractable. Setting for all gives us en passant the value of the Shannon entropy, which for hard-constrained ensembles (1) becomes . It turned out that these summations over all graphs are analytically feasible [15, 16, 17, 18], in leading orders in , for observables such as
| (5) |
2.2. The problem of short loops
To quantify the extent to which real-world networks can be approximated by random graphs that share with the values of the average degree , or the degree distribution , or the joint distribution of the degrees of connected node pairs, it is helpful to study systems for which alternative exact solutions or reliable simulation data are available. Using the methodology of [15, 16, 17, 18], we can, for instance, calculate with the replica method the critical temperatures of Ising systems on random graphs with Hamiltonian . We choose our random graph ensembles to be increasingly constrained in the sense of Figure 1:
| (6) | |||||
| (7) | |||||
| (8) |
In Figure 2 we compare the critical temperatures for Ising systems on random graphs tailored according to (6,7,8) to the true critical temperature values of the approximated finitely connected graphs , for cubic lattices and for so-called ‘small world’ lattices. While constraining only the average degree (A) is clearly insufficient, we see that constraining the degree distribution (B) brings us already closer to the true values of the transition temperatures. Adding the joint degree statistics of connected nodes (C) gets the critical temperatures nearly right for the small-world graphs, but fails to improve for the regular lattices. Since in regular cubic lattices one simply has , prescribing the values of here indeed gives no information that is not already contained in the degree distribution.
We conclude from Figure 2 that random graphs tailored on the basis of the observables (5) do capture valuable information, and give reasonable approximations of quantitative characterictics of stochastic processes that run on such graphs, but there is room for improvement. A hint at which would be an informative observable to add to and in order to make our tailored random graphs more realistic approximations of is provided by comparison of the two case studies in Figure 2. A prominent difference between the topologies of cubic latices and small world graphs is the multiplicity of short loops. Cubic lattices have a finite number per node of loops of any even length, even in the limit , whereas in small world lattices the number of short loops per node vanishes for . Explicit calculation shows that also the ensembles (6,7,8) typically generate locally tree-like graphs, and this explains why the critical temperatures of the small world graphs are approximated very well, while those of the cubic lattices are not. By the same token, one can easily confirm that biological signalling networks, such as protein-protein interaction networks (PPIN) or gene regulation networks (GRN) have signifcantly more short loops than the typical graphs generated within the ensembles (6,7,8). See for example the data in Figure 3. The same is probably true for many social, economical and technological networks.
It appears that the next natural observables to be constrained in order to make our tailored random graphs more realistic must involve the number of short loops per node. Moreover, the realistic scaling regime is for this number to be finite, even for . However, all available methods for analysing stochastic processes on graphs (replica methods, cavity methods, belief and survey propagation, generating functional analysis), or for calculating ensemble entropies, all require implicitly or explicitly that the underlying topologies are locally tree-like. Apart from correction methods to handle small deviations from the tree-like assumption [27, 28, 29], there appears to be as yet no systematic method for doing the relevant combinatorial sums over all graphs in expressions such as (3,4) analytically when short loops are prevalent.
3. Strauss model – the ‘harmonic oscillator’ of loopy graphs
3.1. Definitions
We now turn to the simplest ensemble of finitely connected graphs with extensively many short loops. Since we have seen earlier that calculating graph ensemble entropies is usually a precursor to analysing processes on such graphs, we focus for now on how to determine Shannon entropies. The Strauss model [6] is the maximum entropy soft-constrained random graph ensemble, with specified values of the average degree and the average number of triangles. It is defined via
| (9) |
The ensemble parameters and are used to control the relevant ensemble averages, via the identities
| (10) | |||||
| (11) |
with the following function whose evaluation requires that we do analytically the sum over all graphs :
| (12) |
For this ensemble, we wish to calculate the Shannon entropy in leading order in . This follows directly from , which is minus the free energy of the system, since
| (13) | |||||
Upon setting to be equal to zero, the ensemble (9) reduces to the Erdös-Rényi (ER) ensemble [14]
| (14) |
Differentiating and substituting in then immedately leads us to
| (15) |
The parameter can therefore be interpreted as the likelihood of having a link between any two nodes in the ER ensemble, so for finitely connected graphs and . This connection with the ER ensemble suggests rewriting equation (9) as
| (16) | |||||
with
| (17) |
Hence the substance of the entropy calculation problem for the Strauss ensemble is mathematically equivalent to determining the moments of the distribution of triangle counts in the Erdös-Rényi ensemble.
3.2. Simple approximation of the Shannon entropy of the Strauss model
We note that the average of the distribution (17) can be calculated easily and expressed in terms of the average degree of the ER ensemble, giving
| (18) |
Here , which will differ from the average degree of (9) as soon as , is related to the parameter via the identity
| (19) |
As a first approximation, we can make the simple ansatz that (17) is a Poissonian distribution, which must then be given by . One does not expect this assumption to be valid exactly, but according to simulation data (see e.g. Figure 4), it is a reasonable initial step. It allows us to do the sum over in (16 ), and find
| (20) | |||||
We can now immediately work out (11) and (13):
| (21) | |||||
| (22) | |||||
| (23) |
At we simply recover the equations of the ER model, with and
| (24) |
For we need to inspect the solutions of our equations with finite positive values and , by working out the different possible scalings of the parameter with . In view of what we know about the scaling with of the correct solution for at , the natural ansatz to consider is as . We now find that
| (25) |
Solutions with finite and for seem to require that , giving
| (26) |
This solution clearly exists only if . The corresponding entropy expression is found to be the following, which indeed reduces correctly to the ER entropy for :
| (27) |
At the point where , we see that would have to become even more negative. There is no entropy crisis since
| (28) |
Hence there is no evidence for bifurcation to an alternative solution at . The failure of this simple route to lead to solutions in the regime must therefore be due to the invalidity of the Poissonian assumption for .
3.3. The diagrammatic approach of Burda et al.
A drawback of the Strauss model [6], is that it has a condensed phase, where the typical networks have a tendency to form complete cliques, which does not reflect the topology of real networks. Burda et al [7] refined our understanding of this phenomenon, using a diagrammatic approach. They showed that the clustered phase occurred above certain critical values of the parameters, and evaluated the free energy and the expectation value of , in their notation, as
| (29) |
where the identification of the different parameter conventions follows from and . We know also from [7] that if we make the substitution , in which and are functions of but without dependency, then the perturbation series will break down for a value of that is strictly less than 1 (the actual breakdown value was found numerically to be about 0.7). Hence, we can see that within this range as. This means that the number of triangles per node tends to zero in the large limit, throughout the regime where the perturbation series of [7] converges. One can also show that, in leading order in , the average degree remains unchanged in the regime where the perturbation series converges, i.e. .
If we write , we can write the ensemble entropy according to the expansion of [7] as
| (30) | |||||
Upon expanding the logarithm, and eliminating the parameter with equation (29), it then follows that
| (31) |
in which is the average number of triangles in typicall graphs from the Strauss ensemble, and . This form has similarities with previously derived results, e.g. [15, 17]. If then the entropy reduces to the Erdös-Rényi entropy, as expected. Direct comparisons with expressions obtained via the Poissonnian ansatz are not valid, because the expressions refer to different scalings with of . The next step would be to eliminate in favour of the observable . This is not simple, as it effectively requires the solution of a fourth order equation.
The authors of [7] numerically deduced the critical values for the coupling parameter for networks with average degrees of 2, 4 and 8. This gives a region within which we know that it is valid to apply formula (31), and reasonable to use a model with such parameters to model real networks. We evaluated (31) and related quantities for values of the parameter up to roughly the critical point. The implied parameter is found numerically. The results are shown in Figure 5. For the (realistic) values of average degree and network size considered, we observe that by the time the coupling constant reaches the critical value, the number of triangles in the network is predicted to increase more than tenfold compared to an ER ensemble with the same average degree. However, the complexity is low when viewed as a proportion of the overall entropy of the ensemble. Constraining only the average number of loops, and remaining within a phase with relatively low clustering, apparently still leaves significant topological freedom for the networks in the ensemble.
Figure 6 compares the number of triangles observed in several biological networks, with average degree around , with the maximum number of triangles that a Strauss ensemble graph could be expected to generate, before it goes into its degenerate clustered phase. This shows that, while the Strauss model is a substantial improvement on the Erdös-Rényi model from the point of view of the number of loops, it usually collapses into its clustered phase before it reaches biologically realistic values for its parameters. If we wish to extend the perturbation analysis beyond the critical point, we need to look at different scalings of the parameter . However, since the un-physical behaviour of the Strauss model above this point has already been shown, such a result would be of limited application. The authors of [7] have extended their analysis in [30] to general uncorrelated degree distributions - but the agreement with simulations was less precise.
3.4. Spectrally parametrised loopy ensembles
Since the Strauss model ‘clumps’ above a certain critical point before realistic numbers of short loops are achieved, with the imposed triangle numbers being realised in dense cliques, one would like to define more versatile graph ensembles by including additional observables to tailor the graphs further in terms of short loops and penalise the formation of large cliques. Since the two constrained observables in the Strauss model are both seen to be specific traces of the matrix , i.e.
| (32) |
one in effect contrains in this ensemble the second and third moment of the eigenvalue spectrum . A natural generalisation of the Strauss ensemble would therefore be obtained by prescribing more general spectral features, or even the full eigenvalue spectrum itself. For a soft-constrained maximum entropy ensemble this would involve, rather than the scalar pair , a functional Lagrange parameter . Thus we obtain
| (33) |
where denotes the -th eigenvalue of . For the choice one recovers from (33) the Strauss ensemble. Including higher order terms, e.g. via for some , would give better control over the clumping of the original Strauss model. If we define our ensemble by a full imposed spectrum , which is equivalent to sending , we would have to solve the function from
| (34) |
Although the early steps of the argument in [7] would still apply, it is not clear how to analytically re-sum the contributing terms in the expansion for these more general ensembles. Here we need new analytical tools.
Below we discuss a potential new route to tackle the relevant combinatorial sums. Determining the entropy of the generalised spectrally constrained graph ensemble (33) would require the evaluation of the functional
| (35) |
Calculating the sum over all graphs in (35) directly is not feasible. However, we can rewrite using the standard spectrum formula of [31]:
| (36) |
This gives us, after integration by parts in the exponent,
| (37) |
We can now discretize the integral via , and use the identity to write
| (38) | |||||
in which
| (39) |
Expression (39) is clearly reminiscent of formulae encountered in replica analyses of heterogeneous many-variable systems, which suggests a strategy for proceeding with the calculation. We can carry out the sum over all graphs , which is the core obstacle in the problem, by evaluating equation (39) for positive integer values of (where the powers of and simply become multiple replicated Gaussian integrals in which the entries appear in factorised form). The full expression could then be determined by taking the limits in (38) via analytical continuation.
The sum over graphs has thereby been tamed, and the previous combinatorial difficulties converted into the intricacies of an unusual replica limit. In the original papers that launched and used the replica method, the (real-valued) replica dimension had to be taken to zero, reflecting ‘frozen’ heterogeneity in the micro-parameters of stochastic processes [9, 10, 11, 12, 13]. Later statistical mechanical studies have found how real-valued but nonzero replica dimensions emerge in a natural way to describing nested processes that equilibrate at distinct temperatures and timescales, e.g. slowly evolving heterogeneity in the micro-parameters of ‘fast’ stochastic physical or biological processes [32, 33, 34, 35]. To our knowledge there have not yet been calculations in which purely imaginary replica dimensions emerge, as in the calculation above.
4. Solvable immune models on loopy networks
In a recently published statistical mechanical study of the interaction between T and B-clones in the adaptive immune system [8] the authors succeeded in obtaining a full analytical solution, leading to phase diagrams and testable predictions for observables which agreed perfectly with numerical simulations. Following a preceding paper [36] they mapped the problem to a new but equivalent spin system describing only T-T interactions, by integrating out the degrees of freedom that represented the B-clones. The new effective model for interacting T-clones could then be solved using replica methods. What is intriguing in the context of this paper is that in this new model for T-clones the spins are positioned on the nodes of a finitely connected interaction graph with an extensive number of short loops, see e.g. Figure 7. Given the arguments in the previous sections, one would not have expected analytical solution to be possible.
4.1. The model of Agliari et al.
In the models of [8, 36] one studies the interactions between B-clones (), T-clones (), and external triggers of the immune system (the so-called ‘antigens’). Each B-clone can recognise and attack one specific antigen species, and the T-clones are responsible for coordinating the B-clones via chemical signals (cytokines), but do so in a somewhat promiscuous manner. The collective system is described as a statistical mechanical process in equilibrium, characterised by the following Hamiltonian
| (40) |
Here represents the log-concentration of antigen type , is the sensitivity of the -th B-clone to its allocated antigen, and represents the cytokine interaction between T-clone and B-clone . The ‘field’ acts as the combined input to B-clone . If is positive clone will expand, if it is negative clone will contract. The can be excitatory (), inhibitory (), or absent (), and are drawn randomly and independently from
| (41) |
Thus the original system is described by a weighted bi-partite interaction graph. The parameter controls the degree of promiscuity of the B-T interactions. Realistic clone numbers would be and , so statistical mechanical approaches are valid. The authors of [8] study this system in the regime where and , with finite and . They ‘integrate out’ the B-clones in the system’s partition function (which requires only a simple Gaussian integral), and are left with a system of interacting Ising spins, described by the effective Hamiltonian
| (42) |
This Hamiltonian is reminiscent of the one found in attractor neural network models [37, 38], with a so-called Hebbian interaction marix coupling the spins. However, due to the scaling with of the probabilities in (41), the present (weighted) interaction matrix is finitely connected. Moreover, unlike finitely connected neural network models [13], where one stores and recalls a finite number of binary patterns with extensive information content each, here one seeks to store and recall an extensive number of patterns with a finite number of bits each. This distinction is not only vital in the immunological context, since an organism has to defend itself against extensive simultaneous invasions to survive, but it also generates fundamental mathematical differences. Finitely connected attactor models like [13] operate on graphs that are locally tree-like, by construction, whereas the model (42) typically involves ‘loopy’ interaction graphs; see Figure 7.
4.2. Statistical mechanical analysis
The details of the statistical mechanical analysis of (42) can be found in [8], here we only discuss their results. In view of the extensive number of ‘stored patterns’ in this model, compared to finitely connected attractor neural networks, the conventional analysis route (involving sub-lattice magnetisations as order parameters) can no longer be used. Instead the appropriate order parameter is
| (43) |
Each of the (extensively many) state overlaps represent the combined activation/repression signal coming from the T-cells and acting upon B-clone , so the conditional distribution quantifies the strength and specificity of the response of the adaptive immune system to a typical antigen attack. Given this order parameter, the calculation of the disorder-averaged free energy involves path integral techniques combined with replica methods. The end result, within the replica-symmetric (RS) ansatz, is the following self-consistent equation for a field distribution :
| (45) | |||||
in which is the inverse temperature (i.e. inverse noise level) of the system. The distribtion turns out to describe the distribution of clonal interference fields, i.e. the unwanted signalling cross-talk between clones. Equation (45) always has the trivial solution , which represents interference-free operation, but exhibits bifurcations away from this state at parameter combinations such that
| (46) |
This equation therefore defines a phase transition that separates a regime of interference-free operation of the adaptive immune system from one that exhibits deteriorating performance due to interference between clones. Cross-sections of this transition surface are shown in Figure 8.
4.3. Stepping back - why is the ‘loopy’ Agliari et al model solvable?
In retrospect it is clear why the interacting spin model (42) is solvable, in spite of the extensively many short loops in its interaction graph . The reason is that the interaction matrix has the form , with a matrix with entries that itself represents a locally tree-like graph. Mathematically this allows one to introduce a Hubbard-Stratonovich-type [5] transformation in the partition function, to a new but equivalent model that has a locally tree-like structure, at the cost of introducing new Gaussian degrees of freedom:
| (47) |
This construction indeed reflects exactly the origin of the model in [8], with the B-cells acting as auxiliary Gaussian variables. The more general question would now be for which other interaction networks with extensively many short loops one could write (or approximate sensibly) the interaction marix in a form for some and some bi-partite but locally tree-like graph . Models on such networks could then be mapped similarly onto an equivalent model where the short loops have been traded in for extra degree of freedom. This would obviously only be possible for graphs with nonnegative spectra.
Another curious aspect of the Agliari et al model is that it defies another expectation. Normally the entropy calculation for a random graph ensemble is easier than solving an interacting spin model on the ensemble’s graphs. Here the situation is reversed. The entropy calculation is harder. For the present nondirected weighted graph ensemble we have
| (48) |
in which denotes averaging over (41). This ensemble is not a maximum entropy ensemble with constraints in the sense of (1) or (2), and the methods used for the latter ensembles are no longer applicable. Using the replica identity we can, however, write the Shannon entropy per node of the ensemble (48) as
| (49) | |||||
Working out the leading orders in of this remaining combinatorial problem looks feasible but has not yet been fully solved, and is the subject of ongoing work.
4.4. The connection with models of proteins and their complexes
Many systems can be described with an interaction graph similar to the one of [8, 36]. For instance, although most protein-protein interaction network (PPIN) data repositories (such as [25]) report only binary interactions between pairs of protein species, the more natural description is in fact that of a bipartite graph, with one set of nodes representing protein complexes and another set representing the individual proteins. A link from a given protein to a given complex then indicates that the protein participates in the complex; see Figure 9. If from such data we construct a new weighted graph, with nodes that represent the proteins only, and links between the nodes that give the number of complexes in which they jointly participate, we obtain once more graphs from the graph ensemble (48). The only difference with the immune models is that now the variables take their values randomly and independently from the set :
| (50) |
This graph ensemble was studied in [39], in terms of its topological properties (percolation transition, path lengths, and so on), but not in the context of protein interactions. Several observables of the projected network can be immediately deduced from the parameters of the bipartite graph. For instance:
| (51) | |||||
| (52) |
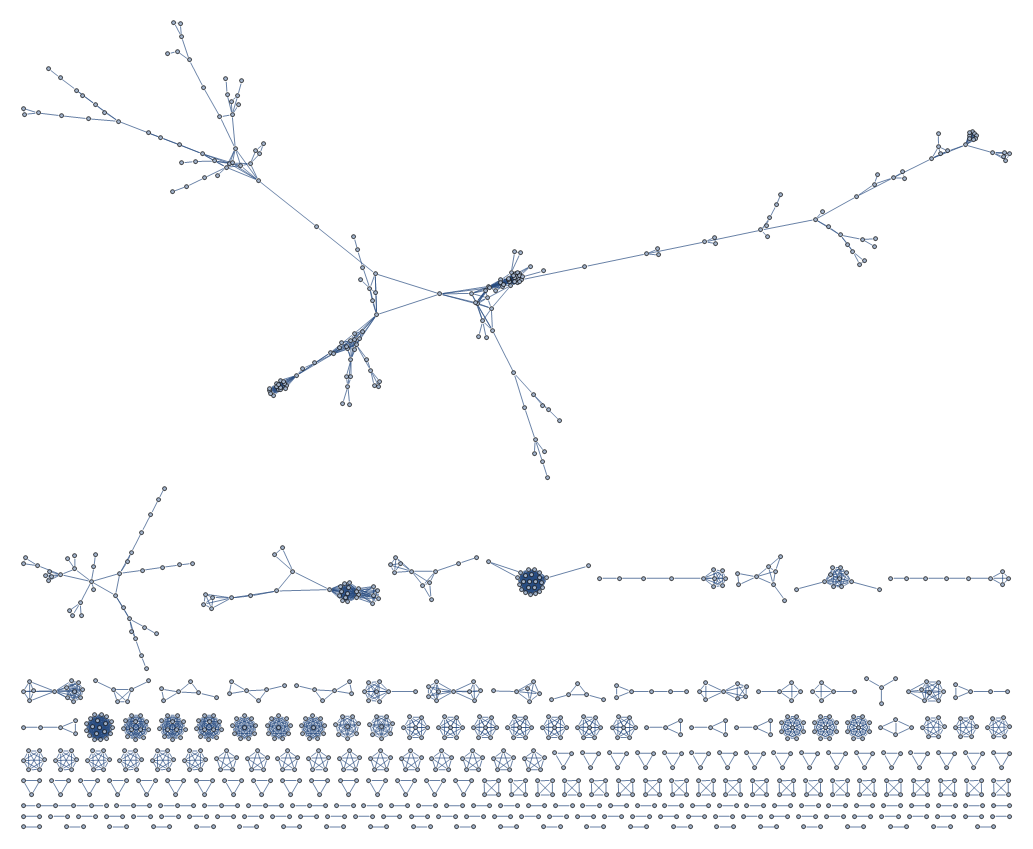
from which it also follows that . As with the immune model, one obtains loops in the PPIN graph again from an underlying model which is tree-like; here this underlying model is the description of the system in terms of the proteins and their complexes. In Figure 10 we show the result of using the data from [40] on protein complexes found in yeast in order to construct a protein-protein interaction network according to the definition in (50), i.e. via , with indicating whether () or not () protein participates in complex . It will be clear that, using the technology of [8], one should now be able to solve analytically models of protein reaction processes on ‘loopy’ protein-protein interaction networks, provided they are built on these along the lines of (50).
5. Conclusion
In this paper we have discussed some conceptual and mathematical issues that emerge as soon as one studies (processes on) graphs and networks that are not locally tree-like, but exhibit extensive numbers of short loops. Stochastic processes on graphs with many short loops have quantitative characteristics that are bvery different from those that run on tree-like structures. This is why Ising models on tree-like lattices are trivially solved, but Ising models on finite-dimensional lattices are not. Yet our currently available arsenal of mathematical tools for analysing ‘loopy’ graphs is rather limited, because the tree-like assumption is at the very core of most of our techniques, whether we are analysing processes on graphs or calculating entropies of graph ensembles. Even asymptotic results for infinitely large ‘loopy’ graphs are largely absent. However, we believe that this area will become increasingly important in the coming years, since the fact is that many (if not most) of the networks that we can observe in the real-world do have significant numbers of loops.
We have tried to propose and explain some new ideas and possible routes forward, aimed at making progress in the analytical study of ‘loopy’ random graph ensembles. Some built on our own ideas (including e.g. simple approximations and replica techniques) and some built on work of others (such as the papers by Burda et al, that are based on diagrammatic expansions). Most of the material relates to ongoing work, and is still only beginning to be explored. We discussed in more detail two specific random graph ensembles: the Strauss model, because it is the simplest possible random graph ensemble in which one can induce arbitrary numbers of short loops (in this case triangles), and an ensemble that emerged in a recent immunological model, because this model could be solved analytically in spite of its ‘loopy’ nature.
Acknowledgements
Both authors gratefully acknowledge financial support from the Biotechnology and Biological Sciences Research Council (BBSRC) of the United Kingdom, and would like to Franca Fraternali, Alessia Annibale and Eric Blanc for discussions and
Sun Sook Chung and Alessandro Pandini for the triangle count data used as the basis for Figure 6.
References
- [1] RJ Prill, PA Iglesias and A Levchenko 2005 PLoS biology 11, e343.
- [2] J Jeong and P Berman 2008 BMC systems biology 2, 12.
- [3] HJCM El-Samad, H Kurata, JC Doyle, CA Gross and M Khammash 2005 Proc. Natl. Acad. Sci. USA 102, 2736–2741.
- [4] R Milo, S Shen-Orr, S Itzkovitz, N Kashtan, D Chklovskii and U Alon 2002 Science 298, 824–827.
- [5] RJ Baxter 1982 Exactly Solved Models in Statistical Mechanics (Academic Press)
- [6] D Strauss 1986 SIAM Review 28, 513-527.
- [7] Z Burda, J Jurkiewicz and A Krzywicki 2004 Phys. Rev. E 69, 026106.
- [8] E Agliari, A Annibale, A Barra, ACC Coolen and D Tantari 2013 J. Phys. A: Math. Theor. 46, 415003.
- [9] D Sherrington and S Kirkpatrick 1975 Phys. Rev. Lett. 35, 1792–1796.
- [10] M Mézard, G Parisi and MA Virasoro 1987 Spin Glass Theory and Beyond (Singapore: World Scientific)
- [11] L Viana L AJ and Bray 1985 J. Phys. C 18, 3037.
- [12] R Monasson 1998 J. Phys. A: Math. Gen. 31, 513–529.
- [13] B Wemmenhove and ACC Coolen 2003 J. Phys. A: Math. Gen. 36, 9617-9633.
- [14] P Erdös and A Rényi A 1959 Publ. Math. 6, 290–297.
- [15] A Annibale, ACC Coolen, LP Fernandes, F Fraternali and J Kleinjung 2009 J. Phys. A: Math. Theor. 42, 485001.
- [16] LP Fernandes, A Annibale, J Kleinjung, ACC Coolen and F Fraternali 2010 PLoS ONE 5, e12083.
- [17] ES Roberts, T Schlitt and ACC Coolen 2011 J. Phys. A: Math. Theor. 44, 275002.
- [18] ACC Coolen, F Fraternali, A Annibale, LP Fernandes and J Kleinjung 2011 in Handbook of Statistical Systems Biology (Wiley; M Stumpf, DJ Balding and M Girolami, Eds), 309-330.
- [19] TM Cover and JA Thomas 1991 Elements of Information Theory (New York: Wiley)
- [20] JPL Hatchett, B Wemmenhove, I Pérez-Castillo, T Nikoletopoulos, NS Skantzos and ACC Coolen 2004 J. Phys. A: Math. Theor. 37, 6201-6220.
- [21] A Mozeika and ACC Coolen 2009 J. Phys. A: Math. Theor. 42, 195006.
- [22] K Mimura and ACC Coolen 2009 J. Phys. A: Math. Theor. 42, 415001.
- [23] T Nikoletopoulos, ACC Coolen, I Pérez-Castillo, NS Skantzos, JPL Hatchett and B Wemmenhove 2004 J. Phys. A: Math. Theor. 37, 6455.
- [24] T Preis, P Virnau, W Paul and JJ Schneider 2009 J. Comp. Phys. 228 (2009), 4468.
- [25] TSK Prasad, R Goel, K Kandasamy, S Keerthikumar, S Kumar et al. 2009 Nucleic Acids Res. 37, D767.
- [26] ACC Coolen, A De Martino and A Annibale 2009 J. Stat. Phys. 136, 1035-1067.
- [27] A Montanari and T Rizzo T 2005 J. Stat. Mech., P10011.
- [28] M Chertkov and VY Chernyak 2006 J. Stat. Mech., P06009.
- [29] V Gomez V, JM Mooij and HJ Kappen HJ 2007 J. Machine Learning Res. 8, 1987-2016.
- [30] Z Burda, J Jurkiewicz and A Krzywicki, A 2004 Phys. Rev. E 70, 026106.
- [31] SF Edwards and RC Jones 1976 J. Phys. A: Math. Gen. 9, 1595-1603.
- [32] ACC Coolen, RW Penney and D Sherrington 1993 Phys. Rev. B 48, 16116-16118.
- [33] V Dotsenko, S Franz and M Mézard 1994 J. Phys. A: Math. Gen. 27, 2351-2365.
- [34] T Uezu and ACC Coolen 2002 J. Phys. A: Math. Gen. 35, 2761-2809.
- [35] S Rabello, ACC Coolen, CJ Pérez-Vicente and F Fraternali 2008 J. Phys. A: Math. Theor. 41, 285004.
- [36] E Agliari, A Annibale, A Barra, ACC Coolen and D Tantari 2013 J. Phys. A: Math. Theor. 46, 335101.
- [37] DJ Amit 1989 Modeling Brain Function (Cambridge: University Press)
- [38] ACC Coolen, R Kühn and P Sollich 2005 Theory of Neural Information Processing Systems (Oxford: University Press)
- [39] MEJ Newman 2003 Phys. Rev. E 68, 026121.
- [40] A-C Gavin, P Aloy, P Grandi, R Krause, M Boesche, M Marzioch, C Rau, LJ Jensen, S Bastuck et al. 2006 Nature 440, 631-636.