Critical Cooperation Range to Improve Spatial Network Robustness
Abstract
A robust worldwide air-transportation network (WAN) is one that minimizes the number of stranded passengers under a sequence of airport closures. Building on top of this realistic example, here we address how spatial network robustness can profit from cooperation between local actors. We swap a series of links within a certain distance, a cooperation range, while following typical constraints of spatially embedded networks. We find that the network robustness is only improved above a critical cooperation range. Such improvement can be described in the framework of a continuum transition, where the critical exponents depend on the spatial correlation of connected nodes. For the WAN we show that, except for Australia, all continental networks fall into the same universality class. Practical implications of this result are also discussed.
Introduction
The construction of a new terminal at the Schenzen airport, Southeast China, has been used to question the current strategies of infrastructure growth in developing countries Yglesias2013 ; Calder2013 . Schenzen is a large city, but its airport is directly connected by an eight kilometer ferry to the Hong Kong airport, which can handle twice as many passengers. Is it reasonable to invest more than one billion dollars increasing the capacity of such a large infrastructure with another one nearby? Opponents to this investment classify it as a white elephant and as one example of the misbegotten infrastructure growth in developing countries. The ones in favor, argue that not only the costs of investing in Schenzen are lower than in Hong Kong but also global connectivity can profit from cooperation between stakeholders of air-transportation systems in the region. Here we address, from a network science perspective, how such proximity and cooperation between local actors is key to the robustness of spatial networks.
The simplified representation of complex systems as a network of nodes and links has provided important insights into the design of a variety of systems, such as power grids Albert2004 ; Kim2008 ; Motter2013 , maritime commerce Kaluza2010 , and communication networks such as the Internet Cohen2001 ; Doyle2005 ; Matray2012 . In many cases, nodes are spatially embedded according to the spatial coordinates of the elements Araujo2002 ; Gallos2012 . This simplification allows us to focus on the topological aspects of the system and to easily extend our results to many applications. We characterize the robustness of a network as its capacity to maintain global connectivity under a sequence of node removals and describe a strategy based on local cooperation to improve robustness under possibly realistic constraints. We discover a continuum transition when changing the distance for which nodes are allowed to swap links, a cooperation range. We calculate the critical exponents of this transition and show that the key factor controlling the value of the critical exponents is the exponent of the algebraic decay of the connection probability with the node distance.
As an ubiquitous infrastructure system, we explain our method in the context of the worldwide air-transportation network (WAN), though our results impact the whole class of spatially embedded networks. It is paramount that the WAN works in an extremely reliable and efficient fashion, as any temporary airspace closure, such as the one caused by the eruption of the volcano Eyjafjallajökull in 2010, may cause huge losses worldwide ICAO2012 ; BBC2010 .
Complex Networks have been used to study airflight networks. Simple abstractions of flights and airports have been used to characterize its robustness Chi2004 ; Cardillo2013b , study its structural properties Guimer2004 ; Li2004b ; Guimera2005 ; Donetti2006 ; Wu2006 ; Bagler2008 ; Gautreau2009 ; Cardillo2013a ; Pyrgiotis2013 ; Verma2014 and evolution Zhang2010 ; Li2010 . Here instead we go one step further and propose modifications to the robustness of the WAN and identify new properties associated with it. We summarize data provided by OpenFlights in the year 2011 as a single static network with airports (nodes, modeled as points distributed across the surface of a sphere with distance calculated according to the Haversine formula) and around eighteen thousand links Patokallio2014 . Links are undirectional, assuming that each flight should return to its origin, and weighted according to the number of possible flights between two airports. Airports are weighted by the total number of passengers transported that year. Information regarding the number of passengers transported between airports is not available.
As a self-organized system, in which preferential attachment is expected to play a pivotal role, the WAN is quite fragile to targeted attacks, i.e., intentional removal of the most connected nodes causing the collapse of the giant connected component Verma2014 . The aim of our optimization strategy is to create a robust yet economically feasible WAN. Since robustness can be defined in different ways, we consider that a robust WAN should be capable of transporting passengers even in face of a targeted attack, in contrast with previous works where only the size of the largest connected component is considered Schneider2011 ; Herrmann2011 ; Wu2011 ; Peixoto2012 ; Louzada2012a ; Louzada2013a . We simulate a sequence of airport closures (node removal) and quantify robustness as:
| (1) |
where is the total number of nodes, is the number of nodes removed from the network, and is the number of passengers in the largest component after a fraction of nodes were removed, i.e., the sum of nodes’ weight on the largest component. Closures are executed from the most to the least connected node.
The location of airports are mostly determined by economical forces, such as to cater to local demands. In many cases, airports are located within a short distance from each other, sometimes only a few kilometers away as, e.g., airports in the Schenzen-Hong Kong area, or a few hundred kilometers but still easily reachable, such as the airports in the northeast of the United States. We assume that a flight rerouted to an airport within a cooperation range of the original destination has a similar attractiveness. If need be, a passenger landing at a different airport could easily take another means of transportation, such as the local train network or a shuttle bus, to go to the desired destination. For transportation networks, the cooperation range is defined as the geographical distance between nodes, but other spatial networks might require other metrics, such as travel time or cost.
We increase network robustness through link swaps, with the probability to swap a route inversely proportional to the weight of a link between airports and , so that important connections are affected with less priority. This tends to keep the transportation capacity of the system stable, and the introduction of complicated interventions on airports, such as building new runaways, might be avoided. Moreover, a connection is only rerouted to an airport within the cooperation range of the original destination. As an example, flights could be distributed between Hong Kong and Schenzen or among the airports surrounding London.
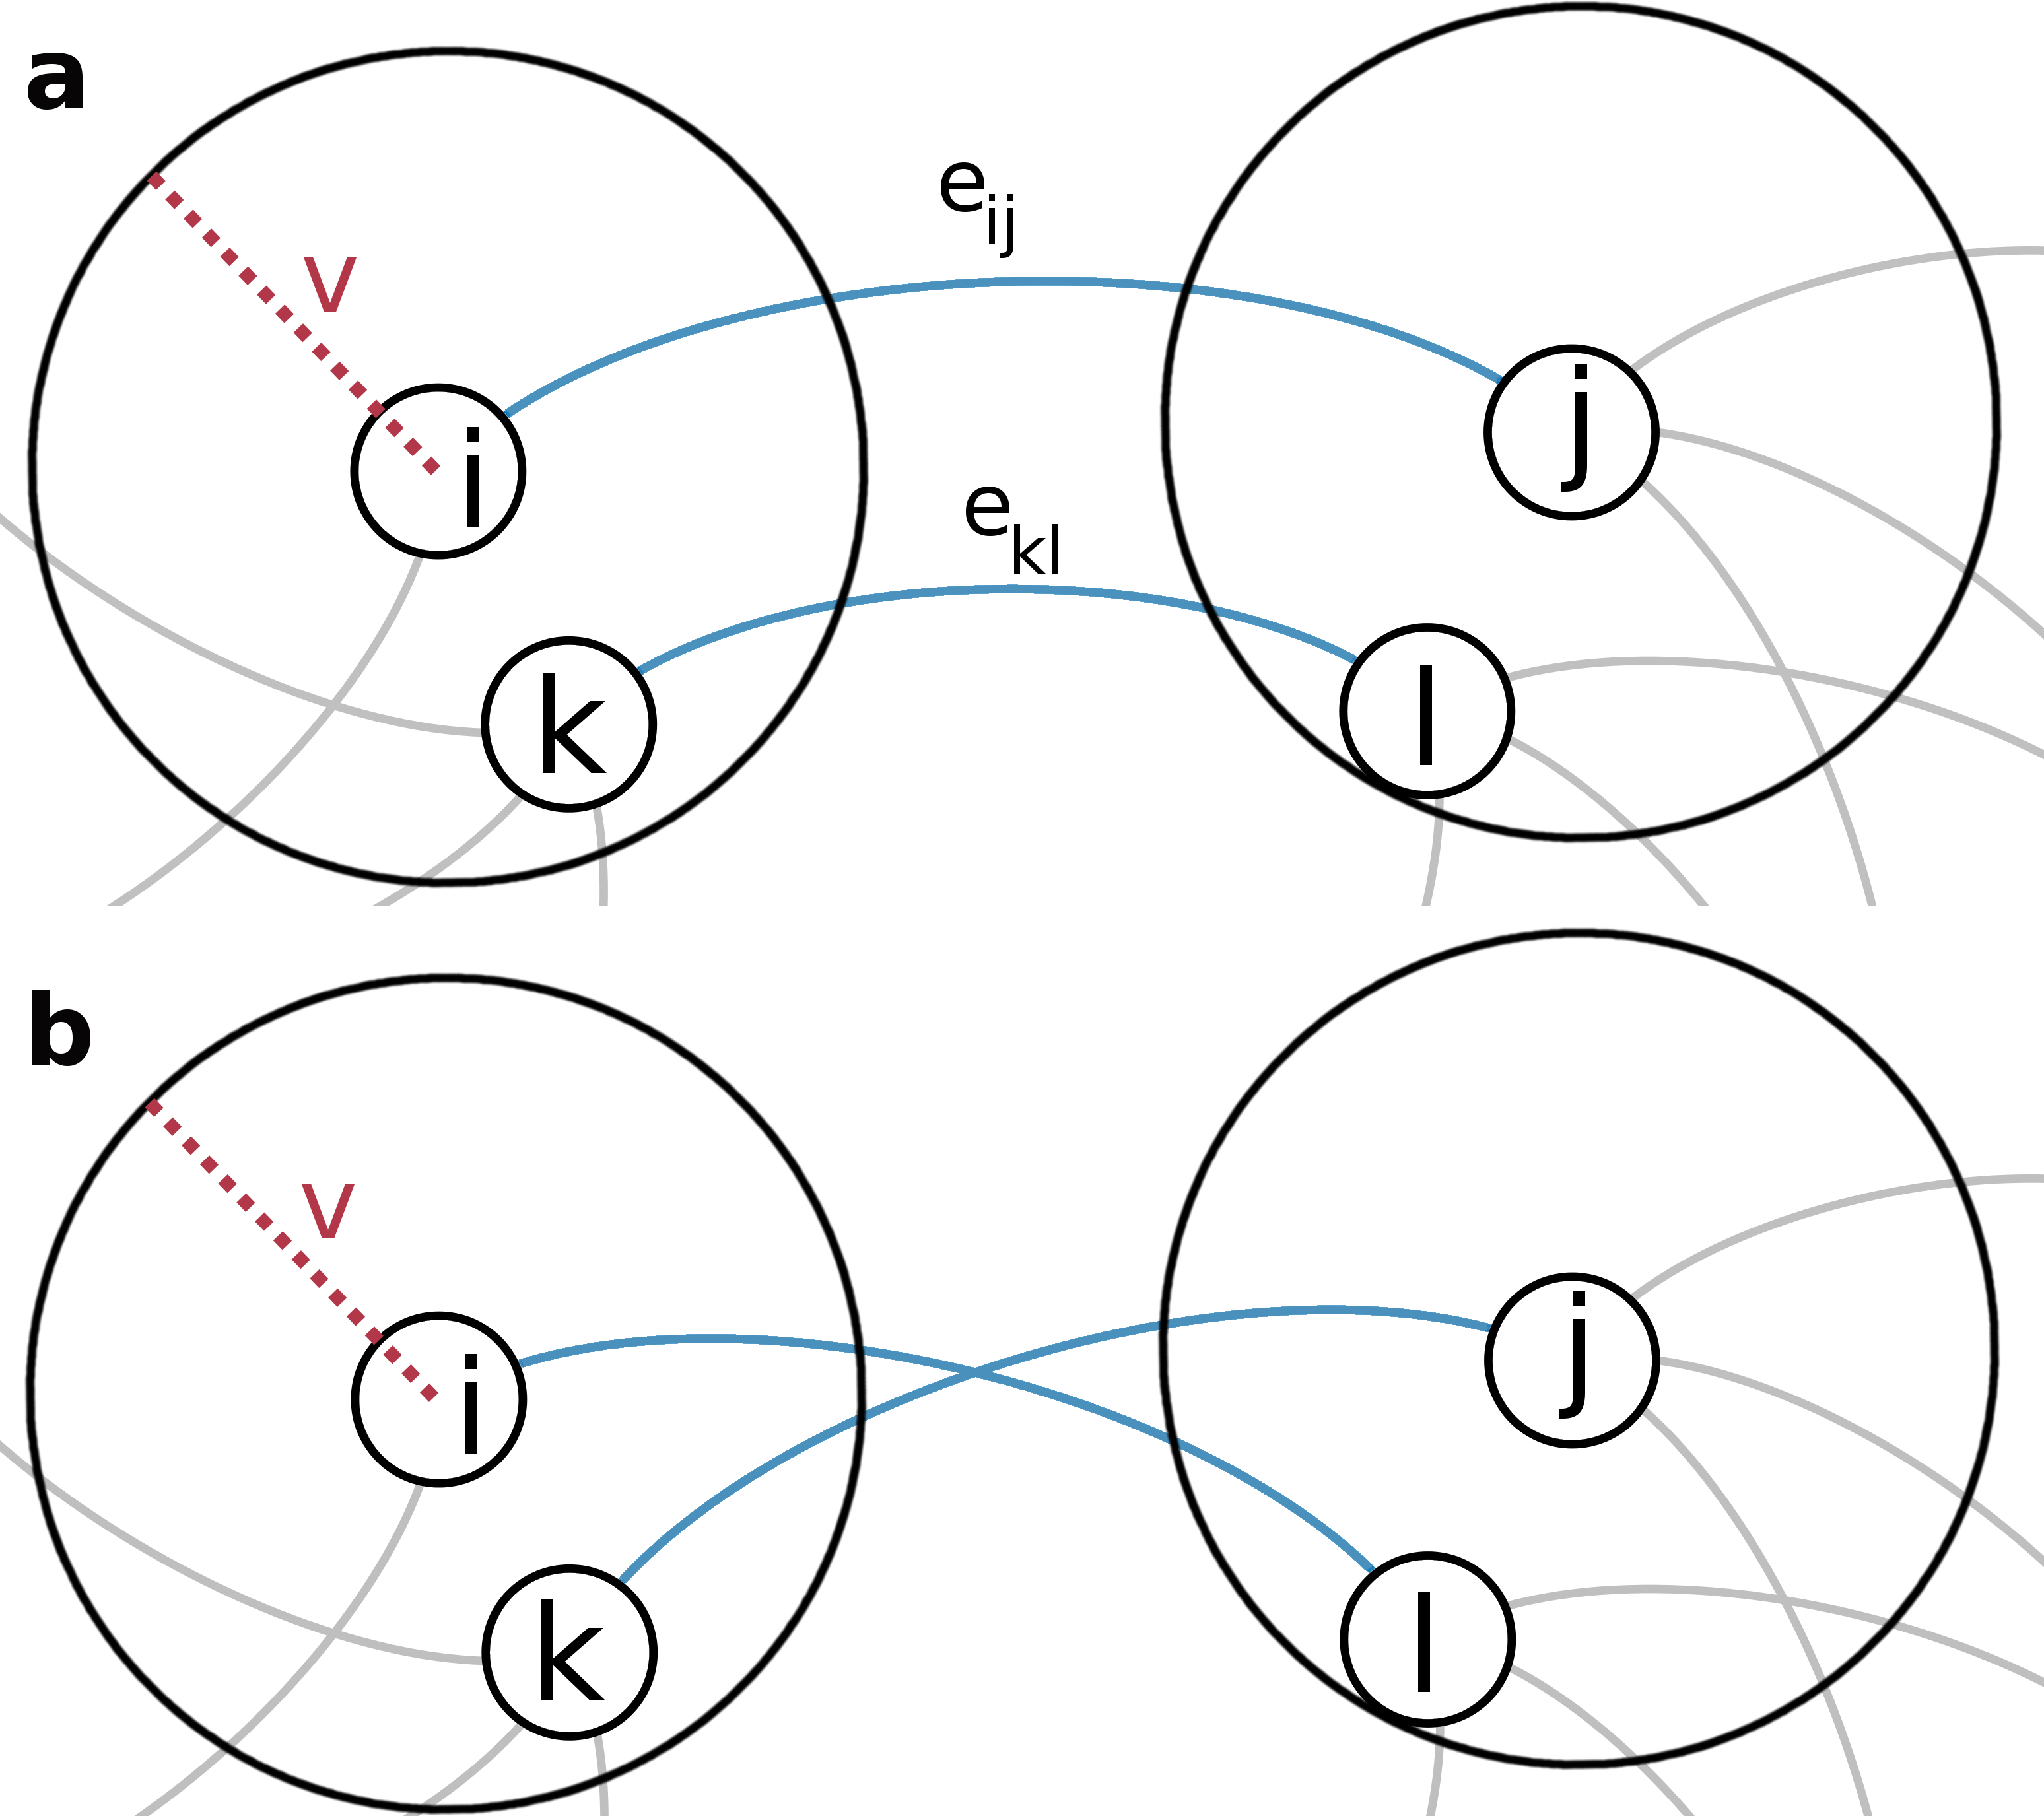
Given a cooperation range and a metric , which calculates the distance between nodes and , the following swap strategy is performed:
-
1.
Select a node randomly having at least one neighbor;
-
2.
Select a neighbor of node with probability inversely proportional to the weight of ;
-
3.
Select a pair of connected nodes and so that and with probability inversely proportional to the weight of ;
-
4.
Remove links and and create links and .
This strategy is illustrated in Fig. 1. Swaps change the network robustness but we only perform swaps that increase . From this point on, we call such a swap, a geo swap. A fixed number of geo swaps of the order of the number of links is executed. To compare networks of different sizes and populations, we normalize the robustness as , in which is the value of for km, the minimum value for which a geo swap will be considered in the WAN, and the maximum robustness obtained for km, which is approximately half of the planet perimeter. This strategy builds on top of previous work which focused on different acceptance mechanisms Herrmann2011 ; Louzada2012a or topological characteristics Louzada2013a , but differs significantly by focusing on geographic limitations and low-weight links.
Results
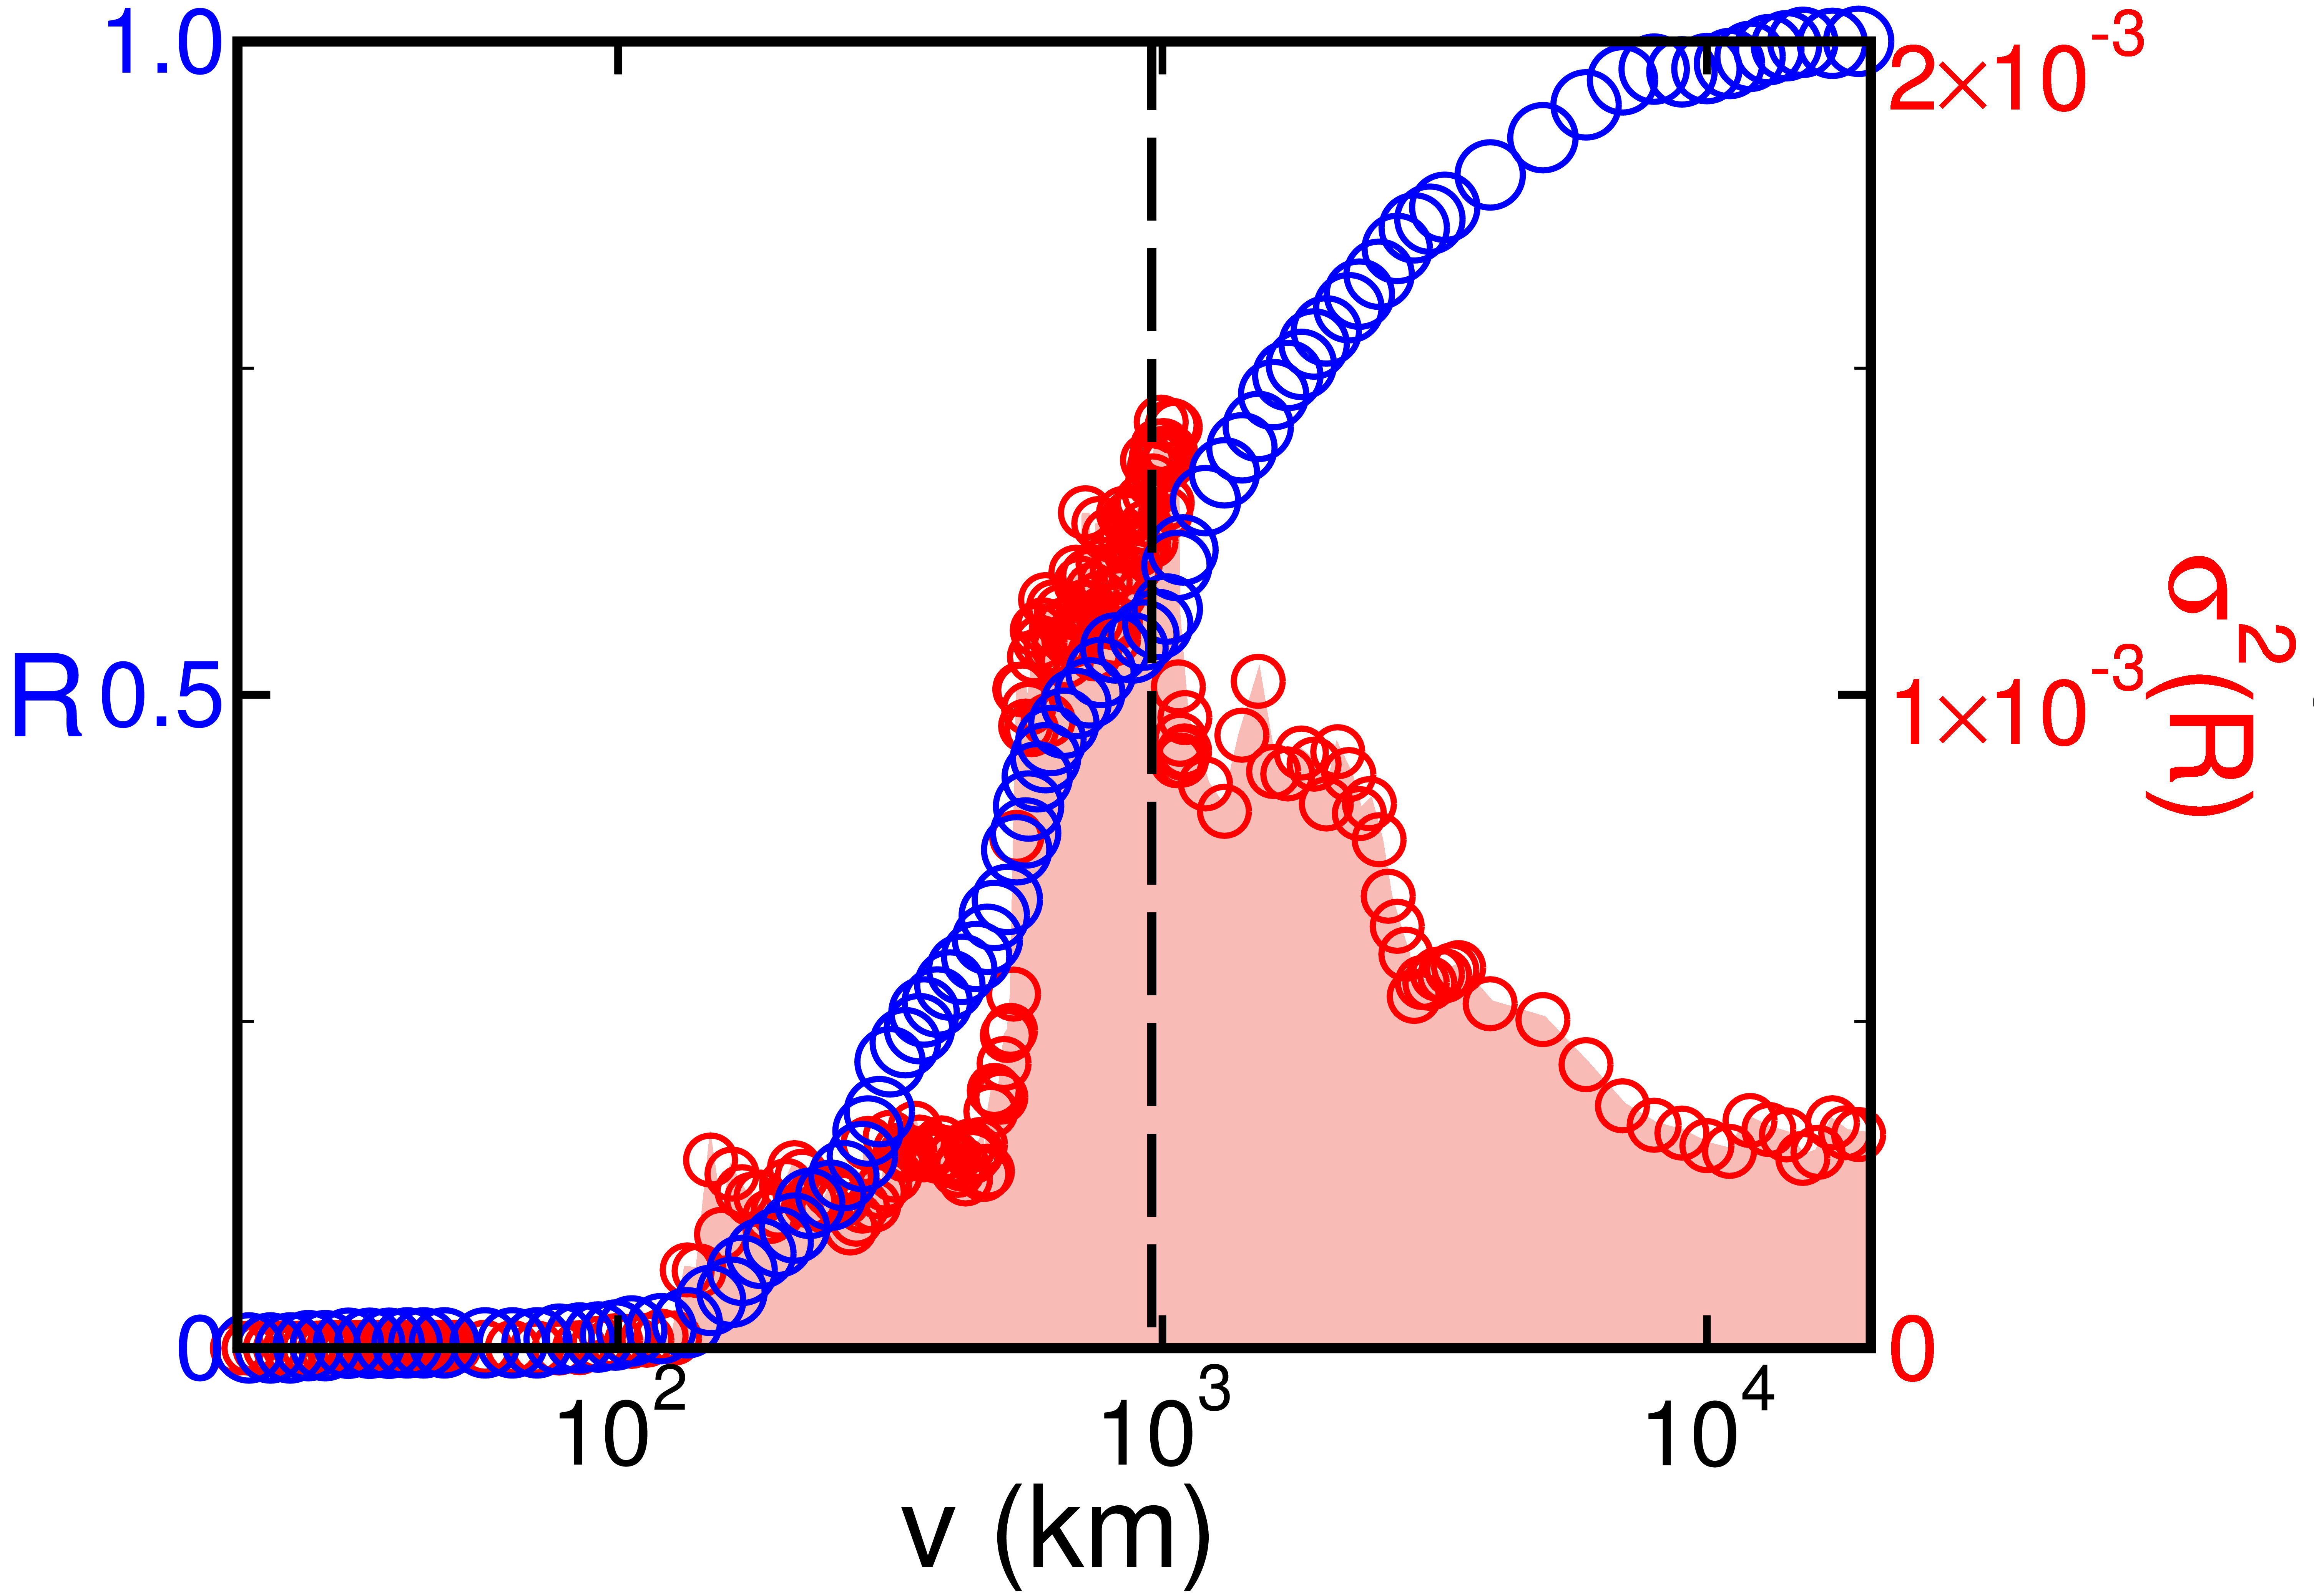
The cooperation range limits the area of possible swaps to guarantee that a geographically acceptable change is performed. A too small value of does not provide sufficient room for robustness improvement. While a too large value of leads to reroutes of connections to impractically far away airports. By tuning the values of , we observe a critical value of the cooperation range km at which a significant improvement in the WAN is first registered. This range in fact yields the highest variance of robustness increase among all possibilities, as shown in Fig. 2.
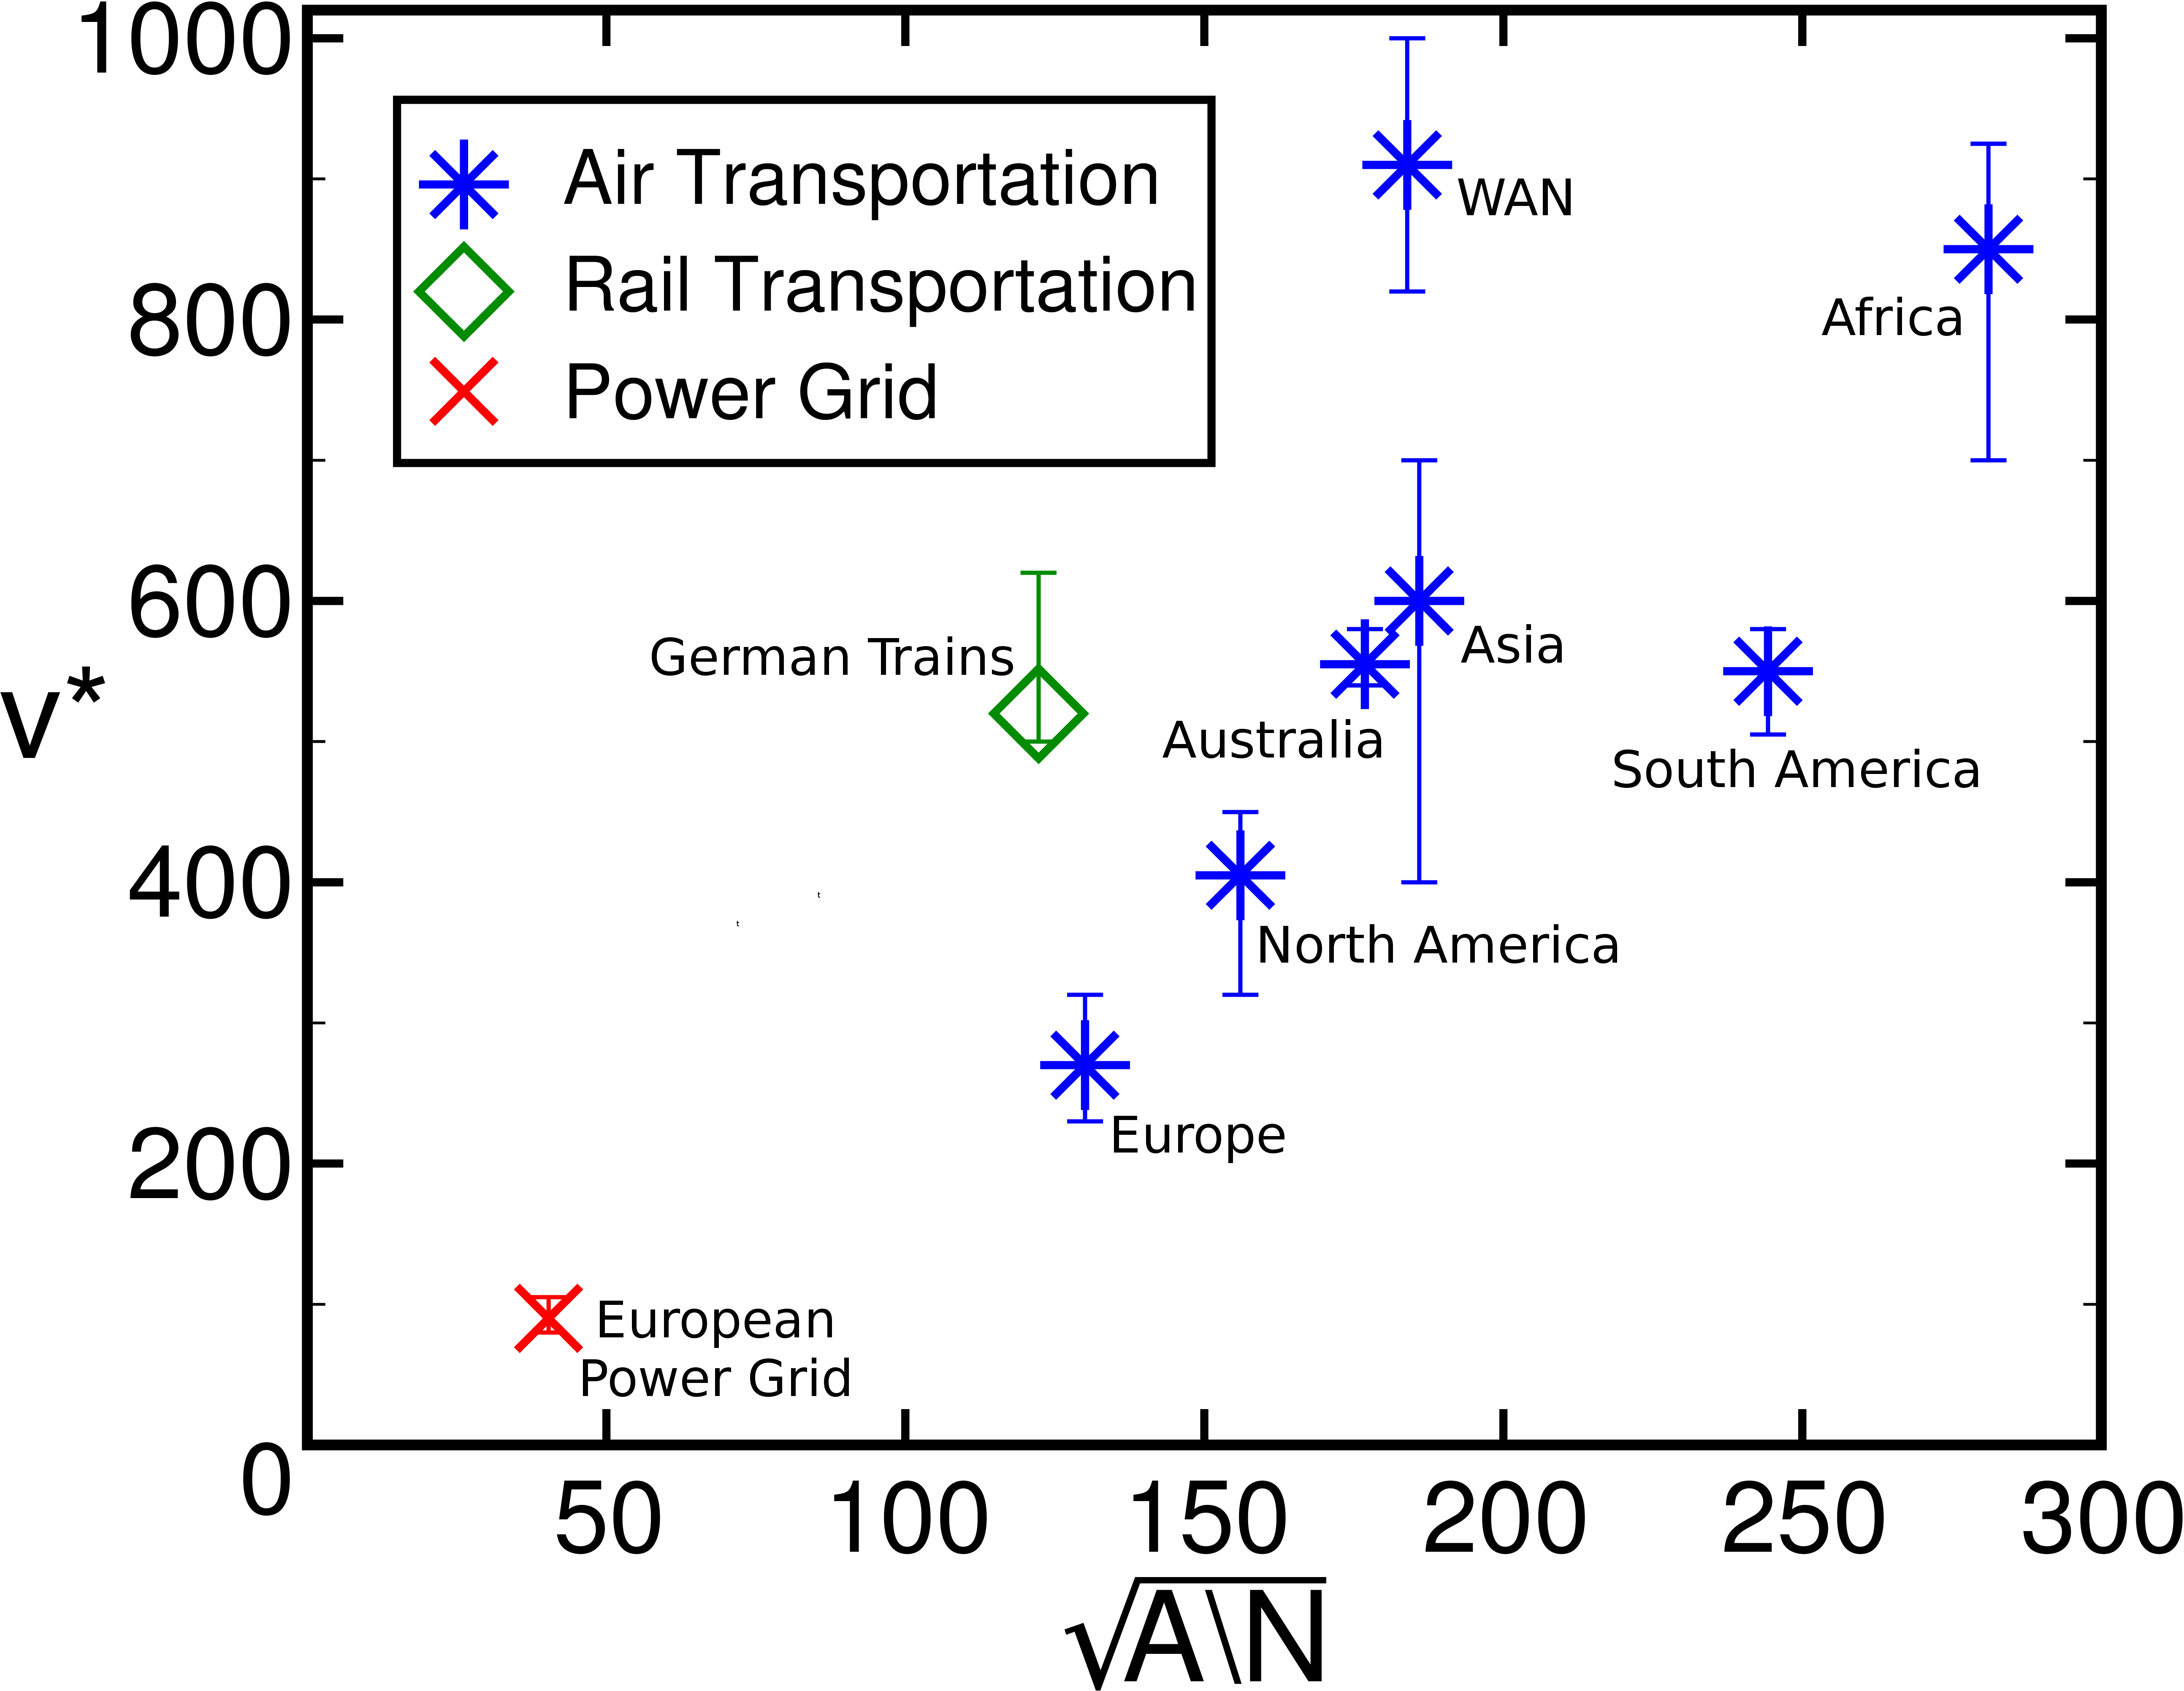
By considering continental airflight networks - constructed from the division of the WAN into continents (details in S1 Table) - together with other spatially embedded networks (the European Power Grid and the European Rail network), we observe that is positively correlated with (Spearman’s correlation coefficient ), where is the total area in which the nodes are embedded (Fig. 3). Being the combination of local and intercontinental flights, the WAN lies slightly off the trend, but in general we can conclude that the typical radius served by an airport is correlated to the minimum distance at which swaps become effective. Artificially generated random networks also confirm this relationship (S1 Figure). Other topological characteristics of the optimized networks are detailed in S4 Figure.
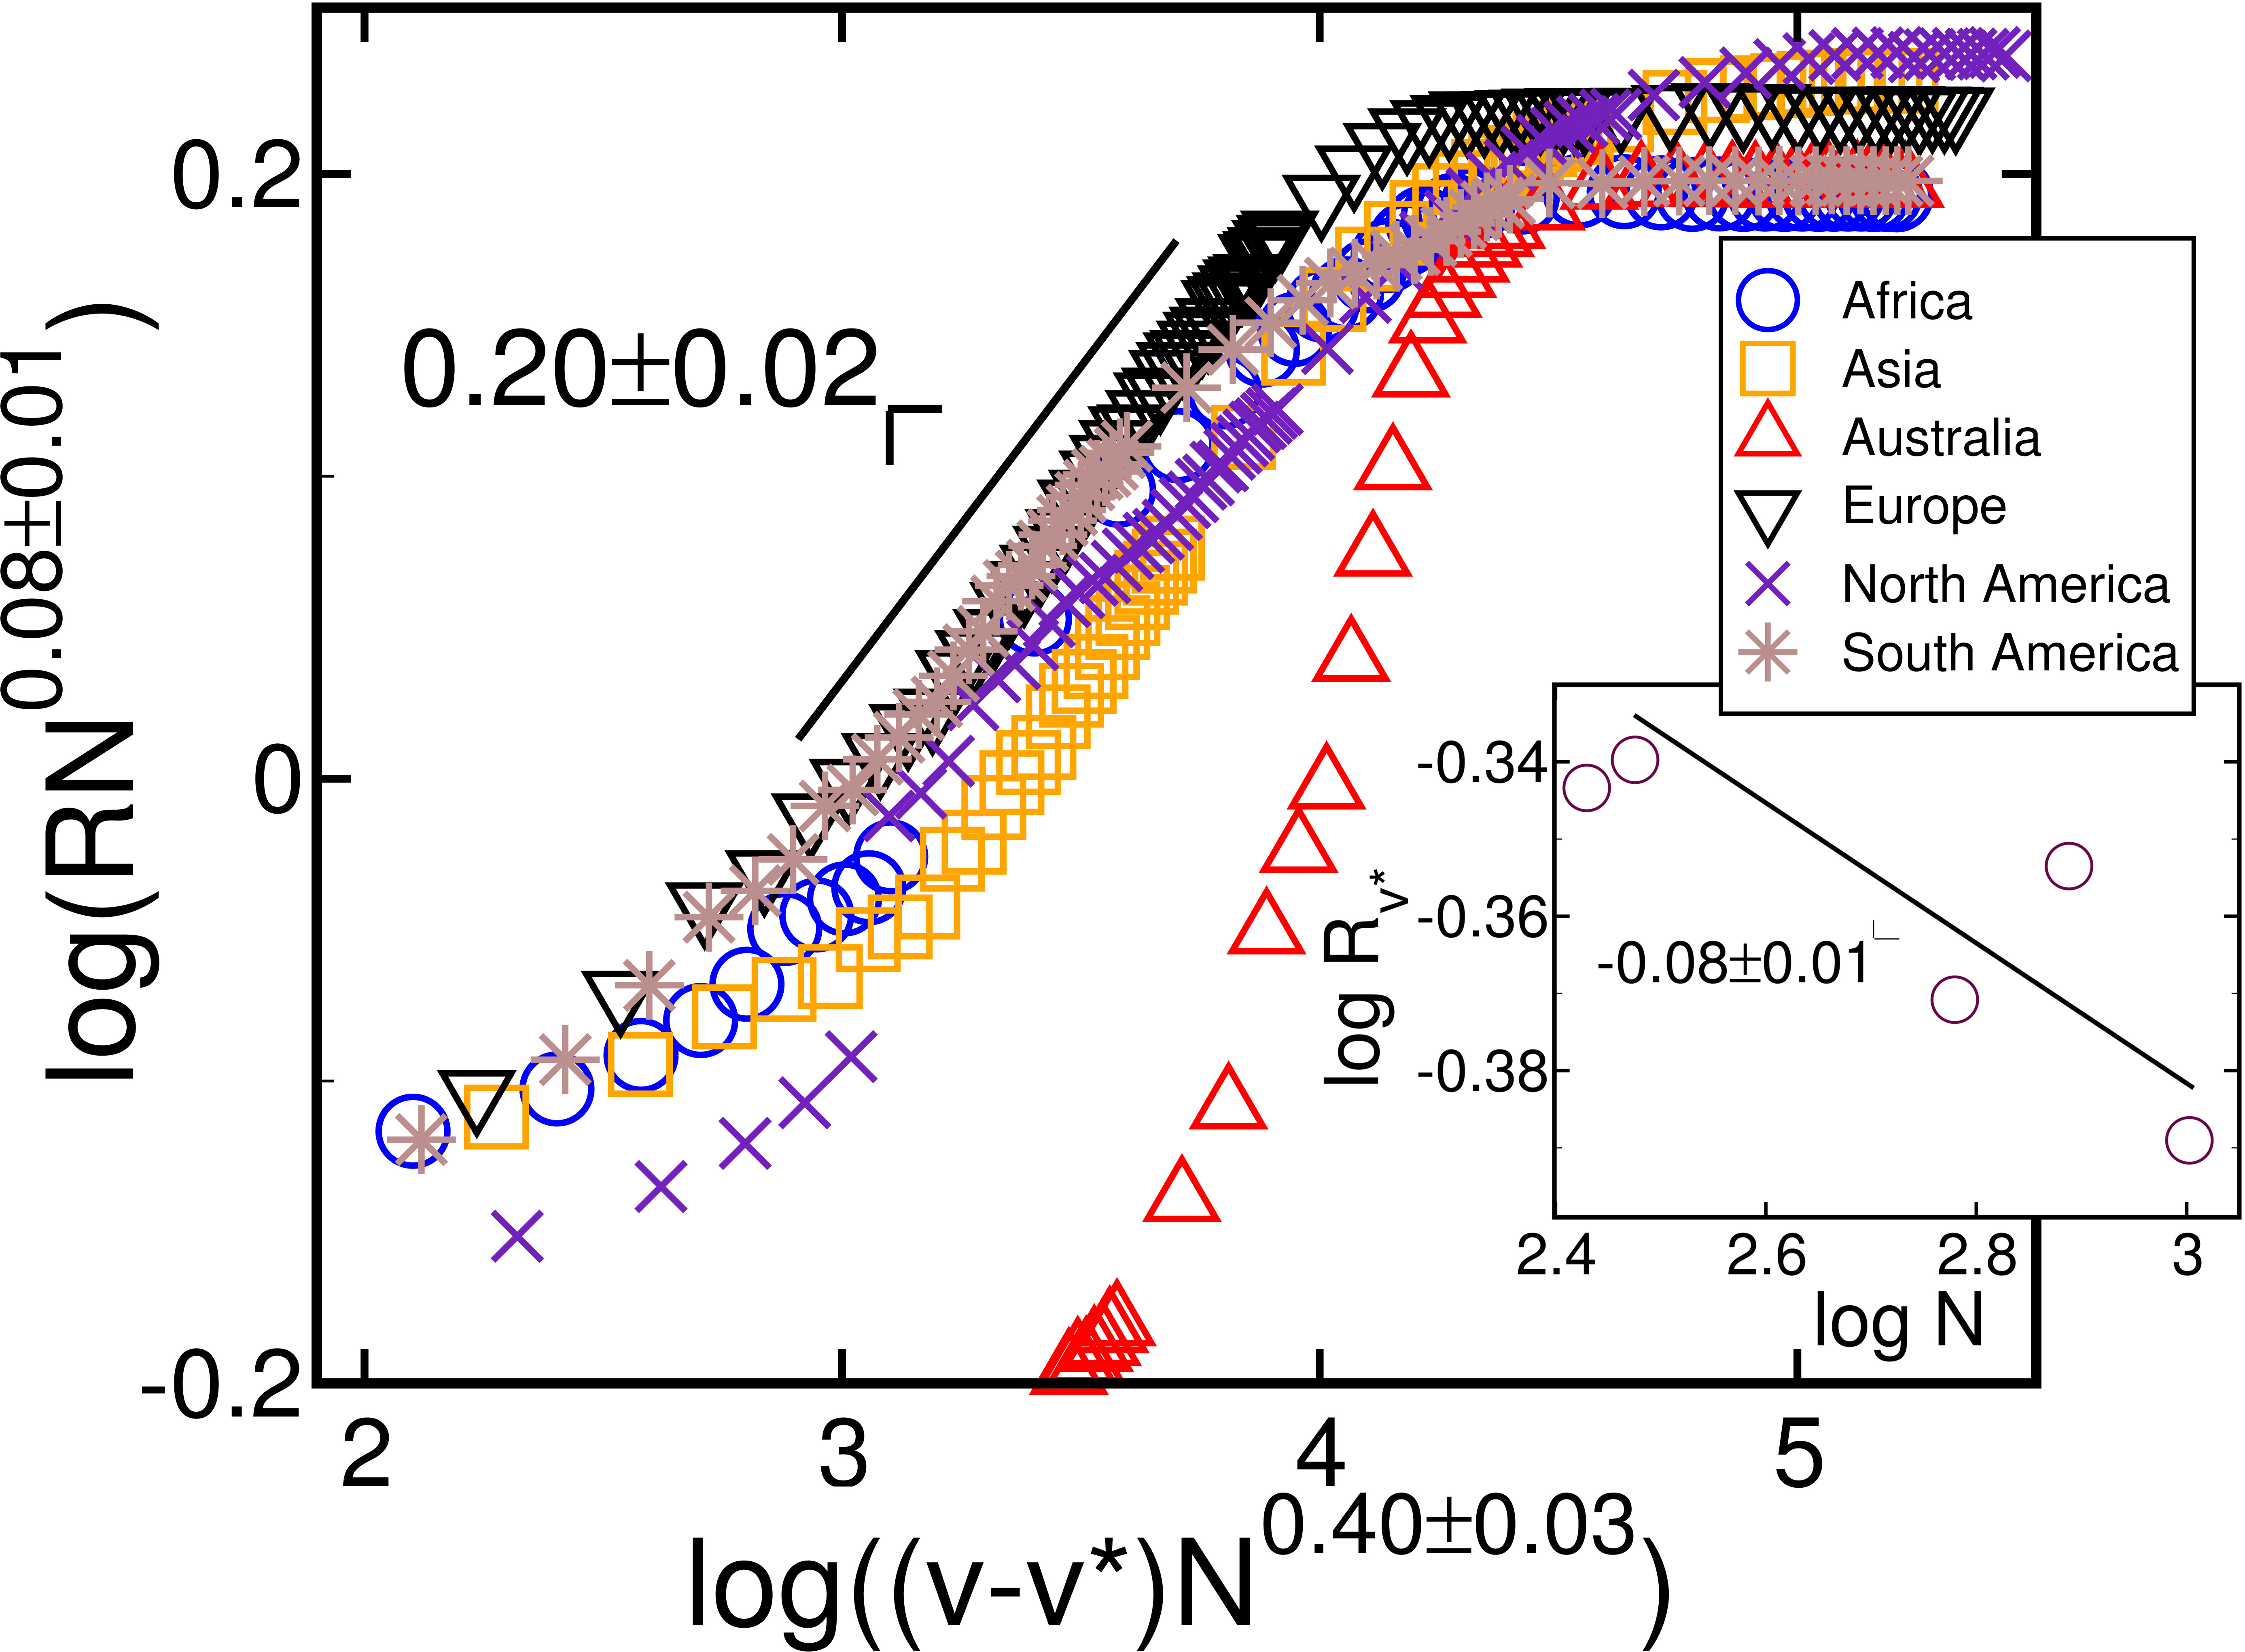
Close to the critical cooperation range, the evolution of scales with for the continental networks. Applying the finite-size scaling,
| (2) |
where and are critical exponents and is a scaling function, we collapse the data for different system sizes. For , as shown in the inset of Fig. 4, scales with , with , as expected for a continuous transition. This allows us to calculate the exponents in the main panel of Fig. 4 as and . The data suggest that the construction of airports and the creation of connections follow a similar mechanism in all continents, though the limited system size of each continent and obvious geographic differences prevent strong conclusions. However, data for Australia significantly differs from the others. Because a great number of islands in Oceania have many small airports, sometimes being the only feasible connection between remote areas, we assume that airports and flights in this continent were established following a different mechanism. Most probably, the predominance of several small islands might pose a physical limit to the cooperation range which is related to the average distance between islands.
Spatial networks are mainly defined by three properties: nodes’ position, degree distribution, and connection pattern. A simplified model - where nodes are assigned random positions, the degree distribution is a Poisson distribution, and connections are randomly assigned without any spatial/degree bias - displays different critical exponents (S3 Figure). However, if the probability that nodes and are connected decays algebraically with the distance between and ,
| (3) |
where is the decay exponent, we obtain exponents that are numerically consistent with the ones in Fig. 4. Based on a simplification of the gravity model, used to describe connections between geographically distributed nodes Erlander1990 ; Balcan2009 ; Krings2009 ; Kaluza2010 , we call Eq. (3) a distance-decay model as it does not take into account the degree/weight of the nodes to calculate .
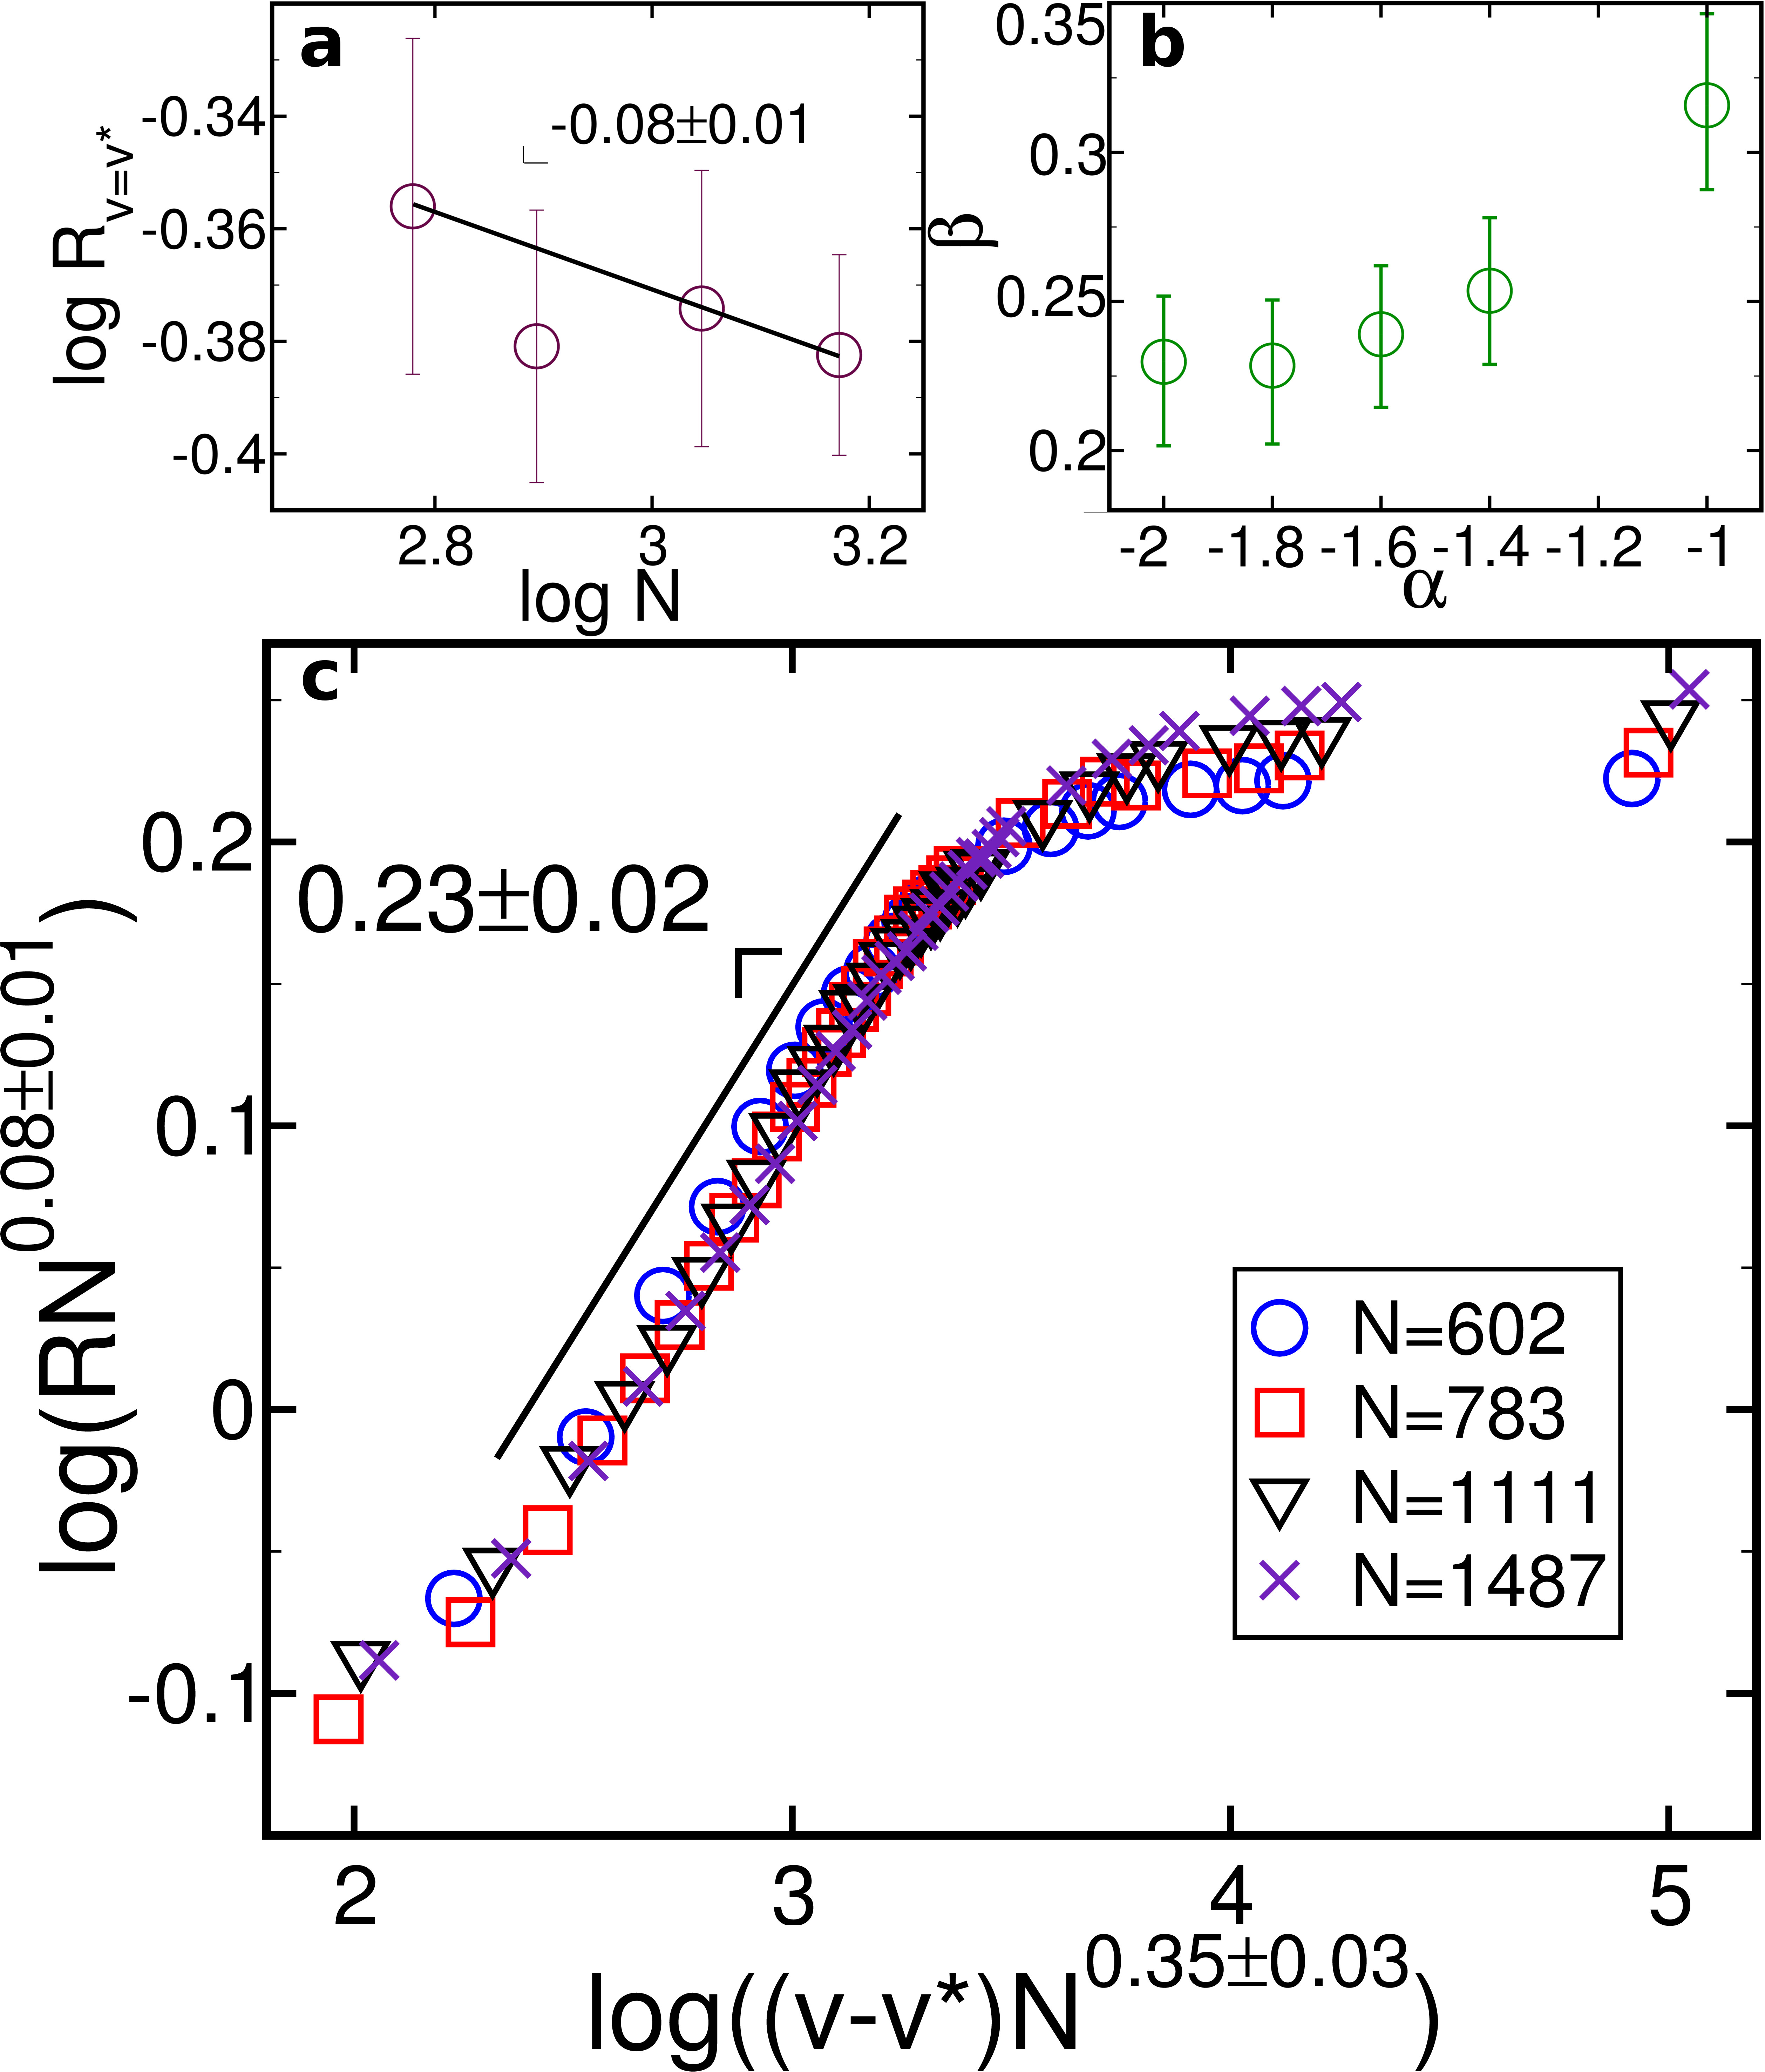
To test Eq. (3), we plot a new data-collapse in Fig. 5 based on networks generated as follows. Node positions are uniformly distributed across an Earth spherical cap of area and in order to keep , the same value of the WAN, network size is calculated accordingly. Node degree follows a Poisson distribution of average degree . Node weights are chosen according to the equation , where is the degree of node , which is a fit of the relationship between node weights and degree of the WAN. Link weights are randomly distributed from , in which is the maximum link weight on the WAN. We observe that changes in the value of affect consistently the slope in the data-collapse (Fig. 5b). We find a value of similar to the one of the continents, without Australia, for . For , the finite-size scaling in Fig. 5c allows us to estimate: and (Fig. 5a and Fig. 5c). Further analysis also show that when the ratio between the average length of routes and the average distance between two airports is similar to that found for the continents (S2 Figure). Interestingly, the empirical probability distribution of link lengths in the WAN is a power law of exponent (S5 Figure). This suggests that correlations as the ones developed in the distance-decay model are consistent with the ones found for the WAN and characteristic for the universality class.
Discussion
In order to provide applicable insights, any network modification strategy should take into account realistic constraints naturally imposed by the problem. The geo swap contains a simple set of rules specifically designed to improve the robustness of spatial networks. It is important to note however that a probabilistic approach is more a guidance than a closed optimization recipe. We expect that future procedures built on top of our strategy should be carefully tailored to the underlying system.
In an infrastructure perspective, the geo swap, which makes flights land in different airports, has two crucial implications. Firstly, a second transportation system should be used to connect nearby airports, in line with recent works dealing with the coupling of infrastructure networks DAgostino2014 . By taking into account the critical cooperation range these couplings could be designed or improved for distances close to . Secondly, a local level of cooperation is necessary between airports. Flights in Schenzen and Hong Kong could be rerouted to attend different yet nearby airports worldwide, further increasing the reliability of the local service and the overall WAN robustness.
One could also organically extended our analysis to incorporate airlines into the scenario. The already existing alliances within the airline industry do cooperate on a regular basis. This direction could be pursued by future works if data about alliances among airlines is available.
Our rewiring strategy is also able to show that the continents, with one exception, follow the same universality class regarding robustness improvements, as the probability that two airports are connected decays quadratically with their distance. Being a continent with its own geographical idiosyncrasies, Australia does not fit our analysis, for which further studies are necessary. In summary, our results show that, for any spatial network, the universality class of the robustness improvement strongly depends on the spatial correlation of connected nodes.
Methods
Figure 2 results from the application of tentative geo swaps for each value of in the WAN. Each blue circle is the average over samples while red circles stand for the variance over samples.
In Fig. 3, data for the European Power Grid (red) is retrieved from Ref. Zhou2005 and the Rail transportation network was manually assembled using public data. The power grid network has nodes and links, and the rail network has nodes and links. For continents, the power grid, and the rail network, a total of tentative geo swaps are executed for several cooperation range values. The value of is selected as the highest variance point over samples, with error bars representing the values where variance is equal to . The same data for the continents is used to construct Fig. 4, in which symbols are larger than the standard deviation.
For all panels in Fig. 5, a maximum of tentative geo swaps are executed for several cooperation ranges. Each point represents the average over samples, with symbols being larger than standard deviation in Panel c. The critical cooperation range is defined as km.
Acknowledgements.
Acknowledgments. Authors would like to thank the CNPq, Conselho Nacional de Desenvolvimento Científico e Tecnológico - Brasil, the European Research Council advanced grant FP7-319968-flowCSS, and the ETH Zurich Risk Center for financial support. NA acknowledges financial support from the Portuguese Foundation for Science and Technology (FCT) under Contract no. IF/00255/2013. We would also like to thank I. Nikolakopoulos and K. J. Schrenk for providing the caffeine for the discussion in which the idea of this paper was conceived.References
- (1) Yglesias M. China’s Sensible Infrastructure Boom. Slate. 28 Nov 2013. Available: http://goo.gl/wBSA0B. Acessed 4 December 2013.
- (2) Calder S. Shenzhen airport Terminal Three: Vast, shiny, new and empty? China’s latest temple to aviation opens. The Independent. 28 Nov 2013. Available: http://goo.gl/XFMr5L. Acessed 4 December 2013.
- (3) Albert R, Albert I, Nakarado G. Structural vulnerability of the North American power grid. Phys Rev E. 2004;69: 025103.
- (4) Kim D, Motter AE. Resource allocation pattern in infrastructure networks. J Phys A-Math Theor. 2008;41: 224019.
- (5) Motter AE, Myers SA, Anghel M, Nishikawa T. Spontaneous synchrony in power-grid networks. Nat Phys. 2013;9: 1–7.
- (6) Kaluza P, Kölzsch A, Gastner MT, Blasius B. The complex network of global cargo ship movements. J R Soc Interface. 2010;7: 1093–1103.
- (7) Cohen R, Erez K, Ben-Avraham D, Havlin S. Breakdown of the Internet under Intentional Attack. Phys Rev Lett. 2001;86: 3682.
- (8) Doyle JC, Alderson DL, Li L, Low S, Roughan M, et al. The ”robust yet fragile” nature of the Internet. P Natl Acad Sci USA. 2005;102: 14497–502.
- (9) Mátray P, Hága P, Laki S, Vattay G, Csabai I. On the spatial properties of internet routes. Comput Netw. 2012;56: 2237–2248.
- (10) Araújo A, Moreira AA, Makse HA, Stanley HE, Andrade Jr, JS. Traveling length and minimal traveling time for flow through percolation networks with long-range spatial correlations. Phys Rev E. 2002;66: 046304.
- (11) Gallos LK, Makse HA, Sigman M. A small world of weak ties provides optimal global integration of self-similar modules in functional brain networks. P Natl Acad Sci USA. 2012;109: 2825–2830.
- (12) Annual Passenger Total Approaches 3 Billion According to ICAO 2012 Air Transport Results. ICAO. 18 Dec 2012. Available: http://goo.gl/LCgb5f. Accessed 18 June 2013.
- (13) Flight disruptions cost airlines $1.7bn, says IATA. BBC News. 21 Apr 2010. Available: http://news.bbc.co.uk/2/hi/business/8634147.stm. Accessed 19 June 2013.
- (14) Chi LP, Cai X. Structural Changes Caused By Error and Attack Tolerance in Us Airport Network. Int J Mod Phys B. 2004;18: 2394–2400.
- (15) Cardillo A, Zanin M, Gómez-Gardeñes J, Romance M, García AJ, et al. Modeling the multi-layer nature of the European Air Transport Network: Resilience and passengers re-scheduling under random failures. Eur Phys J-Spec Top. 2013;215: 23–33.
- (16) Guimerà R, Amaral LAN. Modeling the world-wide airport network. Eur Phys J B. 2004;38: 381–385.
- (17) Li W, Cai X. Statistical analysis of airport network of China. Phys Rev E. 2004;69: 046106.
- (18) Guimerà R, Mossa S, Turtschi A, Amaral LAN. The worldwide air transportation network: Anomalous centrality, community structure, and cities’ global roles. P Natl Acad Sci USA. 2005;102: 7794–7799.
- (19) Donetti L, Neri F, Muñoz MA. Optimal network topologies: expanders, cages, Ramanujan graphs, entangled networks and all that. J Stat Mech. 2006;P08007.
- (20) Wu Z, Braunstein L, Colizza V, Cohen R, Havlin S, et al. Optimal paths in complex networks with correlated weights: The worldwide airport network. Phys Rev E. 2006;74: 056104.
- (21) Bagler G. Analysis of the airport network of India as a complex weighted network. Physica A. 2008;387: 2972–2980.
- (22) Gautreau A, Barrat A, Barthélemy M. Microdynamics in stationary complex networks. P Natl Acad Sci USA. 2009;106: 8847–52.
- (23) Cardillo A, Gómez-Gardeñes J, Zanin M, Romance M, Papo D, et al. Emergence of network features from multiplexity. Scientific Reports. 2013;3: 1344.
- (24) Pyrgiotis N, Malone KM, Odoni A. Modelling delay propagation within an airport network. Transport Res C-Emer. 2013;27: 60–75.
- (25) Verma T, Araújo NAM, Herrmann HJ. Revealing the structure of the world airline network. Scientific Reports. 2014;4: 5638.
- (26) Zhang J, Cao X, Du W, Cai K. Evolution of Chinese airport network. Physica A. 2010;389: 3922–3931.
- (27) Li G, Reis SDS, Moreira AA, Havlin S, Stanley HE, et al. Towards Design Principles for Optimal Transport Networks. Phys Rev Lett. 2010;104: 018701.
- (28) Patokallio J. Database for flight logging, mapping, stats, and sharing. OpenFlights. 01 July 2013. Availabe: http://OpenFlights.org. Acessed 1 July 2013.
- (29) Schneider CM, Moreira AA, Andrade Jr JS, Havlin S, Herrmann HJ. Mitigation of malicious attacks on networks. P Natl Acad Sci USA. 2011;108: 3838–3841.
- (30) Herrmann HJ, Schneider CM, Moreira AA, Andrade Jr JS, Havlin S. Onion-like network topology enhances robustness against malicious attacks. J Stat Mech. 2011;P01027.
- (31) Wu Z, Holme P. Onion structure and network robustness. Phys Rev E. 2011;84: 026106.
- (32) Peixoto TP, Bornholdt S. Evolution of Robust Network Topologies: Emergence of Central Backbones. Phys Rev Lett. 2012;109: 118703.
- (33) Louzada VHP, Daolio F, Herrmann HJ, Tomassini M. Generating Robust and Efficient Networks Under Targeted Attacks. In: Krol D, Fay D, Gabrys B, editors, Propagation Phenomena in Real World Networks, Berlin: Springer; 2014.
- (34) Louzada VHP, Daolio F, Herrmann HJ, Tomassini M. Smart rewiring for network robustness. J Comp Netw. 2013;1: 150–159.
- (35) Erlander S, Stewart NF. The Gravity Model in Transportation Analysis. Utrecht: VSP; 1990.
- (36) Balcan D, Colizza V, Gonc B, Hu H, Ramasco JJ, et al. Multiscale mobility networks and the spatial. P Natl Acad Sci USA. 2009;106: 21484–21489.
- (37) Krings G, Calabrese F, Ratti C, Blondel VD. Urban gravity: a model for inter-city telecommunication flows. J Stat Mech. 2009;L07003.
- (38) D’Agostino G, Scala A, editors. Networks of Networks: The Last Frontier of Complexity. Heidelberg: Springer; 2014.
- (39) Zhou Q, Bialek J. Approximate Model of European Interconnected System as a Benchmark System to Study Effects of Cross-Border Trades. IEEE T Power Syst. 2005;20: 782–788.
- (40) Newman M. Mixing patterns in networks. Phys Rev E. 2003;67: 026126.
- (41) Pastor-Satorras R, Vasquez A, Vespignani A. Dynamical and correlation properties of the Internet. Phys Rev Lett. 2001;87: 258701.
- (42) Barrat A, Barthélemy M, Pastor-Satorras R, Vespignani A. The architecture of complex weighted networks. P Natl Acad Sci USA. 2004;101: 3747–52.
- (43) Newman M, Girvan M. Finding and evaluating community structure in networks. Phys Rev E. 2004;69: 026113.
See pages 1,1 of supplementalArxiv.pdf See pages 2,2 of supplementalArxiv.pdf See pages 3,3 of supplementalArxiv.pdf See pages 4,4 of supplementalArxiv.pdf See pages 5,5 of supplementalArxiv.pdf