Herschel††thanks: Herschel is an ESA space observatory with science instruments provided by European-led Principal Investigator consortia and with important participation from NASA.-PACS Measurements of Nitrogen Enrichment in Nebulae around Wolf-Rayet Stars
Abstract
For three nebulae that have early-WN Wolf-Rayet exciting stars, NGC 6888, WR 8 and Abell 48, we have obtained Herschel-PACS line scans of the [N iii] 57 µm and [O iii] 88 µm lines, along with the 122 and 205 µm lines of [N ii]. From the former two lines we have derived N2+/O2+ abundance ratios, equal to the overall N/O ratio under a wide range of nebular conditions. We find that all of the nebulae observed possess significant nitrogen enrichment, with derived N/O ratios greater than solar. The two nebulae with massive Wolf-Rayet exciting stars, NGC 6888 and WR 8 are found to have N/O ratios that are enhanced by factors of 7 - 10 relative to the solar N/O ratio, consistent with an origin as material ejected just before the onset of the Wolf-Rayet phase. The other nebula, Abell 48, has recently been reclassified as a member of the rare class of three planetary nebulae that have early-WN central stars and are not of Peimbert Type I. We derive a nebular N/O ratio for it that is a factor of 4 enhanced relative to solar and slightly above the range of N/O values that have been measured for the other three members of its [WN] planetary nebula class.
keywords:
stars: Wolf-Rayet, ISM: abundances, stars: mass-loss, stars: massive, stars: winds, outflows, circumstellar matter1 Introduction
Core-collapse supernovae from massive stars are known to dominate the production of oxygen and heavier -particle elements in galaxies but massive stars can make an important contribution to the nitrogen enrichment of the ISM during the early evolution of galaxies (Henry et al., 2000). This can happen via the ejection of nitrogen-enriched material that has been heavily processed by the CNO-cycle during their Luminous Blue Variable (LBV) and ensuing WN Wolf-Rayet (WR) stages.
Observational determinations of the quantities of nitrogen injected into the ISM by WN stars and/or their LBV precursors are limited in number. However, a subset of WR stars are surrounded by nebulae whose expansion ages, morphologies, and occasional abundance determinations (e.g. Esteban et al. 1992; Stock et al. 2011), show them to consist of nitrogen-rich material that has been recently ejected by the star; these are termed ‘ejecta nebulae’ (Chu 1991; Stock & Barlow 2010).
Amongst the small sample of known, or candidate, Wolf-Rayet ejecta nebulae, only a fraction have been probed spectroscopically and their abundances derived. Such efforts have been hampered by the high degree of extinction along their sight lines in the galactic plane. The usual suite of abundance determination methods (e.g. Torres-Peimbert & Peimbert 1977; Kingsburgh & Barlow 1994; Wesson et al. 2012) rely on complex empirical relationships to calibrate the densities, temperatures and ionization schemes used to derive reliable abundances. The main stumbling block for these schemes with respect to nebulae around hot, massive stars comes in the lack of optical transitions from some of the ionization states that are expected to dominate the ion populations. For example, nitrogen abundances in nebulae are commonly calculated using the [N ii] 6548/6584 Å doublet, however N+ is often not the dominant nitrogen ion, so ionization correction factors are employed to attempt to compensate. In addition heavy extinction by interstellar dust towards galactic plane WR stars typically means that the blue end of the optical spectrum is missing, and therefore abundance determinations cannot be easily made (e.g. Stock et al. 2011). At far-IR wavelengths the effect of dust extinction is essentially removed and the usually dominant ionization stages of oxygen and nitrogen (N2+ and O2+) have accessible fine structure lines whose low excitation energies render ionic abundances derived from them insensitive to the adopted nebular electron temperature.
Using the PACS instrument (Poglitsch et al., 2010) on the Herschel Space Observatory (Pilbratt et al., 2010), we have obtained spectral data cubes of various fine structure lines in the PACS wavelength range. For each source the [N iii] and [O iii] lines at 57 and 88 µm have been mapped, along with the [N ii] lines at 122 and 205 µm, which we will employ to test assumptions about a) density and b) the ionization structure.
Our Herschel program (OT2_dstock_3) covered two WR ejecta
nebulae (around WR 8 and WR 136, the latter’s nebula better known as NGC
6888) along with the PN A66 48 (henceforth Abell 48). At the time
of its PACS observations in 2012, Abell 48 was thought to have been generated by
a massive WR star but two recent studies have shown it to be a classical
PN, albeit one with a rare WN-type central star
(Todt
et al. 2013; Frew
et al. 2013).
2 Data
2.1 Target Selection
Our target sample of was drawn from the Wolf-Rayet ejecta nebula catalogue of Stock & Barlow (2010). A selection criterion was that the exciting WR star should have a spectral type of WN7 or earlier, or WC7 or earlier, in order that N2+ and O2+ would be the dominant ion stages of N and O, respectively (this is unlikely to be the case for later-type, lower-excitation WR central stars).
The ejecta nebula around WR 8 has been observed spectroscopically in the optical (Stock et al., 2011) but due to heavy reddening nebular temperature diagnostics were not available and so no reliable abundances could be derived. However the lower limits quoted by Stock et al. (2011) suggest that the nebula around WR 8 is heavily enriched in nitrogen. The spectral type of WR 8 (WC4/WN7) indicates that it is a transition star, believed to be changing from its nitrogen rich phase (WN) to its carbon rich phase (WC) (Crowther et al., 1995). As such the total amount of nitrogen in the nebula should be close to the total amount of nitrogen that will ever be ejected by this star.
The second target, NGC 6888, is one of the best known WR nebulae, having been studied in great detail by many authors (most recently by Fernández-Martín et al. (2012) who present a thorough review). It is thought to be the result of a major outflow of material whilst the parent star (WR 136; HD 192163; spectral type WN6h) was passing through a red giant phase (Marston, 1995).
The third target, the nebula PN Abell 48, has been found to possess an early-WN type central star (Wachter et al., 2010). More recent work (Todt et al. 2013; Frew et al. 2013) has shown that this object is actually much more likely to be a rare type of planetary nebula (PN), with a nitrogen rich low mass central star (of type [WN]) which mimics the spectral appearance of a more massive WN star. The exact subtype of the central star has been debated, with the Todt et al. (2013) study estimating it to be [WN 5] while Frew et al. (2013) estimated it to be [WN 4–5]. The arguments presented by Frew et al. (2013) to show that the central star is of low mass are twofold. Firstly, if it were a massive star it would be at a very large distance and the mass of the expelled material would be around 50 M☉, which is above the initial mass range for massive stars which are thought to become mid-WN subtypes (Crowther, 2007). Secondly, the increased distance would place the system behind the galactic bulge and therefore change the expected extinction dramatically, which is not confirmed by their spectra.
2.2 Observations
| Object | RAa | Decb | Chop Throw | ObsID | Date and Timec | Lines | Total Observing Time [s]d |
|---|---|---|---|---|---|---|---|
| WR 8 | 07 44 50.83 | -31 55 15.8 | - | 1342245246 | 2012-05-02 10:35:04 | [O iii] 88 µm, [N ii] 205 µm | 4646 |
| WR 8 sky | 07 44 17.68 | -31 52 10.6 | - | 1342245246 | 2012-05-02 10:35:04 | [O iii] 88 µm, [N ii] 205 µm | |
| WR 8 | 07 44 50.83 | -31 55 15.8 | - | 1342245247 | 2012-05-02 11:54:37 | [N iii] 57 µm, [N ii] 122 µm | 1577 |
| WR 8 sky | 07 44 17.68 | -31 52 10.6 | - | 1342245247 | 2012-05-02 11:54:37 | [N iii] 57 µm, [N ii] 122 µm | |
| A 48 | 18 42 46.92 | -3 13 17.2 | 1′ | 1342253738 | 2012-10-21 03:04:59 | [N iii] 57 µm, [N ii] 122, 205 µm | 2371 |
| A 48 | 18 42 46.92 | -3 13 17.2 | 1′ | 1342253739 | 2012-10-21 03:46:43 | [O iii] 88 µm | 814 |
| NGC 6888 (rim) | 20 12 39.02 | 38 26 55.1 | - | 1342256477 | 2012-12-06 13:36:56 | [O iii] 88 µm, [N ii] 205 µm | 2319 |
| NGC 6888 sky | 20 11 34.89 | 38 25 19.9 | - | 1342256477 | 2012-12-06 13:36:56 | [O iii] 88 µm, [N ii] 205 µm | |
| NGC 6888 (rim) | 20 12 39.02 | 38 26 55.1 | - | 1342256478 | 2012-12-06 14:17:45 | [N iii] 57 µm, [N ii] 122 µm | 1570 |
| NGC 6888 sky | 20 11 34.89 | 38 25 19.9 | - | 1342256478 | 2012-12-06 14:17:45 | [N iii] 57 µm, [N ii] 122 µm | |
| NGC 6888 (inner) | 20 11 56.02 | 38 21 40.1 | - | 1342256927 | 2012-12-09 15:51:16 | [O iii] 88 µm, [N ii] 205 µm | 1574 |
| NGC 6888 sky | 20 11 34.89 | 38 25 19.9 | - | 1342256927 | 2012-12-09 15:51:16 | [O iii] 88 µm, [N ii] 205 µm | |
| NGC 6888 (inner) | 20 11 56.02 | 38 21 40.1 | - | 1342256928 | 2012-12-09 16:19:46 | [N iii] 57 µm, [N ii] 122 µm | 2323 |
| NGC 6888 sky | 20 11 34.89 | 38 25 19.9 | - | 1342256928 | 2012-12-09 16:19:46 | [N iii] 57 µm, [N ii] 122 µm |
| Object | Line | Wavelength Range [µm] | Resolving Power | Repetitions | Exposure Time [s] |
|---|---|---|---|---|---|
| WR 8 | [N iii] 57 µm | 56.95 – 57.72 | 2800 | 3 | 225 |
| WR 8 | [O iii] 88 µm | 87.77 – 88.98 | 2400 | 2 | 300 |
| WR 8 | [N ii] 122 µm | 119.98 – 123.77 | 1100 | 3 | 225 |
| WR 8 | [N ii] 205 µm | 204.11 – 206.19 | 1700 | 8 | 1200 |
| Abell 48 | [N iii] 57 µm | 57.05 – 57.64 | 2800 | 2 | 384 |
| Abell 48 | [O iii] 88 µm | 87.92 – 88.81 | 2400 | 2 | 368 |
| Abell 48 | [N ii] 122 µm | 120.57 – 123.18 | 1100 | 2 | 344 |
| Abell 48 | [N ii] 205 µm | 204.58 – 206.04 | 1700 | 2 | 344 |
| NGC 6888 (rim) | [N iii] 57 µm | 56.95 – 57.73 | 2800 | 3 | 225 |
| NGC 6888 (rim) | [O iii] 88 µm | 87.77 – 88.98 | 2400 | 2 | 150 |
| NGC 6888 (rim) | [N ii] 122 µm | 119.98 – 123.77 | 1100 | 3 | 225 |
| NGC 6888 (rim) | [N ii] 205 µm | 204.16 – 206.24 | 1700 | 8 | 600 |
| NGC 6888 (inner) | [N iii] 57 µm | 56.95 – 57.73 | 2800 | 3 | 225 |
| NGC 6888 (inner) | [O iii] 88 µm | 87.77 – 88.98 | 2400 | 2 | 150 |
| NGC 6888 (inner) | [N ii] 122 µm | 119.98 – 123.77 | 1100 | 3 | 225 |
| NGC 6888 (inner) | [N ii] 205 µm | 204.16 – 206.24 | 1700 | 8 | 600 |
a: Hours, minutes and seconds. b: Degrees, arcminutes and arcseconds. c: UT. d: for WR 8 and NGC 6888 the sky positions are included in the total OB execution time.
Herschel/PACS spectra of four fine structure lines between 55 and 205 µm were obtained in line scan mode for each of the objects discussed in the previous section. The PACS spectrometer is an integral field unit (IFU) consisting of a 5 5 array of 9.4″ 9.4″ spectral pixels (spaxels). Details of the observations are presented in Table 1, with general information in Table 1(a) and line scan details, including exposure times, in Table 1(b). Figure 1 shows the spectrometer IFU footprint superimposed on Supercosmos H images of the targets.
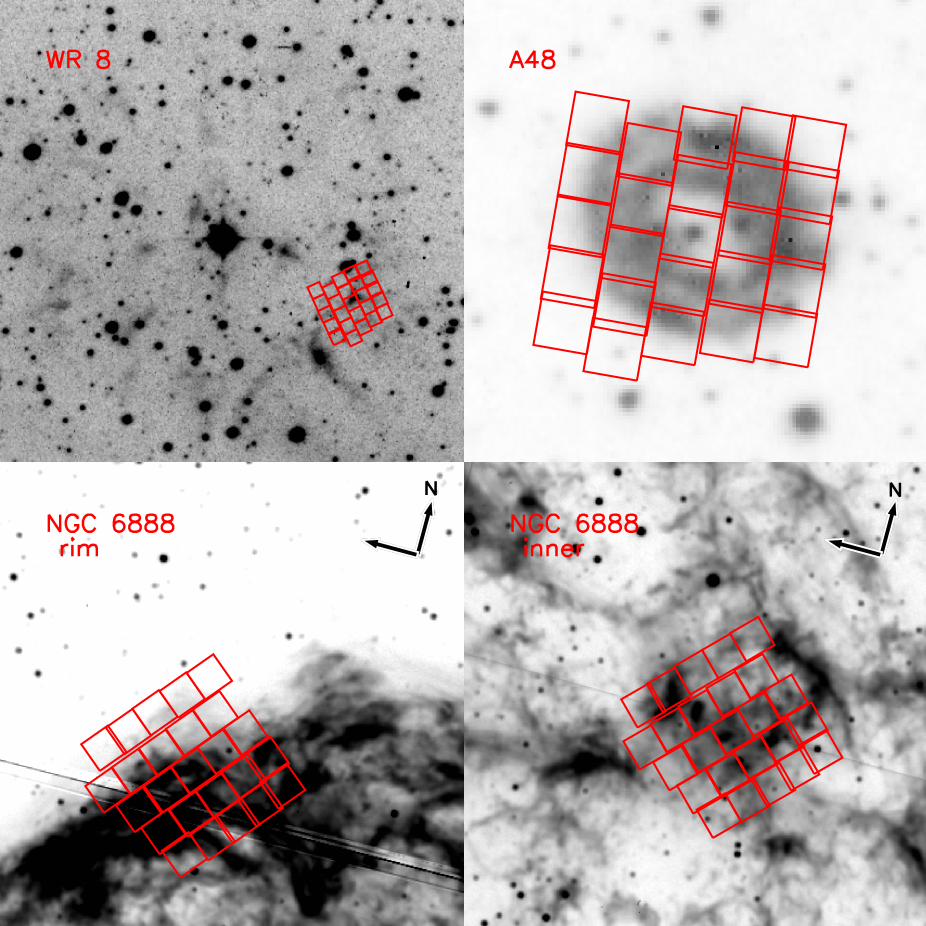
The PACS spectrometer chopping nodding observation mode was employed for the smallest nebula (Abell 48), while for the larger nebulae the chop throw was not sufficient to find a ‘sky’ field. For WR 8 and NGC 6888 we therefore used the pointed line scan mode, using specific sky fields far from the nebulae. In both types of observation the ‘sky’ fields were used to cancel the emission from the telescope and instruments.
For Abell 48 and WR 8, one on-source field was observed for each object. In fact Abell 48 nearly fills the entire PACS IFU spectrometer field of view, while for the nebula around WR 8 we selected the brightest H patch of nebulosity. The large angular size of NGC 6888 allowed us to observe two fields, one at the rim and and one near the centre.
Each line scan observation resulted in a spectral cube containing two
spatial dimensions with five spaxels along each axis and a wavelength axis
encompassing the spectral line and a section of continuum on either side.
The spectral resolution of the PACS instrument varies with wavelength and
grating order. For [N iii] 57 µm, R 2700, while for the
[N ii] line at 122 µm the resolving power was
1100111PACS Observers Manual:
http://herschel.esac.esa.int/Docs/PACS/pdf/pacs_om.pdf. The wavelength ranges and resolving powers are given for
each observation in Table 1(b).
2.3 Data Reduction and Analysis
Each of the observations was reduced using the standard PACS spectroscopy reduction pipeline within HIPE (v11.0.1; Ott 2010).
The analysis process for the data was relatively simple. Initially, the alignments for each of the different data cubes were checked for each object, i.e. whether the observations of each line covered precisely the same area. It was found that in all cases the deviations were less than 1 ″due to slight rotation of the telescope between observations, relative to the field. In order to minimise the effect of the slightly mis-matched apertures on the later results, the integrated spectra were calculated using in inner 33 array of pixels rather than the whole 55 array.
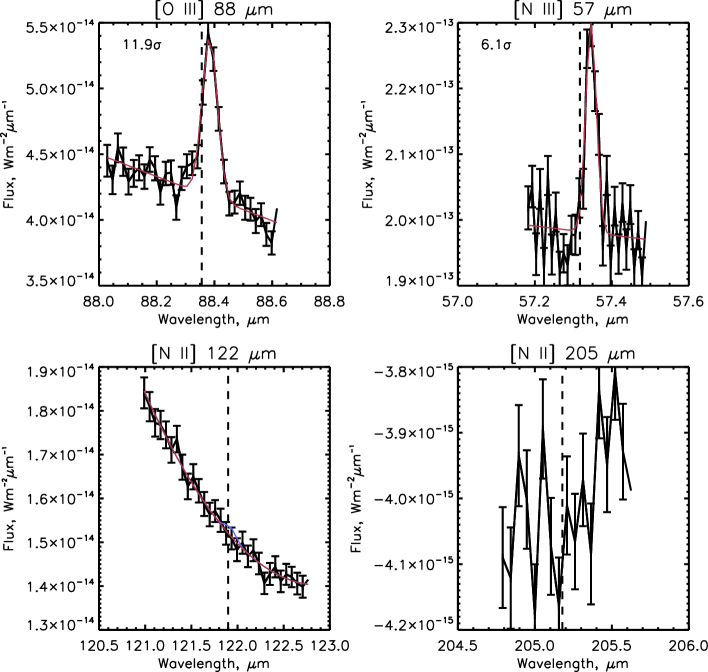
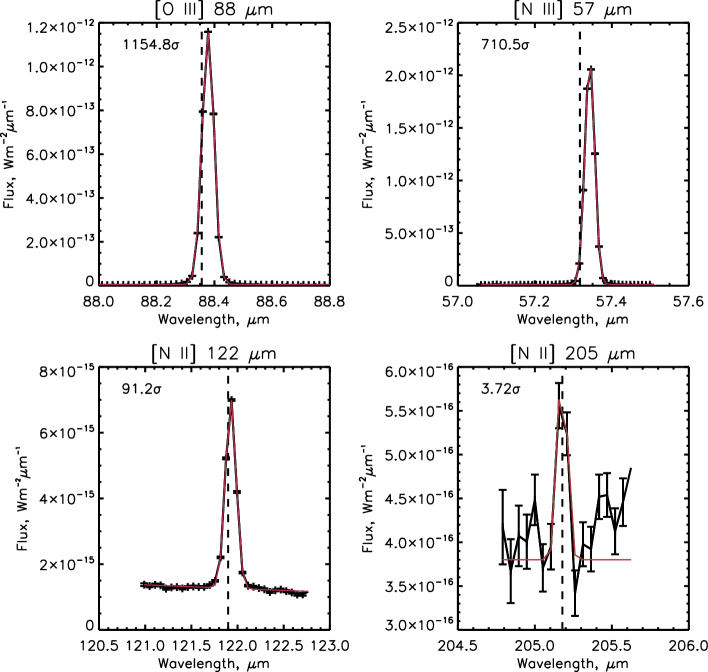
Subsequently, lines in the four spectral datacubes for each observation were measured identically. Each coadded spectrum was fitted with a straight line plus a gaussian, representing the continuum and line emission respectively (see Figures 2–5 for an example). The continuum was initially fitted to ‘windows’ of 10 or so pixels on either side of the line to gain a rough estimate of the continuum properties, which were then used as initial conditions for the fit to the continuum and line. For the two instances of [N ii] 205 µm line detections a slightly different fitting routine was used because the increased noise in this region rendered the method unreliable. Instead a gaussian was fitted to the data assuming a continuum, which was set to be constant at the level of the base of the detected line.
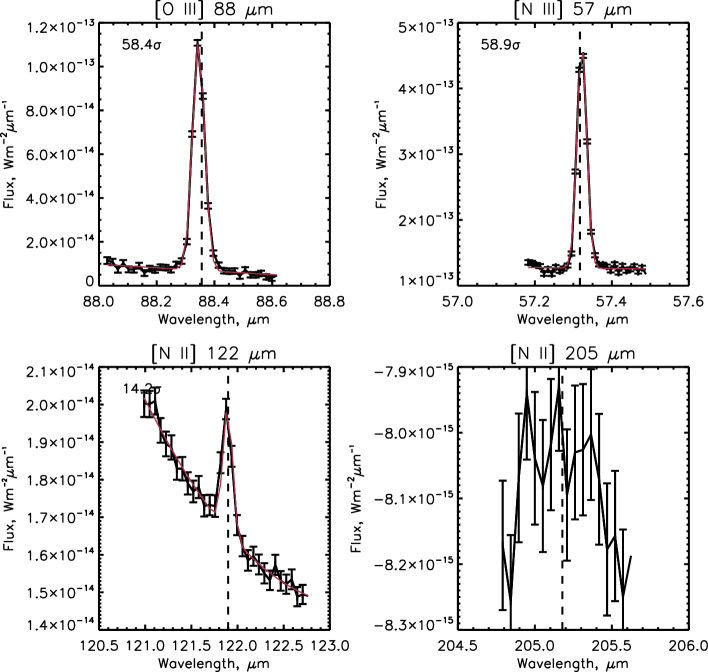
A further exception was made for the fit to the weak [N ii] 122 µm line from the inner region of NGC 6888. For this spectrum (see Figure 4) there is clear curvature to the continuum and so the straight line continuum fit was modified to a second order polynomial for this source.
An upper limit to the [N ii] 122 µm flux for WR 8 was found by initially fitting a second order polynomial continuum to the observation. Subsequently a gaussian with the same width as that found for A48 was added and the flux tuned such that the line could just be clearly discerned against the noise - this was adopted as the 3 upper limit to the line flux.
In order to calculate the signal to noise ratio (SNR), we measured the root mean square (RMS) noise of the continuum measurement by subtracting the fitted continuum from the data and calculating the RMS within the spectral windows previously mentioned. The SNR of each line was estimated by comparing the integrated line flux to the RMS noise taking into account the width of the gaussian and wavelength spacing of the spectral points.
3 Results
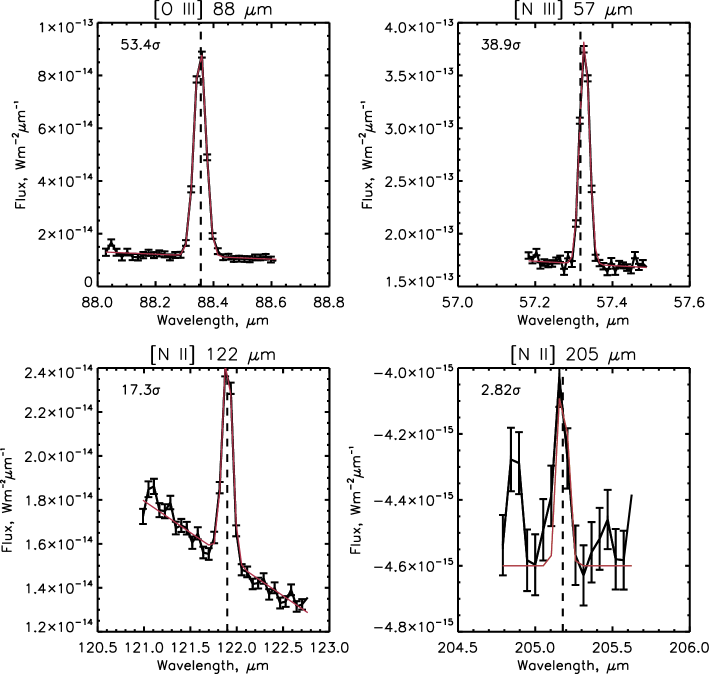
In Table 2 we list integrated line fluxes and some derived quantities for the central 33 group of spaxels for the lines of [N iii] 57 µm, [O iii] 88 µm and [N ii] 122, 205 µm. Figures with the line fits to the integrated spectra are shown for WR 8 in Figure 2, the outer field of NGC 6888 in Figure 3, the inner field of NGC 6888 in Figure 4 and for Abell 48 in Figure 5.
| Fluxesa | Abundances | ||||||
|---|---|---|---|---|---|---|---|
| Object | [O iii] 88 m | [N iii] 57 m | [N ii] 122 µm | [N ii] 205 µm | N2+/N+ | N2+/O2+=N/O | ne(cm-3) |
| WR 8 | 8.08 0.68 | 11.11 1.81 | 0.30 | – | 7.78 | 0.92 0.17 | 50b |
| NGC 6888 (rim) | 40.34 0.76 | 65.88 1.70 | 12.55 0.72 | 0.50 0.18 | 0.68 0.07 | 0.93 0.08 | 200c |
| NGC 6888 (inner) | 54.62 0.94 | 108.70 1.85 | 4.28 0.30 | – | 4.06 0.39 | 1.25 0.07 | 100c |
| A 48 | 602.92 0.52 | 680.93 0.96 | 8.41 0.09 | 0.18 0.05 | 7.29 0.81 | 0.49 0.06 | 700d |
3.1 Nebular Ionization Balance and Electron Densities
As discussed by Liu et al. (2001), for a wide range of nebular excitation classes measured N2+/O2+ ratios are expected to be close to the overall nebular N/O ratios, due to the similar ionization potentials of the first and second ion stages of nitrogen and oxygen. However, the [N iii] 57-µm and [O iii] 88-µm lines have different critical densities, so nebular electron density estimates are needed when using these lines to evaluate nebular N2+/O2+ ratios.
The [N ii] 122, 205 µm emission lines were observed with the intention of measuring their relative fluxes, since their flux ratio is an electron density diagnostic. However, the weaker of the two lines, at 205 µm, falls in a poorly calibrated and noisy wavelength region of the PACS spectrometer’s wavelength coverage and only two detections of this line having a signal to noise ratio greater than three were obtained. The 122-µm line was detected, quite strongly in some cases, in all of the nebular spectra except for that of WR 8.
At the low density limit (e.g. 1 cm-3) the flux ratio of the [N ii] 122/205-m lines is predicted to be 0.74, and the ratio approaches its high-density limit ratio of 10 for electron densities above 2000 cm-3. As can be seen from Table 2, for the two cases where detections of [N ii] 205 µm where made, the 122/205 flux ratio is found to be 25 and 56. Since the optically determined electron densities for all of the nebulae are below 1000 cm-3, we attribute this discrepancy to the problems in calibrating PACS spectra longwards of 190 m due to the leak of shorter wavelength radiation that affects this spectral region (Poglitsch et al., 2010). Instead, we have adopted electron densities measured at optical wavelengths (Table 2). A number of different regions of NGC 6888 were studied by Fernández-Martín et al. (2012) and values of ne of 100 and 200 cm-3 were found for fields close to those we observed with PACS. For WR 8, Stock et al. (2011) found a nebular electron density of ne 50 cm-3, while for Abell 48 Frew et al. (2013) found an electron density of 700 cm-3 - consistent with our strong 57 and 88 µm line detections.
We have used our detections of the [N ii] 122-µm and [N iii 57-m lines to calculate the N2+/N+ abundance ratio for each of the three nebulae for which the [N ii] 122-µm line was detected. The equib code, developed at UCL by I. D. Howarth and S. Adams, was used to solve the statistical equilibrium equations for multilevel atomic models of N2+ and N+, giving level populations and line emissivities for the appropriate physical conditions. The atomic data used by equib are from the chianti atomic database (Landi et al., 2006). Detailed references for the collision strengths and transition probabilities can be found in Table 3.
| Ion | References |
|---|---|
| N+ | A Values: Bell et al. (1995); Storey & Zeippen (2000); Collision Strengths: Stafford et al. (1994) |
| N2+ | A Values: Nussbaumer & Storey (1979); Collision Strengths: Stafford et al. (1994) |
| O2+ | A Values: Storey & Zeippen (2000); Tachiev & Fischer (2001); Collision Strengths: Lennon & Burke (1994) |
From the atomic data, the relationship between the line intensities and the ionic abundances was found. At the low density limit for both lines this resolves to N2+/N+ 0.22 (I57 / I122), where I57, I122 are the fluxes of the 122- and 57-m lines respectively. At the high density limit for both lines the factor of 0.22 becomes 0.08. For each nebula we calculated the appropriate factors using the literature electron densities listed in Table 2). Conservative uncertainties of 50% have been assumed for the electron densities and these are included in the final uncertainties quoted in Table 2. For two of the three observed fields for which the [N ii] 122 µm line was detected, the N2+ / N+ ratio is greater than unity, indicating that N2+ is the dominant ionization state of nitrogen. Given the similarity of their ionization potentials, we conclude that O2+ is also the dominant ionization state for oxygen in the observed fields.
3.2 N/O Ratios and Nitrogen Enrichment
For each nebula, the conversion factor to be divided into the measured [N iii] to [O iii] line intensity ratio to obtain the N2+/O2+ ratio was calculated using equib. These factors ranged from around 1.5 at the lowest electron densities considered (50 cm-3) to 2.3 at the highest density (700 cm-3). The uncertainties quoted in Table 2 include an 50% uncertainty in the electron densities adopted from the literature. From a comparison of the nebular N/O ratios found in Table 2 with the solar and Galactic H ii region N/O ratios of 0.12-0.14 (Asplund et al. 2009, Stock et al. 2011), it can be seen that the N/O ratios of the two massive WR nebulae are enriched by factors of 7 to 10 relative to the solar ratio, while the N/O ratio of the [WN] planetary nebula Abell 48 is enhanced by a factor of 4.
Our measured N/O ratios are consistent with previous measurements, which, due to the absence of lines of [N iii] in the optical region, had been based on the ratio of the ion stages N+ and O+. To provide context to the abundances calculated for our sample, we have included Table 4, which shows the results of prior studies, sorted by the spectral type of the host star.
| Nebula | Star | Spectral Type | Nebular N/O | Reference |
|---|---|---|---|---|
| S 308 | WR 6 | WN4 | 0.54 | Kwitter (1984) |
| S 308 | WR 6 | WN4 | 1.65 | Esteban et al. (1992) |
| NGC 2359 | WR 7 | WN4 | 0.11 | Esteban et al. (1992) |
| NGC 3199 | WR 18 | WN4 | 0.20 | Kwitter (1984) |
| NGC 3199 | WR 18 | WN4 | 0.12 | Stock et al. (2011) |
| RCW 104 | WR 75 | WN6 | 0.74 | Esteban et al. (1992) |
| NGC 6888 | WR 136 | WN6h | 0.50 | Esteban & Vilchez (1992) |
| NGC 6888 | WR 136 | WN6h | 0.50 | Moore et al. (2000) |
| NGC 6888 (rima) | WR 136 | WN6h | 1.20 | Fernández-Martín et al. (2012) |
| NGC 6888 (innerb) | WR 136 | WN6h | 0.97 | Fernández-Martín et al. (2012) |
| NGC 6888 (inner) | WR 136 | WN6h | 1.65 | Mesa-Delgado et al. (2014) |
| NGC 6888 (rim) | WR 136 | WN6h | 0.93 | this work |
| NGC 6888 (inner) | WR 136 | WN6h | 1.25 | this work |
| anon | WR 8 | WC4/WN7 | 0.4 | Stock et al. (2011) |
| anon | WR 8 | WC4/WN7 | 0.92 | this work |
| anon | WR 16 | WN8h | high | Marston et al. (1999) |
| anon | WR 16 | WN8h | 0.8 | Stock et al. (2011) |
| RCW 58 | WR 40 | WN8h | 0.38 | Kwitter (1984) |
| RCW 58 | WR 40 | WN8h | 1.25 | Stock et al. (2011) |
| M 1-67 | WR 124 | WN8h | 2.95 | Esteban et al. (1991) |
| M 1-67 | WR 124 | WN8h | 2.81 | Fernández-Martín et al. (2013) |
a: Region X1, b: region MB1.
3.2.1 WR 8
From optical spectroscopy of the nebula around WR 8, Stock et al. (2011) found N/O ratios in the range 0.4 N/O 1.1, consistent with our measurement here of 0.92 0.17. Our non-detection of the far-infrared [N ii] lines is likely due to a combination of a low fractional N+ abundance and the intrinsic faintness of the source. The nebula around WR 8 is likely to be composed of stellar ejecta processed by the CNO-cycle. The enhanced nitrogen abundance is characteristic of material ejected during the red supergiant phase (see e.g. NGC 6888). The WN/WC type of the central star indicates that it is more evolved than the other known WR ejecta nebulae (Crowther et al., 1995), consistent with its fainter nebula.
In comparison with the abundances found for other WR nebulae presented in Table 4, the N/O ratio we find for the nebula around WR 8 is actually rather modest. This, combined with the advanced evolutionary state of the system, suggests that there is a substantial component of swept-up ISM in the nebula.
3.2.2 NGC 6888
Optical N+/O+ ratios were measured by Fernández-Martín et al. (2012) for NGC 6888, who found values of 0.74-1.20 near to the ‘rim’ region for which we found an N2+/O2+ ratio of 0.93 0.08, and a N+/O+ ratio of 0.18-0.48 for a central region close to where we found N2+/O2+ = 1.25 0.07. The earlier optical spectroscopic study of Esteban & Vilchez (1992) found an N+/O+ ratio of 2 for the blue- and red-shifted shell components of the nebula, while an ambient gas velocity component showed a more solar-like N+/O+ ratio. A more recent study by Mesa-Delgado et al. (2014) found a much higher value of N/O = 1.65 for a field closer to the exciting star than our inner field, possibly representing more recent stellar ejecta with respect to that measured at greater distances.
Clear differences are evident between the two NGC 6888 fields. The rim field has stronger [N ii] lines and an N2+/N+ ratio of 0.7, consistent with representing material far from the exciting star. In contrast, the central field shows much weaker [N ii] lines relative to the [N iii] 57-m line.
The N/O ratios found for NGC 6888 are again moderate compared to the extreme examples in Table 4. The lower abundances in the rim of NGC 6888 suggest that the rim regions include a large swept-up ISM component. However, Fernández-Martín et al. (2012) found the opposite trend in that their highest N/O ratio was found for a bright section of the rim of NGC 6888. This could be an ionization effect though as the N/O ratio quoted by Fernández-Martín et al. (2012) is N+/O, and these ionization stages are unlikely to be dominant as discussed earlier.
3.2.3 Abell 48
Abell 48 has been shown to be a planetary nebula with an early WN central star (Todt et al. 2013, Frew et al. 2013). The former authors found an N+/O+ ratio of 0.250.10 for Abell 48, while the latter authors found an N+/O+ ratio of 0.12. In addition, an N/O ratio of 0.27 has been quoted by Danehkar et al. (2014). Our N2+- and O2+-based measurement of N/O = 0.49 0.06 does not agree with these measurements by almost a factor of two. However, the detailed photoionization models of Danehkar et al. (2014) predict N2+- and O2+ abundances which, when combined yield an N2+/O2+ ratio of 0.52, which exactly match that observed.
Abell 48 has a large N2+/N+ ratio of 7.3 (Table 2). The nebular spectra of Todt et al. (2013) and Frew et al. (2013) showed no He ii or [Ar iv] line emission, indicating a lack of stellar photons with energies in excess of 54.4 eV, so we conclude that N2+ and O2+ are the dominant ion stages of nitrogen and oxygen and that our N2+/O2+-based N/O ratio for Abell 48 should therefore be accurate.
The other three objects in the rare class of planetary nebulae having WN central stars have been found to have N/O ratios ranging from 0.28 to 0.4 (LMC-N66: Tsamis et al. 2003, N/O = 0.4; PB 8: García-Rojas et al. 2009, N/O = 0.28; IC 4663: Miszalski et al. 2012, N/O = 0.36). Each of these studies had access not only to the optical lines of [N ii] but also to the ultraviolet N iii] and N iv] lines. Our measurement of N/O = 0.49 0.06 for Abell 48 falls slightly above the N/O ratios found for the Galactic members of this class (IC 4663 and PB 8).
3.3 Predicted Stellar Yields and Swept-Up material
Toalá & Arthur (2011) computed models for the ejecta from massive stars and calculated the degree of nitrogen enrichment that would be expected in the nebulae as a function of time. They found that the N/O values seen in NGC 6888 and S 308, the two best known WR bubbles, are characteristic of a 3 105 year WR period in the life of 40-60 M☉ stars (see Figure 16, Toalá & Arthur 2011). They are also consistent with the N/O ratios that we find here for NGC 6888 and WR 8.
However, it should be noted that the results of Toalá & Arthur (2011) do not include the effect of the nebulae sweeping up ISM material and hence diluting the detected nebular abundances. From Table 4 it is clear that the highest N/O ratios detected for classical WR nebulae are for M 1-67, one of the most compact of the class with a radius of around 1.2 pc (Fernández-Martín et al., 2013). If we assume that this is a reasonable benchmark for the abundances of a WR nebula containing very little swept up material, it is clear that the other nebulae listed in Table 4 must suffer from considerable dilution of their natal abundances. For consistency then, models such as those of Toalá & Arthur (2011) should find much higher N/O ratios than observed, such that they would reproduce the observed abundances after ISM dilution was taken into account.
4 Conclusions
The degree of nitrogen enrichment in a selection of nebulae around WR stars has been measured using Herschel/PACS observations of their far-IR fine structure lines. Abundance studies are usually performed using optical spectra, which has the drawback of not including any lines of N2+, which is often the dominant ionization stage for nitrogen. This effect is usually compensated for using ionization correction factor schemes to calculate the N2+ abundance. The far-IR observations used in this paper include the 57 µm line of N2+, which should result in nitrogen abundances that are less susceptible to systematic errors. In addition, abundances obtained for N+, N2+ and O2+ from their far-infrared lines have little or no sensitivity to the nebular electron temperature, due to their low excitation energies.
The N/O ratios of 0.9 – 1.3 found for the massive WR-star nebulae WR 8 and NGC 6888 are consistent with both nebulae representing material ejected during the pre-WR evolution of the stars. For NGC 6888, our measurements overlap those of previous authors who employed ionization correction factors to determine the N/O ratio from optical lines. Our observations confirm that the nebula around WR 8 has a significant component of ejected stellar material – as predicted by the morphological categorization methods of Chu (1991) which were employed by Stock & Barlow (2010) upon discovery of the nebulosity.
The other object observed, Abell 48, is now known to be a rare type of planetary nebula with a WN4-type central star and which are not of Peimbert Type I. Our far-infrared observations yield a nebular N/O ratio of 0.49, which is slightly greater than the ratios found for the two other Galactic members of the rare [WN] class of planetary nebulae.
Acknowledgments
We thank the anonymous referee for their suggestions which have helped improve and clarify the paper. DJS acknowledges support from an NSERC Discovery Grant and an NSERC Discovery Accelerator Grant. This research has made use of NASA’s Astrophysics Data System Bibliographic Services.
DJS thanks A. Danehkar for alerting us to a mistake in the unit conversions in the first version of this paper.
References
- Asplund et al. (2009) Asplund M., Grevesse N., Sauval A. J., Scott P., 2009, ARA&A, 47, 481
- Bell et al. (1995) Bell K. L., Hibbert A., Stafford R. P., 1995, Phys. Scr, 52, 240
- Chu (1991) Chu Y. H., 1991, in K. A. van der Hucht & B. Hidayat ed., Wolf-Rayet Stars and Interrelations with Other Massive Stars in Galaxies Vol. 143 of IAU Symposium, Ring Nebulae around Massive Stars (review). pp 349–+
- Crowther (2007) Crowther P. A., 2007, ARA&A, 45, 177
- Crowther et al. (1995) Crowther P. A., Smith L. J., Willis A. J., 1995, A&A, 304, 269
- Danehkar et al. (2014) Danehkar A., Todt H., Ercolano B., Kniazev A. Y., 2014, MNRAS
- Drew et al. (2005) Drew J. E., et al., 2005, MNRAS, 362, 753
- Esteban & Vilchez (1992) Esteban C., Vilchez J. M., 1992, ApJ, 390, 536
- Esteban et al. (1991) Esteban C., Vilchez J. M., Manchado A., Smith L. J., 1991, A&A, 244, 205
- Esteban et al. (1992) Esteban C., Vilchez J. M., Smith L. J., Clegg R. E. S., 1992, A&A, 259, 629
- Fernández-Martín et al. (2012) Fernández-Martín A., Martín-Gordón D., Vílchez J. M., Pérez Montero E., Riera A., Sánchez S. F., 2012, A&A, 541, A119
- Fernández-Martín et al. (2013) Fernández-Martín A., Vílchez J. M., Pérez-Montero E., Candian A., Sánchez S. F., Martín-Gordón D., Riera A., 2013, A&A, 554, A104
- Frew et al. (2013) Frew D. J., Bojicic I. S., Parker Q. A., Stupar M., Wachter S., DePew K., Danehkar A., Fitzgerald M. T., Douchin D., 2013, ArXiv e-prints: 1301.3994
- García-Rojas et al. (2009) García-Rojas J., Peña M., Peimbert A., 2009, A&A, 496, 139
- Henry et al. (2000) Henry R. B. C., Edmunds M. G., Köppen J., 2000, ApJ, 541, 660
- Kingsburgh & Barlow (1994) Kingsburgh R. L., Barlow M. J., 1994, MNRAS, 271, 257
- Kwitter (1984) Kwitter K. B., 1984, ApJ, 287, 840
- Landi et al. (2006) Landi E., Del Zanna G., Young P. R., Dere K. P., Mason H. E., Landini M., 2006, ApJS, 162, 261
- Lennon & Burke (1994) Lennon D. J., Burke V. M., 1994, A&AS, 103, 273
- Liu et al. (2001) Liu X.-W., Barlow M. J., Cohen M., Danziger I. J., Luo S.-G., Baluteau J. P., Cox P., Emery R. J., Lim T., Péquignot D., 2001, MNRAS, 323, 343
- Marston (1995) Marston A. P., 1995, AJ, 109, 1839
- Marston et al. (1999) Marston A. P., Welzmiller J., Bransford M. A., Black J. H., Bergman P., 1999, ApJ, 518, 769
- Mesa-Delgado et al. (2014) Mesa-Delgado A., Esteban C., García-Rojas J., Reyes-Pérez J., Morisset C., Bresolin F., 2014, ArXiv e-prints
- Miszalski et al. (2012) Miszalski B., Crowther P. A., De Marco O., Köppen J., Moffat A. F. J., Acker A., Hillwig T. C., 2012, MNRAS, 423, 934
- Moore et al. (2000) Moore B. D., Hester J. J., Scowen P. A., 2000, AJ, 119, 2991
- Nussbaumer & Storey (1979) Nussbaumer H., Storey P. J., 1979, A&A, 71, L5
- Ott (2010) Ott S., 2010, in Mizumoto Y., Morita K.-I., Ohishi M., eds, Astronomical Data Analysis Software and Systems XIX Vol. 434 of Astronomical Society of the Pacific Conference Series, The Herschel Data Processing System – HIPE and Pipelines. p. 139
- Parker et al. (2005) Parker Q. A., et al., 2005, MNRAS, 362, 689
- Pilbratt et al. (2010) Pilbratt G. L., Riedinger J. R., Passvogel T., Crone G., Doyle D., Gageur U., Heras A. M., Jewell C., Metcalfe L., Ott S., Schmidt M., 2010, A&A, 518, L1
- Poglitsch et al. (2010) Poglitsch A., et al., 2010, A&A, 518, L2
- Stafford et al. (1994) Stafford R. P., Bell K. L., Hibbert A., 1994, MNRAS, 266, 715
- Stafford et al. (1994) Stafford R. P., Bell K. L., Hibbert A., Wijesundera W. P., 1994, MNRAS, 268, 816
- Stock & Barlow (2010) Stock D. J., Barlow M. J., 2010, MNRAS, 409, 1429
- Stock et al. (2011) Stock D. J., Barlow M. J., Wesson R., 2011, MNRAS, 418, 2532
- Storey & Zeippen (2000) Storey P. J., Zeippen C. J., 2000, MNRAS, 312, 813
- Tachiev & Fischer (2001) Tachiev G., Fischer C. F., 2001, Canadian Journal of Physics, 79, 955
- Toalá & Arthur (2011) Toalá J. A., Arthur S. J., 2011, ApJ, 737, 100
- Todt et al. (2013) Todt H., et al., 2013, MNRAS, 430, 2302
- Torres-Peimbert & Peimbert (1977) Torres-Peimbert S., Peimbert M., 1977, Rev. Mexicana Astron. Astrofis., 2, 181
- Tsamis et al. (2003) Tsamis Y. G., Barlow M. J., Liu X.-W., Danziger I. J., Storey P. J., 2003, MNRAS, 345, 186
- Wachter et al. (2010) Wachter S., Mauerhan J. C., Van Dyk S. D., Hoard D. W., Kafka S., Morris P. W., 2010, AJ, 139, 2330
- Wesson et al. (2012) Wesson R., Stock D. J., Scicluna P., 2012, MNRAS, 422, 3516