The X-ray Properties of the Cometary Blue Compact Dwarf galaxies Mrk 59 and Mrk 71
Abstract
We present XMM-Newton and Chandra observations of two low-metallicity cometary blue compact dwarf (BCD) galaxies, Mrk 59 and Mrk 71. The first BCD, Mrk 59, contains two ultraluminous X-ray (ULX) sources, IXO 72 and IXO 73, both associated with bright massive stars and H ii complexes, as well as one fainter extended source associated with a massive H ii complex at the head of the cometary structure. The low-metallicity of Mrk 59 appears to be responsible for the presence of the two ULXs. IXO 72 has varied little over the last 10 yr, while IXO 73 has demonstrated a variability factor of 4 over the same period. The second BCD, Mrk 71, contains two faint X-ray point sources and two faint extended sources. One point source is likely a background AGN, while the other appears to be coincident with a very luminous star and a compact H ii region at the “head” of the cometary structure. The two faint extended sources are also associated with massive H ii complexes. Although both BCDs have the same metallicity, the three sources in Mrk 71 have X-ray luminosities 1–2 orders of magnitude fainter than those in Mrk 59. The age of the starburst may play a role.
keywords:
galaxies: individual: Mrk 59 — galaxies: individual: Mrk 71 — galaxies: starburst — X-rays: binaries — X-rays: galaxies1 Introduction
With a heavy element abundance ranging from 3% to 50% that of the Sun, blue compact dwarf (BCD) galaxies are the least chemically evolved gas-rich star-forming galaxies known in the local universe (Thuan, 2008). They thus constitute the best laboratories for studying physical processes which occurred at high redshifts, when the gas was very metal-deficient.
BCDs are undergoing intense bursts of star formation, giving birth to thousands of O stars in a very compact starburst region. Because of the presence of these many massive short-lived stars, BCDs are expected to emit in the X-ray. This X-ray emission can come from compact sources such as high-mass X-ray binaries (HMXBs) and/or hot O and Wolf-Rayet stars, or from diffuse sources such as the hot plasma associated with supernova (SN) remnants. Stellar winds and SNe inject energy and momentum into the cold ambient interstellar medium (ISM), producing large amounts of hot gas. The starburst activity that injects hot X-ray-emitting gas into the ISM lasts about 107 yr. This starburst phase is then followed by a long ( 1–2 Gyr) quiescent period of passive photometric evolution, before the occurrence of the next burst. Depending on the energy injection rate into the ISM and the geometry and robustness of the cold gaseous ambient medium, expansion of the hot ISM on scales comparable to the galactic scale length can result in a funneling of hot gaseous mass into the cold gaseous halo. Because of the relatively low potential well of BCDs, mass loss can occur (De Young & Heckman, 1994). Extensive mass loss can then lead to an expansion of the galaxy’s size and to a morphological evolution of the dwarf galaxy (Yoshii & Arimoto, 1987).
We present in this paper an X-ray study of two BCDs, Mrk 59I Zw 49 and Mrk 71NGC 2363. These are of particular interest because they are the prototypes of a particular class of BCDs, dubbed “cometary” galaxies by Loose & Thuan (1985) in their BCD morphological classification scheme. Cometary BCDs are characterized by a high surface brightness star-forming region (the comet’s “head”) at one end of an elongated low surface brightness stellar body (the comet’s “tail”), suggestive of a flattened dwarf irregular galaxy seen nearly edge-on. In the case of Mrk 59, the irregular galaxy is called NGC 4861, and in the case of Mrk 71, NGC 2366. In the following, we will be using the names of Mrk 59 and Mrk 71 to designate both the high surface brightness star-forming region and the low surface brightness elongated stellar body. The bright star-forming region is at the end of a long chain of fainter and smaller H ii regions embedded in the lower surface brightness stellar body of the cometary BCD. This chain of H ii regions is suggestive of self-propagating star formation which stopped at the edge of the galaxy. By studying cometary BCDs, we can examine how star formation ignites and propagates in low-mass gas-rich stellar systems. Because the brightest H ii region at the end of the chain is youngest and those along the chain are progressively older with increasing distance from the edge (Noeske et al., 2000), we can study the time evolution of H ii regions, and in particular the time dependence of their X-ray properties.
Of the 2 BCDs, only Mrk 59 has been observed before in the X-ray range. Using Einstein, Fabbiano et al. (1992) detected it as a strong X-ray source with an X-ray luminosity of 1040 erg s-1. Subsequently, Papaderos (1998) found from ROSAT HRI observations of Mrk 59 that the X-ray emission splits into two sources separated by 35″. The southern one appears to coincide with the high surface brightness starburst region at the end of the stellar body, while the more luminous (by a factor of 2.5) northern one is in the low surface brightness main body, and did not appear to be associated with any evident H ii region.
The two BCDs have also been studied extensively at other wavelength ranges. Abundance determinations give oxygen abundances 12 + log O/H of 8.0 and 7.9 for Mrk 59 and Mrk 71, respectively (Noeske et al., 2000), corresponding to 1/5 and 1/6 of the Sun’s metallicity, if the solar calibration (12 + log O/H)⊙ = 8.7 of Asplund et al. (2009) is adopted. Noeske et al. (2000) have derived O abundances for two other emission knots along the elongated body of Mrk 59 and found them to be the same as that of the bright knot, within the errors. The small scatter in metallicity along the major axis of Mrk 59 (0.2 dex) suggests that the mixing of elements in the ionized gas has been efficient on a spatial scale of several kiloparsecs. As for Mrk 71, Roy et al. (1996) found that the O abundance in several other H ii regions in the main body varies between 8.1 and 8.3, slightly higher than in the brightest H ii region.
Thuan et al. (2002) have used the Far Ultraviolet Spectroscopic Explorer (FUSE) to study the abundances in the neutral ISM of Mrk 59 from UV absorption lines. They found that the heavy element abundance in the neutral gas of Mrk 59 is about a factor of 10 less than that of the ionized gas, or about 1/50 of the solar abundance. Although it has a very low metallicity, the neutral gas of Mrk 59 is not pristine and must have been enriched by previous generations of stars. Using photometric and spectroscopic observations, Noeske et al. (2000) found that the age of the oldest stars in the low surface brightness component probably does not exceed 4 Gyr in Mrk 59 and 3 Gyr in Mrk71. This age is smaller than the typical age (5 Gyr or greater) of the underlying stellar population in BCDs of other types. Cometary galaxies thus appear to be relatively young galaxies.
Thuan & Izotov (2005) have used HST and images to perform a color-magnitude diagram (CMD) analysis of the stellar populations in Mrk 71. The CMD reveals not only young stellar populations such as blue main sequence stars (age 30 Myr), but also an intermediate-age population of blue and red supergiants (20 Myr age 100 Myr), and an older evolved stellar population of asymptotic giant branch (AGB) stars (age 100 Myr) and red giant stars (age 1 Gyr). This suggests that, in addition to the present burst with age 100 Myr, star formation in Mrk 71 has started some 3 Gyr ago, consistent with the photometric age estimate of Noeske et al. (2000). Near-infrared molecular hydrogen emission has been detected in both Mrk 59 (Izotov et al., 2009) and Mrk 71 (Izotov & Thuan, 2011). Thuan et al. (2004a) have studied the H i distribution and kinematics of the two BCDs. The VLA maps show multiple H i peaks scattered over the disk. The latter shows regular rotational kinematics, with a linear rise followed by a flattening of the rotation curve.
In this paper, we will adopt a distance of 10.7 Mpc for Mrk 59 (Thuan et al., 2004a). As for Mrk 71, we will use the Cepheid-derived distance of 3.44 Mpc (Tolstoy et al., 1995), placing it in the M81 group. At those distances, 1″ corresponds to a linear size of 52 pc in Mrk 59 and of 17 pc in Mrk 71. The Galactic column densities for Mrk 59 and Mrk 71 are cm-2 and cm-2, respectively, although based on the H i maps of Thuan et al. (2004a), the internal neutral hydrogen column densities in Mrk 59 and Mrk 71 could be as large as cm-2.
2 Observations and Data Reduction
2.1 XMM–Newton Observations
Mrk 59 and Mrk 71 were observed by the XMM-Newton Observatory with the –CCD camera (Strüder et al., 2001) and the two MOS–CCD cameras (Turner et al., 2001) using the medium filter in full field mode. Mrk 59 was observed on three separate occasions during 2003 June 14, 2003 July 10, and 2003 December 3 (PI: Thuan; ObsIds 0141150101, 0141150401, and 0141150501, respectively; hereafter epochs 1 (E1), 2 (E2), and 3 (E3)). Mrk 71 was observed on 2002 October 31 (PI: Thuan, ObsId 0141150201). The galaxies were generally placed near the aimpoint, allowing the entire optical extent of the galaxy to be imaged easily. The processing, screening, and analysis of the data were performed using the standard tools from SAS (v.13.0.0), as well as custom IDL software. The raw and MOS data were initially processed using the standard epchain and emchain pipeline scripts. Time intervals contaminated by soft-proton flares were identified using the background light curve in the 10–15 keV band. After excluding background flares, our final exposures with the (MOS) detectors were 13.1 ks (14.5 ks), 4.0 ks (8.1 ks), 0.0 ks (9.8 ks) for epochs E1, E2, and E3 of Mrk 59, respectively, and 29 ks (39 ks) for Mrk 71. We selected only good event patterns for further study: 12 for MOS imaging and spectroscopy, 4 for imaging and spectroscopy.
X-ray source detection was performed on the MOS and images in the 0.3–10 keV band using the standard SAS eboxdetect and emldetect algorithms. Four X-ray sources were found to be coincident with each of the optical extent of Mrk 59 and Mrk 71. Background-subtracted counts were extracted using circular apertures with radii in the range 15–30″, depending on whether the source appeared point-like or extended. Local backgrounds were determined from annuli after removal of nearby point sources. Our background-subtracted detection limit corresponds to counts, or absorbed 0.5–10 keV fluxes of erg cm-2 s-1 and erg cm-2 s-1 in Mrk 59 and Mrk 71, respectively, assuming a photon index and Galactic column densities.
For the three brightest XMM-Newton sources, XMMU J125901.7+345115 and XMMU J125900.7+345048 in Mrk 59 and XMMU J072857.9+691135 in Mrk 71, we extracted MOS and point-source spectra. We chose relatively small apertures (15–20″, corresponding to encircled energy fractions of –); these included most of the counts, but were still small enough to avoid potential contamination in the case of Mrk 59, and limit background contamination for faint sources. Local backgrounds were chosen to be on the same chip. Event PI values and photon energies were determined using the latest gain files appropriate for the observation, and spectral products were generated using standard methods within SAS.


2.2 Chandra Observations
In addition, Mrk 59 was observed by the Chandra X-ray Observatory on 2012 January 3 (PI: Yang; ObsId 12473; hereafter epoch 4, or E4) with the ACIS-I CCD camera. The original target was the irregular galaxy NGC 4861, so that Mrk 59 lies 2–5′off-axis from the aimpoint. However, Chandra’s point spread function (PSF) is still relatively sharp at these off-axis angles, and its large field-of-view (FOV) allows the entire optical extent of the galaxy to be imaged easily. The processing, screening, and analysis of the data were performed using the standard tools from CIAO (v.4.4), as well as custom IDL software. No strong background flares occurred during the observation, and the final exposure was 19.8 ks. We selected only good events for further study.
X-ray source detection was performed on the ACIS-I image in the 0.5–8 keV band using the standard CIAO wavdetect algorithm with a threshold of , which conservatively corresponds to 1 false detection over the entire ACIS detector. Six X-ray sources were found to be coincident within the optical extent of Mrk 59 and are listed in Table 1. The source XMMU J125900.7+345048 was found to separate into two sources, CXOU J125900.87345047.9 and CXOU J125900.37345043.0. All but one of the detected sources appear to be point-like at the resolution of Chandra. Background-subtracted events were extracted (and PSF-corrected) with acis extract, using 90% encircled-energy regions and local backgrounds, all of which were negligible. Our background-subtracted detection limit corresponds to counts, or an absorbed 0.5–10 keV flux of erg cm-2 s-1, adopting the same assumptions as for the XMM-Newton data. Spectral products which apply energy-dependent PSF-corrections were also generated by acis extract.
2.3 Astrometry of Optical and X-ray images
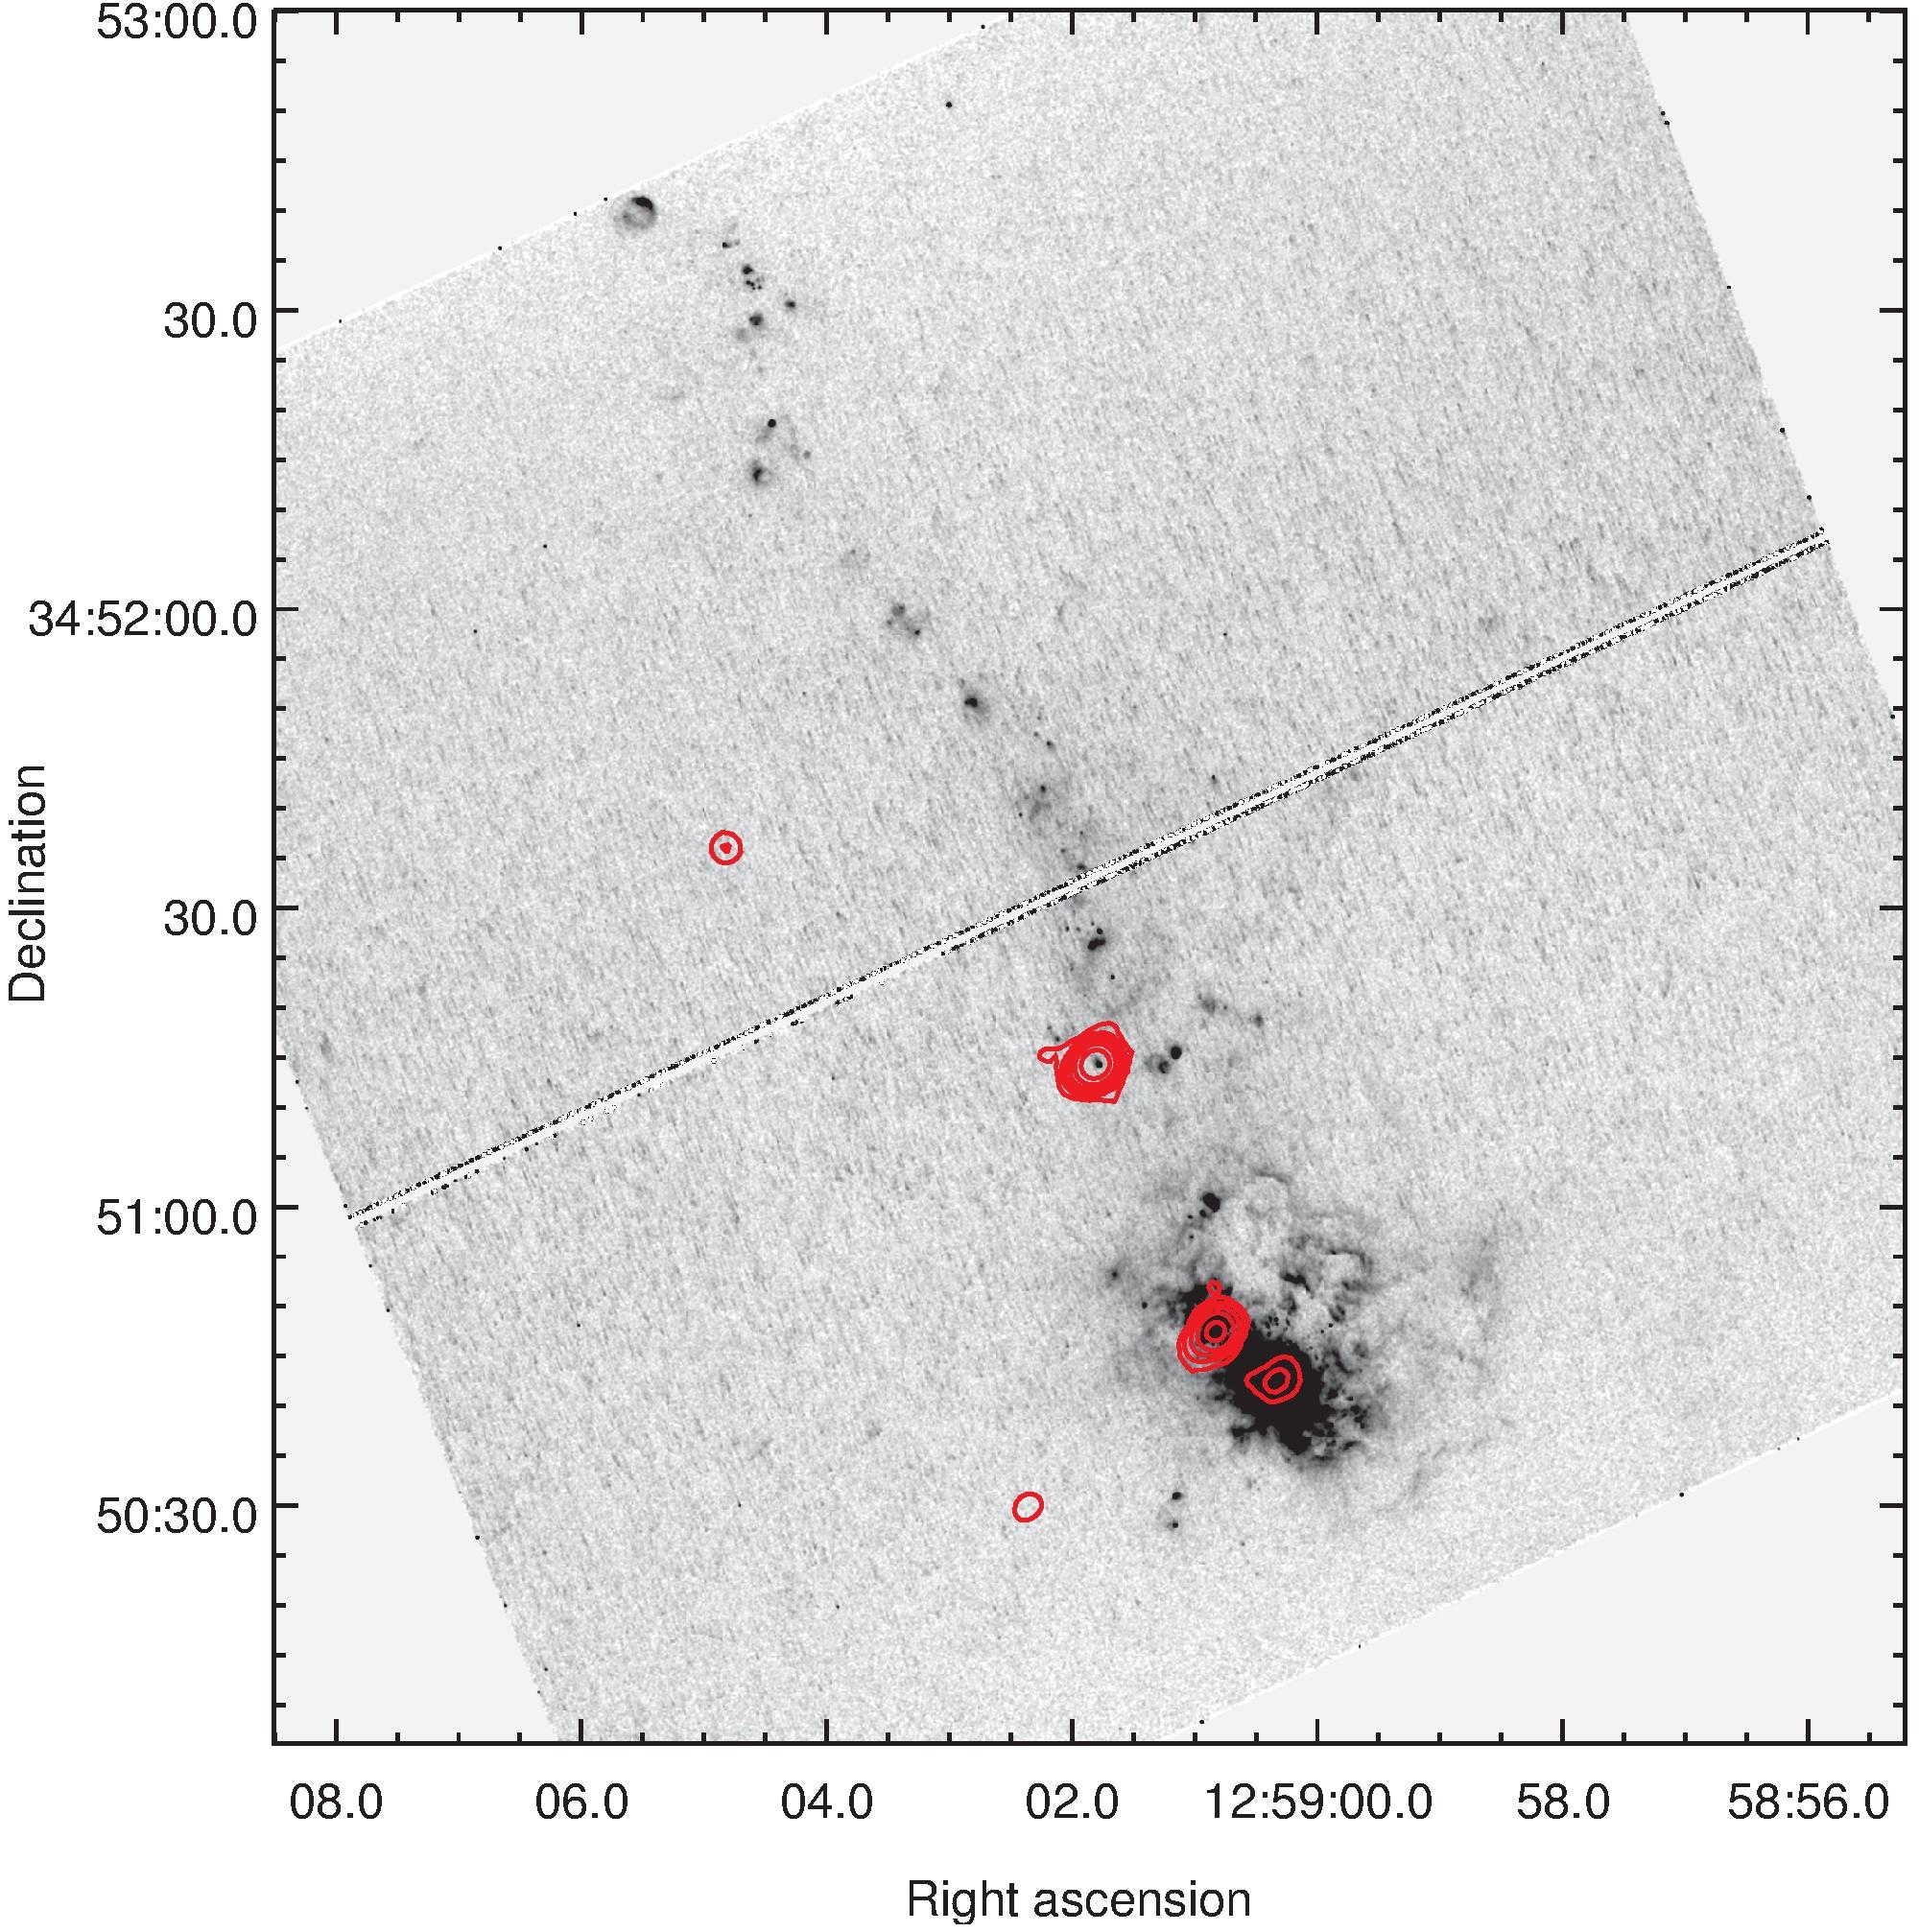
To compare the X-ray emission with the optical emission, we have overlayed in Figures 1 and 2 the X-ray contours over the following images retrieved from various archives: for Mrk 59, an -band Sloan Digital Sky Survey (SDSS) (Abazajian et al., 2009), HST WFC3 F814W (), and HST WFC3 F658N continuum-subtracted H images; for Mrk 71, a ‘Red’ IIIaFRG610 Digital Sky Survey (DSS), and HST ACS F814W () and HST WFPC2 F656N continuum-subtracted H (Drissen et al., 2000) images. The SDSS and DSS images have a large field of view and contain enough stars for aligning the HST and X-ray images to the same astrometric reference frame. To align the optical images, sources were first extracted from the SDSS and DSS images using Sextractor (v2.2.1; Bertin & Arnouts, 1996). Optical sources from the SDSS and DSS images were then matched to the 2MASS catalog for absolute astrometric alignment, giving a coincidence of 32 sources within a 3 radius of 22 and a rms scatter of 061 for Mrk 59, and 93 sources within a 3 radius of 21 and a rms scatter of 058 for Mrk 71. In the same manner, the HST images were matched to the SDSS/DSS reference frame, yielding a coincidence of 23 sources within a 3 radius of 05 and a rms scatter of 012 for Mrk 59, and 6 sources within a 3 radius of 12 and a rms scatter of 031 for Mrk 71. Finally, the Chandra and XMM-Newton images were matched to the SDSS and DSS frames. The Chandra image gave a coincidence of 10 sources within a 3 radius of 20 and a rms scatter of 019 for Mrk 59, while the XMM-Newton images yielded a coincidence of 9 sources within a 3 radius of 37 and a rms scatter of 103 for Mrk 59, and 13 sources within a 3 radius of 35 and a rms scatter of 10 for Mrk 71.111We also tried aligning the XMM-Newton and SDSS reference frames using the 3XMM-DR4 catalog positions (e.g., Watson et al., 2009); (Watson et al. in preparation) as the 3XMM-DR4 catalog provides some astrometric corrections and gains over the XMM-Newton data alone. These positions further improved the overall alignment for the majority of the XMM sources to a rms scatter of 0.6 for Mrk 59, but oddly yielded systematic offsets of 15-20 to the southwest for the two brightest sources IXO 72 and 73, compared to the positions we calculated from our own astrometrically-corrected Chandra and XMM-Newton images. Thus we use our own aligned positions throughout this work. Overall, our optical alignment improved substantially upon the quoted baseline Chandra and XMM-Newton astrometric accuracies of 06 222see http://cxc.harvard.edu/cal/ASPECT/celmon and ″ (e.g., Jansen et al., 2001; Watson et al., 2009), respectively.


2.4 X-ray Counterparts
From the X-ray contour plots in Figures 1 and 2, it appears that Mrk 59 consists of two very bright X-ray point sources (CXOU J125901.85345114.7 and CXOU J125900.87345047.9) and two possible faint ones (CXOU J125904.85345136.6 and CXOU J125903.95345315.3). The X-ray point sources in Mrk 59 are located along the cometary tail, extending from the main H ii region which itself exhibits slight hints of diffuse X-ray emission (CXOU J125900.37345043.0). On the other hand, Mrk 71 has only a few relatively faint X-ray point sources (XMMU J072857.9+691135 and XMMU J072855.2+691305) in addition to traces of diffuse emission associated with its numerous H ii regions (most notably XMMU J072843.0+691123 and XMMU J072830.4+691134). The likelihood of chance superpositions with Galactic X-ray sources and background AGN within the optical extent of either galaxy is small, but non-negligible. From extrapolation of the medium-deep XMM-Newton – relation (e.g., Baldi et al., 2002) to their respective flux limits, we would expect on average 1 foreground/background source within the optical extent of either Mrk 59 and Mrk 71.
Given the high optical source densities in both galaxies and the relative uncertainty in the centroids of the XMM-Newton sources, identifying optical counterparts of XMM-Newton detections with any reasonable degree of certainty is difficult. Identifying counterparts of Chandra sources, however, is substantially more secure. All of the counterpart identifications are shown in Figures 3 and 4 and described in 3.
When we consider an X-ray source to be associated with Mrk 59 or Mrk 71, we also calculate its X-ray luminosity accordingly.
2.5 X-ray Properties
The basic X-ray properties of the sources are listed in Table 1 for Mrk 59 and Table 2 for Mrk 71. By design, all of the sources are detected either in the Chandra 0.5–8.0 keV band or the XMM-Newton 0.5–10.0 keV band. The vast majority of these detections are seen in the soft band (0.5-2.0 keV), while only a minority are detected in the hard band (2-8 keV). Thus, the observed hardness ratios (the definition of which is given in the notes to Table 1) indicate that the majority of the detected objects have predominantly soft spectral characteristics, as expected. Only CXOU J125904.9345136 and XMMU J072857.9691135 exhibit relatively hard spectra. For sources with more than 100 counts, we compute the X-ray fluxes and unabsorbed luminosities from direct spectral fitting. For those below this limit, we calculate these quantities assuming an absorbed power-law model (tbabs*powerlaw) with and Galactic for low hardness-ratio (HR) sources (HR1), and for high hardness-ratio sources (HR1). Note that if the spectrum of a faint source deviates substantially from these average values, then the flux and absorption-corrected luminosity of the source may change as well.
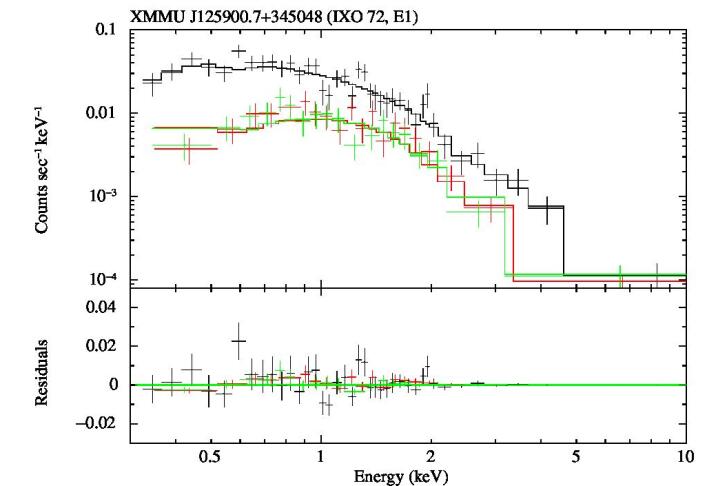
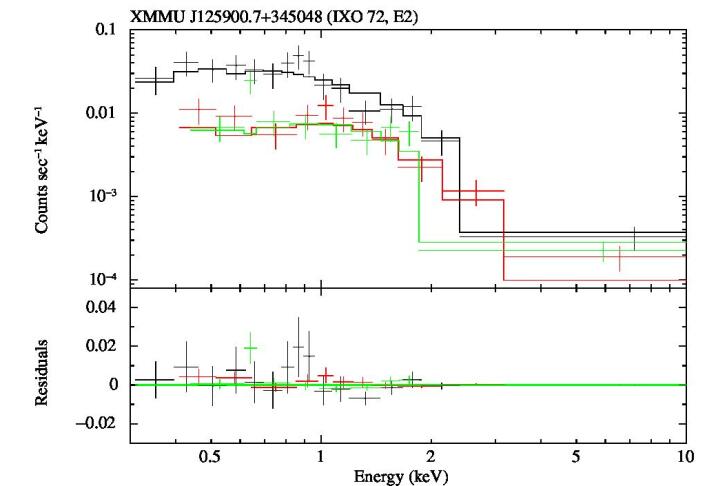
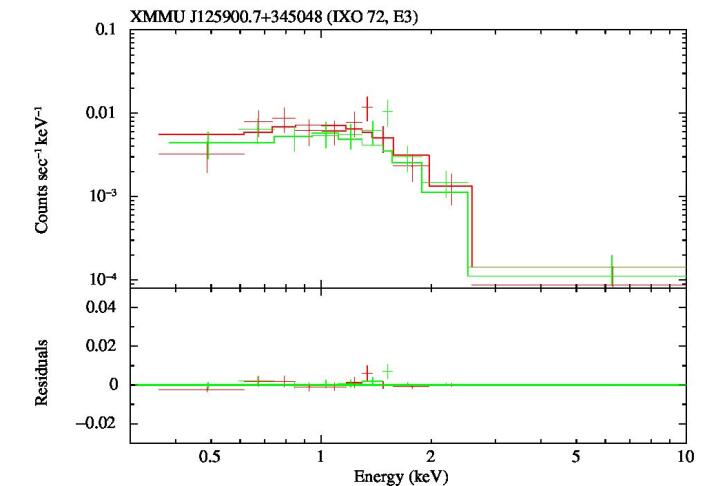
The Chandra and XMM-Newton spectra for the bright sources were analyzed using XSPEC (Arnaud, 1996). Unless stated otherwise, spectral parameter errors are for 90% confidence, assuming one parameter of interest (). None of the sources was affected by pile-up. We fitted the spectra in XSPEC with simple spectral models. The intrinsic , spectral slopes, and normalizations were allowed to vary, while the Galactic column densities and redshifts were fixed at their fiducial values. The X-ray spectra and their best-fit models are shown in Figures 5, 6, and 7. The X-ray fluxes and absorption-corrected luminosities were calculated using these simple models with XSPEC. We grouped the spectra to have at least 15 counts per bin and employed statistics.
We discuss spectral fitting results and hardness ratios for individual sources in 3.
2.6 X-ray Timing Analysis
Although the XMM-Newton and Chandra observations of Mrk 59 were relatively short, we do have adequate statistics to evaluate the short-term timing characteristics for the two bright point sources. Mrk 59 was additionally observed with the ROSAT HRI, so we also can assess its long-term soft-band variability as well. Unfortunately, Mrk 71 was not observed by any previous X-ray observatory and the statistics for the faint sources in this galaxy provide no useful constraints; thus we only discuss Mrk 59 hereafter. To examine objectively the existence of any significant variation in the count rate for the two bright X-ray sources in Mrk 59, we used the Kolmogorov-Smirnov (KS) statistic on the unbinned data to test the null hypothesis that the count rate for each source plus the background rate was constant over the duration of individual exposures. Over the short timescales of our observations (8 hr), neither of the bright sources in Mrk 59 varied significantly at the 90% confidence level.
To constrain longer-term variations for the two bright X-ray point sources in Mrk 59, we compare the XMM-Newton and Chandra observations in the 0.5–10.0 keV flux range. This provides a 10 yr baseline. We also compare these data with the 21.4 ks ROSAT HRI observation on 1992 June 24–27, which provides a 20 yr baseline. To this end, we extracted background-subtracted HRI counts at the position of each source, using apertures of 15 and local backgrounds. Because the ROSAT data do not cover the same band (only the 0.1–2.4 keV range), and do not have good spectral constraints, we can only really compare the 0.5-2.0 keV fluxes which we determined by using best-fitted models to the XMM-Newton and Chandra observations. We discuss long-term variability results for individual sources in the next section.
3 Individual X-ray sources
3.1 Mrk 59
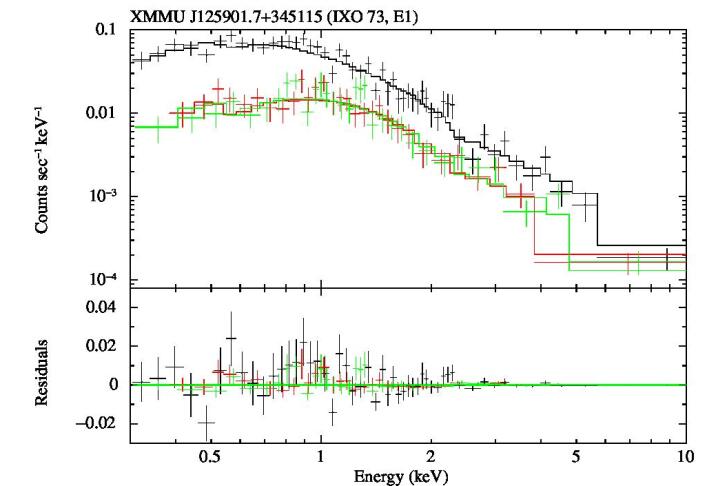
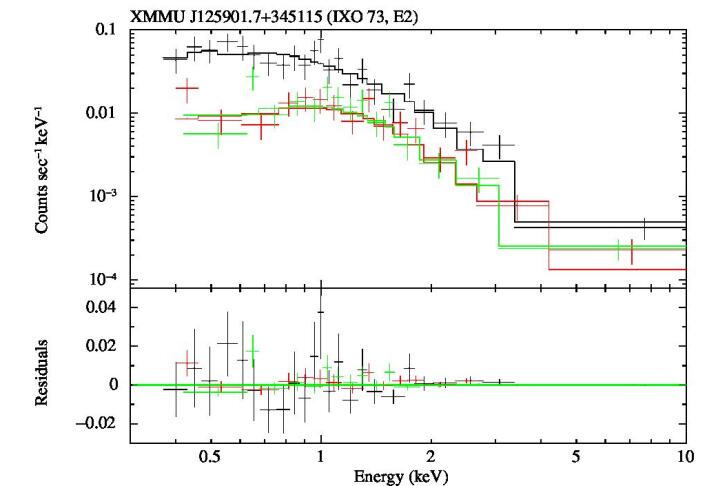
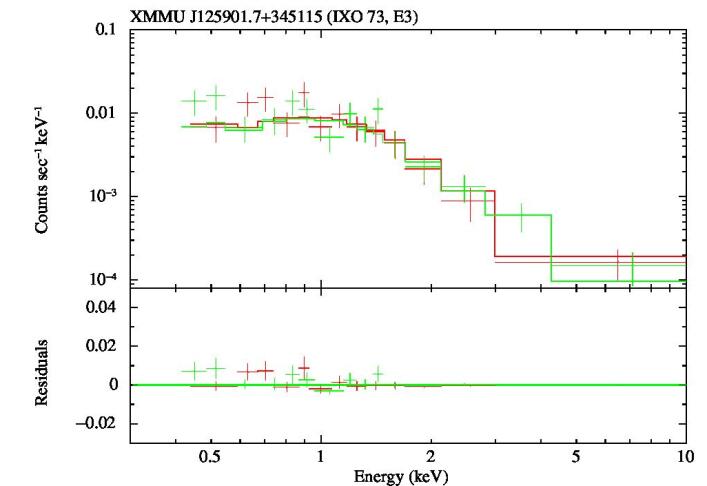
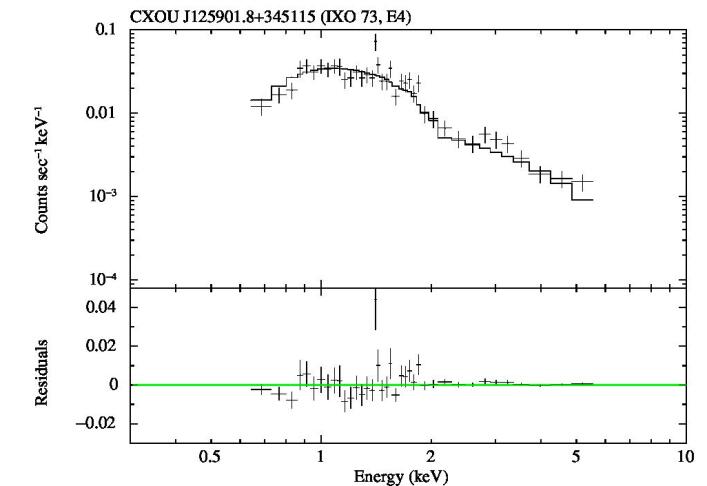
3.1.1 CXOU J125901.8345115 (IXO 73)
CXOU J125901.8345115, also known as IXO 73 (Colbert & Ptak, 2002), is the brightest source in Mrk 59. Its X-ray properties have already been discussed in several studies of ultraluminous X-ray sources (ULXs), based on the same XMM-Newton data analyzed here (e.g., Colbert & Ptak, 2002; Liu & Mirabel, 2005; Liu & Bregman, 2005; López-Corredoira & Gutiérrez, 2006; Stobbart et al., 2006; Heil et al., 2009; Yang, 2012).
Comparing the Chandra position of IXO 73 with the HST WFC3 data in Figure 3, we see that the X-ray source is coincident with a moderately isolated bright point source with (, , , ), lying 01 to the northwest. At the distance of Mrk 59, this corresponds to an uncorrected absolute magnitude of , comparable to the intrinsic brightness of the brightest late-type supergiant O stars or hypergiant stars. From the narrow-band F658N image, it can be seen that IXO 73 is associated with a luminous H ii region in Mrk 59. Stobbart et al. (2006) performed spectral fitting for IXO 73 using the XMM-Newton data, and showed that its spectrum can be fitted by a number of simple and physically-motivated models. We carried out joint spectral fitting of the XMM-Newton and Chandra data for IXO 73, adopting one of their simple models, the one which includes a power-law continuum plus a cool disk blackbody [tbabs*ztbabs*(pow+diskbb)], so as to provide a point of comparison with the extensive Stobbart et al. (2006) work. We fixed the Galactic neutral hydrogen column density to its fiducial value and allowed the intrinsic column density and two-component temperatures and normalizations to vary. We initially adopted a simple model wherein all epochs could be characterized by a single set of parameters. Only the overall normalizations were allowed to vary by a constant value to account for calibration uncertainties and/or flux variations. With this model, all epochs were acceptably fitted by the following parameter set: cm-2, , photons cm-2 s-1 keV-1 at 1 keV, keV, [in units of ((/km)/(D/10 kpc))2 ], and relative normalization factors of 1.00 (fixed), 0.79, 0.61 and 2.28 for epochs E1 to E4, with a for 235 degrees of freedom. If we decouple the model parameters for each epoch, and let all temperature and normalization components vary separately, we find mild shifts in the best-fitted temperatures and normalizations, with a for 218 degrees of freedom. The errors on the parameter values for each epoch are large, however, such that the values completely overlapped amongst the epochs within their respective errors. The improvement over the fixed parameter fit was only at the level, according to the f-test. Thus, we adopt the simpler fixed model. These simple model parameter values are in good agreement with those found by Stobbart et al. (2006). The large changes in renormalization factors between different epochs demonstrate that IXO 73 has varied by at least a factor of 3.7 over a 10 yr span. Such strong variability is not uncommon for ULXs. The observed 0.5–10.0 keV fluxes and unabsorbed luminosities are given in Table 1, while the individual spectra for each epoch are shown in Figure 6.
Using the same spectral model as above, we obtained a soft-band ROSAT HRI flux of erg cm-2 s-1 for IXO 73. Comparing this to the 0.5–2.0 keV fluxes of erg cm-2 s-1 from XMM-Newton and erg cm-2 s-1 from Chandra, we find that IXO 73 has experienced a soft-band long-term variability of a factor of 2.
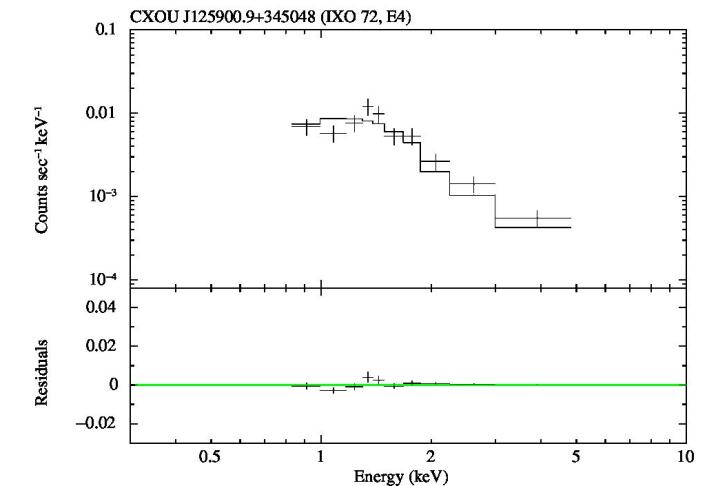
3.1.2 CXOU J125900.9345048 (IXO 72)
CXOU J125900.9345048, also known as IXO 72 (Colbert & Ptak, 2002), is the second brightest source in Mrk 59. It too has been previously well-characterized in several studies of ULXs, using the XMM-Newton data (e.g., Colbert & Ptak, 2002; Liu & Bregman, 2005; López-Corredoira & Gutiérrez, 2006; Sánchez-Sutil et al., 2006; Yang, 2012).
Overlaying the Chandra X-ray contours of IXO 72 on the HST WFC3 images in Figure 3, we see that the X-ray source is located in a dense stellar cluster and is best-matched by a relatively isolated point source with (, , ) which lies 01 to the northwest. At the distance of Mrk 59, this corresponds to an uncorrected absolute magnitude of , comparable to the intrinsic brightness of a late-type supergiant O star. This identification is however not unique: there are a few other objects several magnitudes fainter () which could also be matches to the X-ray source within the positional error. Thus, some caution should be exercised when identifying the X-ray source. IXO 72 does resides however on the outskirts of a massive H ii complex and lies on top of a significant knot of H emission coincident with the location of the brightest optical candidate counterpart. This implies that the X-ray source and its presumed optical counterpart are most likely associated with this H ii region complex. The spectral observation may include all (both point-like and diffuse) emission within 1–2 of the true counterpart of IXO 72. Thus, the XMM-Newton observations of IXO 72 may contain some slight contamination from CXOU J125900.3345043. However, given the flux difference between the 2 sources and the consistency of the fluxes of IXO 72 between the E3 and E4 epochs (the latter being based on Chandra data), we believe that contamination should not greatly affect the XMM-Newton results, unless CXOU J125900.3345043 varied dramatically.
We carried out a joint spectral fitting of the XMM-Newton and Chandra data for IXO 72, again adopting a simple model, [tbabs*ztbabs*(pow+diskbb)], to facilitate comparison to IXO 73 and the work of Stobbart et al. (2006). As with IXO 73, we fixed the Galactic neutral hydrogen column density to its fiducial value, and allowed the intrinsic column density, two-component temperatures and normalizations to vary. We initially adopted the simple model wherein all epochs can be described by a single parameter set, with only the overall normalizations allowed to vary by a constant value. All epochs were acceptably fitted by this model with parameter values of cm-2, , photons cm-2 s-1 keV-1 at 1 keV, keV, [in units of ((/km)/(D/10 kpc))2 ], and and normalization factors of 1.00 (fixed), , , and for the different epochs, with a for 137 degrees of freedom. If we decouple the model parameters for the XMM-Newton and Chandra spectra and fit the data again, we see mild shifts in the best-fitted values and a improvement in for 128 degrees of freedom according to the f-test, although the values completely overlap amongst the epochs within their respective errors. Stobbart et al. (2006) did not include IXO 72 in their analysis, but these simple model parameter values are in general agreement with those found by them for other ULXs. The XMM-Newton renormalization factors for epochs E2 and E3 imply the source has undergone only mild variability (1.1) over a 10 yr span. The observed 0.5–10.0 keV fluxes and unabsorbed luminosities are given in Table 1, while the individual spectra for each epoch are shown in Figure 5.
Using the same spectral model as above, we obtained a soft-band ROSAT HRI flux of erg cm-2 s-1 for IXO 72. Comparing this to the 0.5–2.0 keV fluxes of erg cm-2 s-1 from XMM-Newton and erg cm-2 s-1 from Chandra, the soft band fluxes of IXO 72 appears to have remained constant over a 20 yr timespan within the errors.
3.1.3 CXOU J125900.3345043
CXOU J125900.3345043 is seen by Chandra as distinct from IXO 72, but the two sources are not separate at the resolution of XMM-Newton. This source may be extended, as its radial profile appears marginally broader (a 2 deviation based on Cash statistics; Cash 1979) as compared to the Chandra PSF. Comparing the Chandra position with the HST WFC3 data in Figure 3, we see that the X-ray source aligns well with a dense stellar cluster and massive H ii complex at the “head” of Mrk 59 (see also Yang, 2012). The hardness ratio of the source indicates it is relatively soft, but given the low number of counts, it remains unclear whether the X-ray emission arises from hot gas or the cumulative sum of X-ray point sources in this region.
3.1.4 CXOU J125904.9345136
CXOU J125904.9345136 is very weakly detected by Chandra. Its location is marginally consistent with a bright extended optical counterpart 04 away, with magnitudes of and . Based on the HST WFC3 F658N image, this objects lacks any significant rest-frame H emission at the redshift of Mrk 59, however, which suggests that this object is likely a background AGN. However, an X-ray binary in the tail of Mrk 59 cannot be ruled out.
3.1.5 CXOU J125903.9345315
CXOU J125903.9345315 is only weakly detected at X-ray wavelengths and is spatially coincident with a object which is marginally detected at the limit of the SDSS imaging. Comparison of Chandra and XMM-Newton fluxes shows no variabilty over a time span of 10 yr, within the uncertainties. This could be a background object, a foreground star, or a possible X-ray binary in the trailing tail of Mrk 59.
3.1.6 CXOU J125903.9345353
CXOU J125903.9345353 is detected by both Chandra and XMM-Newton, and is spatially coincident with a point-like object that is clearly seen in both SDSS and WISE imaging. The resulting optical through mid-infrared spectral energy distribution of this counterpart is nearly constant in flux () between 4000Å and 12m, indicative of either non-thermal or multiple emission processes. The Palomar H imaging of Gil de Paz et al. (2003) shows hints of rest-frame H emission at the redshift of Mrk 59, at the 1–2 level in the vicinity of this object, but this could just be due to a poor continuum subtraction. Finally, the X-ray flux is seen to vary by a factor of 4–5 between the XMM-Newton and Chandra observations. The above properties suggest that the counterpart is likely a background AGN, but a spectrum is needed to confirm this.
3.2 Mrk 71
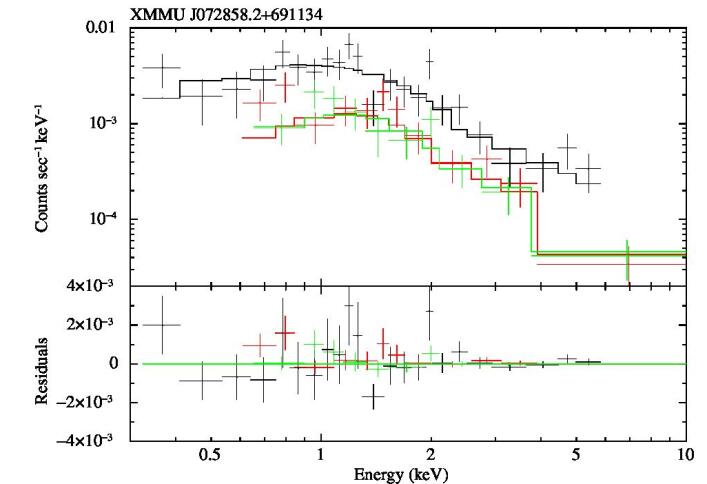
3.2.1 XMMU J072858.2+691134
XMMU J072858.2+691134 is the brightest source in Mrk 71. Comparing the XMM X-ray contours with the HST WFC3 data in Figure 4, we see that the X-ray source is aligned to within 01 with an extended object with . It appears to have a face-on spiral morphology. However, it does not show any rest-frame H emission at the redshift of Mrk 71. This suggests that it is likely a background galaxy hosting an AGN.
We carried out spectral fitting of the XMM-Newton data for this object. Our choice of the simple power-law model [tbabs*ztbabs*(pow)] was guided by the limited number of counts and the likely optical identification above. Again, we fixed the Galactic neutral hydrogen column density to its fiducial value and allowed the intrinsic column density and power-law slope and normalization to vary. The spectra were acceptably fitted by this model with parameter values of cm-2 and , with a for 42 degrees of freedom (see Figure 7). The observed 0.5–10.0 keV flux is given in Table 2, but we do not calculate a luminosity because of the unknown redshift of the likely galaxy/AGN identification.
3.2.2 XMMU J072855.4691305
XMMU J072855.4691305 is the second brightest X-ray source in Mrk 71. Overlaying the XMM X-ray contours over the HST WFC3 images in Figure 4, we see that the X-ray source is aligned to within 08 with a point-like object with . This object lies just off the HST WFPC2 F656N image, but happens to be covered by the CFHT H image shown as Fig. 1 in Drissen et al. (2000) and by the Kapteyn Telescope H survey of James et al. (2004). In the Kapteyn Telescope image (rightmost panel of top cutout in Figure 4), the source is spatially coincident within 1′′ with a bright, very compact H ii region. This object is also strongly detected by WISE at 3.6m and 4.5m. At the distance of Mrk 71, it would have an uncorrected absolute magnitude of , placing it among the brightest stars known (certainly much brighter than the nearby Luminous Blue Variable NGC 2861 V1, also detected in Mrk 71, Drissen et al., 2000). Within the uncertainty of the XMM-Newton position, however, there are many other objects several magnitudes fainter (), and thus this identification is very intriguing, but not unique. Another alternative is that this point-like object is a foreground star, although the spatial coincidence of such a bright (rare) object with a compact H ii region in Mrk 71 seems improbable. The XMM-Newton data are not sufficient to characterize the spectral nature of the X-ray emission strongly. With an X-ray luminosity of erg s-1, the object would be comparable to Galactic accreting or colliding-wind HMXBs.
There is another faint potential X-ray point source within the field-of-view of the cutout (XMMU J072851.7691255), traced out by the X-ray contours. It is not formally detected, possibly due to its marginal blending with XMMU J072855.4691305 itself. This object also lies just off the HST WFPC2 F656N image, but is in the field of view of both H images from Drissen et al. (2000) and James et al. (2004). It is seen to be spatially coincident with a bright, compact H ii region, and thus could be associated with either another faint X-ray binary or extended thermal plasma in Mrk 71. This potential X-ray source has no outstanding optical counterpart, but overlaps with many dozens of faint stars with –24.
3.2.3 XMMU J072843.4691123
XMMU J072843.4691123 is detected and resolved by XMM-Newton, with an extent of as measured by the 3XMM-DR4 catalog (Watson et al., 2009). Given the low number of counts, it remains unclear whether it is truly extended or comprised of a few point sources. Comparing the XMM-Newton position with the HST ACS data in Figure 4, we see that the extent of the X-ray source aligns well with a dense stellar cluster and massive H ii complex in the head of Mrk 71.
3.2.4 XMMU J072830.4691132
XMMU J072830.4691132 is very marginally detected by XMM-Newton. Given the low number of counts, it remains unclear whether it is extended or point-like. Comparing the XMM-Newton position with the HST ACS data in Figure 4, we see that the extent of the X-ray source again aligns well with a dense stellar cluster and a massive H ii complex, 11 to the west of the main body of Mrk 71.
| (1) | (2) | (3) | (4) | (5) | (6) | (7) | (8) | (9) | (10) |
|---|---|---|---|---|---|---|---|---|---|
| Source Name | RA | Dec | Detector | Counts | HR | Comments | |||
| Mrk 59 | |||||||||
| CXOU J125900.3345043 | 12 59 00.33 | 34 50 42.9 | ACIS-I | 0.5 | 1.1 | — | possibly extended | ||
| XMMU J125900.7345048 (IXO 72, E1) | 12 59 00.81 | 34 50 48.2 | MOS1 | 11.4 | 21.5 | 23.0 | ; point source | ||
| MOS2 | |||||||||
| XMMU J125900.7345048 (IXO 72, E2) | MOS1 | 10.2 | 19.2 | ” | |||||
| MOS2 | |||||||||
| — | — | ||||||||
| XMMU J125900.7345048 (IXO 72, E3) | MOS1 | 9.8 | 18.5 | ” | |||||
| MOS2 | |||||||||
| CXOU J125900.9345048 (IXO 72, E4) | 12 59 00.83 | 34 50 47.7 | ACIS-I | 11.0 | 20.7 | ” | |||
| XMMU J125901.7345115 (IXO 73, E1) | 12 59 01.83 | 34 51 13.9 | MOS1 | 23.0 | 38.9 | 21.7 | ; point source | ||
| MOS2 | |||||||||
| XMMU J125901.7345115 (IXO 73, E2) | MOS1 | 18.3 | 31.1 | ” | |||||
| MOS2 | |||||||||
| — | — | ||||||||
| XMMU J125901.7345115 (IXO 73, E3) | MOS1 | 14.1 | 23.8 | ” | |||||
| MOS2 | |||||||||
| CXOU J125901.8345115 (IXO 73, E4) | 12 59 01.81 | 34 51 14.5 | ACIS-I | 52.3 | 88.8 | ” | |||
| CXOU J125904.8345136 | 12 59 04.82 | 34 51 36.3 | ACIS-I | 0.2 | — | 22.1 | background AGN? | ||
| — | |||||||||
| XMMU J125904.0345315 (E1) | 12 59 04.02 | 34 53 14.5 | MOS1 | 0.5 | — | 25.4 | background AGN? | ||
| MOS2 | — | ||||||||
| XMMU J125904.0345315 (E2) | MOS1 | 0.7 | — | ” | |||||
| MOS2 | — | ||||||||
| — | — | ||||||||
| XMMU J125904.0345315 (E3) | MOS1 | 1.8 | — | ” | |||||
| MOS2 | |||||||||
| CXOU J125903.9345315 (E4) | 12 59 03.90 | 34 53 15.0 | ACIS-I | 0.4 | — | ” | |||
| XMMU J125903.9345353 (E1) | 12 59 03.96 | 34 53 53.4 | MOS1 | 0.5 | — | 19.7 | background AGN? | ||
| MOS2 | |||||||||
| XMMU J125903.9345353 (E2) | MOS1 | 0.7 | — | ” | |||||
| MOS2 | |||||||||
| — | — | ||||||||
| XMMU J125903.9345353 (E3) | MOS1 | 0.6 | — | ” | |||||
| MOS2 | |||||||||
| CXOU J125903.9345353 (E4) | 12 59 03.92 | 34 53 53.6 | ACIS-I | 3.3 | — | ” | |||
Notes: – Column 1: Source name given as CXOU JHHMMSS.SDDMMSS or XMMU JHHMMSS.SDDMMSS. Column 5: Background-subtracted 0.5-8.0 keV counts for Chandra ACIS instrument and for the XMM-Newton and MOS instruments. The errors for the source and background counts were computed following the method of Gehrels (1986) and were then combined following the “numerical method” described in 1.7.3 of Lyons (1991). Sources denoted by ’—’ were strongly affected by chip gaps. Column 6: Hardness ratios, defined in a similar manner to those of the Chandra (Evans et al., 2010) and XMM Serendipitous Source Catalogs (Watson et al., 2009) as the ratio of the difference between the hard-band (2–8 keV) and soft-band (0.5-2 keV) counts over the sum of the hard- and soft-band counts. The quoted hardness ratios have been corrected for differential vignetting between the hard band and soft band using the appropriate exposure maps. Errors for this quantity are calculated following the “numerical method” described in Sect. 1.7.3 of Lyons (1991). Hardness ratios could not be calculated for sources denoted by ’—’. For reference, a power law absorbed by Galactic would have hardness ratios of , , and with the , MOS, and ACIS-I instruments. Column 7: Observed, aperture-corrected 0.5–10 keV fluxes in units of 10-14 erg cm-2 s-1 from the best-fitted models to the X-ray spectra. For faint sources ( 100 counts), fluxes were calculated assuming an average absorbed power-law spectrum with cm-2 and . Column 8: Absorption-corrected 0.5–10 keV luminosities in units of 1038 erg s-1 from the best-fit models to the X-ray spectra. Column 9: Aperture-corrected F814W (“”) Vega magnitudes for sources imaged by HST; otherwise SDSS catalog magnitudes. See details on individual sources in 3.
| (1) | (2) | (3) | (4) | (5) | (6) | (7) | (8) | (9) | (10) |
|---|---|---|---|---|---|---|---|---|---|
| Source Name | RA | Dec | Detector | Counts | HR | Comments | |||
| XMMU J072830.4691132 | 07 28 30.36 | 69 11 31.9 | MOS1 | — | 0.14 | 0.03 | extended? | ||
| MOS2 | |||||||||
| XMMU J072858.2691134 | 07 28 58.18 | 69 11 33.6 | MOS1 | 3.4 | — | 19.7 | background galaxy/AGN | ||
| MOS2 | |||||||||
| XMMU J072843.4691123 | 07 28 43.38 | 69 11 23.1 | MOS1 | 0.3 | 0.08 | extended | |||
| MOS2 | |||||||||
| XMMU J072855.4691305 | 07 28 55.45 | 69 13 05.0 | MOS1 | 0.5 | 0.06 | 17.6 | ; point source | ||
| MOS2 |
Notes: – Same as Table 1.
4 Discussion
4.1 Mrk 59
As seen in Figure 1, Mrk 59 exhibits two very bright point sources, with 0.5–10 keV luminosities of 21039 erg s-1 and (2–9)1039 erg s-1 for IXO 72 and 73, respectively. In addition, there is faint emission around the H ii complex constituting the cometary “head” which amounts to a few percent of the total X-ray emission. The two bright X-ray objects are spatially coincident with compact H ii regions, suggesting they are associated with HMXBs or supernovae. Their X-ray spectral and variability properties favor the HMXB hypothesis in both cases. As such, their proximity to compact H ii regions also implies that both they and their counterparts are quite young and potentially quite massive. Notably, IXO 73 is spatially coincident with an uncorrected star. Because the 2 X-ray sources appear to be associated with single objects, their luminosities place them in the range of the so-called ultraluminous X-ray sources (ULXs; e.g. Makishima et al., 2000).
The derived best-fit H i column density for both IXO 72 and IXO 73 are somewhat lower than the adopted peak H i column density read off the 21 cm maps of Thuan et al. (2004a). This may imply that both objects reside either on the near side of the galaxy or within a large low-density cavity. The upper limits for both sources are still within 30–50% of the peak value, however, and could be consistent with these maps: the radio beam size being 30″, a X-ray source which is slightly spatially offset from the position of the peak H i column density would be associated with a lower column density.
ULXs are rare. Most galaxies, including our own Milky Way, have none, and galaxies that do host a ULX usually have only one. Mrk 59 possesses two. In a Chandra study of three of the most metal deficient BCDs known in the local universe, SBS 0335–052W, I Zw 18 and SBS 0335–052E, with 12 + log O/H = 7.12 (2.6% ), 7.17 (2.9% )and 7.31 (4.0% ), respectively, Thuan et al. (2004b) found also that more than 90% of the X-ray emission of these 3 BCDs arise from point-like sources, and that the 0.5–10 keV luminosities of these point sources are in the ULX domain, with X-ray luminosities in the (1.3–8.5)1039 erg s-1 range. Both SBS 0335–052E and I Zw 18 contains one ULX, while SBS 0335 –052W contains two.
Thuan et al. (2004b) suggested that the high X-ray luminosities of HMXBs in BCDs could be the result of their lower metallicities. The conclusion that ULXs occur preferentially in lower-metallicity systems has been recently strengthened by the work of Prestwich et al. (2013) who observed with Chandra 22 more low-metallicity (12 + log O/H 7.65 or /11) objects, the majority of them being BCDs. They detected 3 more objects, with X-ray luminosities again in the range of ULXs. Adding the X-ray detections of SBS 0335–052W, I Zw 18 and SBS 0335–052E by Thuan et al. (2004b), Prestwich et al. (2013) constructed a low-metallicity galaxy sample which included a total of 6 X-ray detections. They then compare the low-metallicity sample to a control galaxy sample with higher metallicities, and conclude that ULXs occur preferentially in the metal-poor sample with a formal statistical significamce of 2.3 . The detection of the 2 ULXs in Mrk 59 brings to 7 the number of low-metallicity BCDs known to contain such objects.
4.2 Mrk 71
Figure 2 shows the four detected X-ray sources associated with Mrk 71. The strongest two objects are point-sources and have relatively clear optical counterparts. We identify the brightest with a background galaxy/AGN, while the second brightest coincides with an exceptionally bright point-like object and compact H ii region, suggesting it may be an extremely luminous and massive star. The properties from the limited X-ray data appear consistent with these identifications. The two remaining X-ray sources are faint and potentially extended, and appear to be associated with high surface brightness H ii complexes at the end of the stellar body, regions I and III in the notation of Drissen et al. (2000). HST imaging of region I by Drissen et al. (2000) and Thuan & Izotov (2005) shows that it contains two young compact clusters, A and B. A Luminous Blue Variable (LBV) star was also discovered by Drissen et al. (2000) in region I. The spatial resolution of the X-ray map does not allow to say whether the X-ray source in region I, XMMU J072843.4691123, is associated with the overall H ii complex or individual objects, such as the LBV star.
4.3 ULXs and low-metallicity environments
How may one understand the observed statistical increase of ULXs in low-metallicity BCDs? Three main scenarios have been proposed to account for the very high luminosity of ULXs (see e.g. Zampieri & Roberts (2009) and references therein). A first scenario associates ULXs with stellar mass black holes (BH), with masses less than about 20 . Their high X-ray luminosities come from either anisotropic emission (or beaming) or super-Eddington accretion via a massive accretion disc, the structure of which has been somehow modified, or both. In the second scenario, the compact object is considerably more massive, being an intermediate-mass black hole (IMBH) with mass in excess of 100 and up to thousands . The accretion rate would not be in the super-Eddington, but in the usual sub-Eddington regime. The third scenario is intermediate between the first two: it also invokes a stellar mass BH, but in a slightly higher mass range, between 30 and 90 . To account for the high X-ray luminosity, the accretion needs to be super-Eddington (by a factor of a few) and modest beaming (a beaming factor of 0.5) is required. While in the first scenario with beaming and super-Eddington accretion, a direct link between low-metallicity and ULXs is not clearly evident, we can see more of such a link in the second and third scenarios. Metal-poor environments do favour the formation of massive stars, and hence of massive black holes (e.g. Bromm & Larson, 2004). Although the second and third scenarios have their pros and cons , Zampieri & Roberts (2009) have presented plausible arguments in favor of the third scenario. At the end of their lives, subsolar metallicity stars with masses above 30–40 retain their massive envelopes at the time of explosion because these are not removed efficiently through line-driven winds as in solar metallicity stars. So most of the star collapses to a BH with a mass comparable to that of the pre-supernova star (Fryer, 1999). Their masses would not significantly exceed 80–90 because a more massive star would undergo pulsational pair-instability in its core and eject most of its envelope. This scenario has the advantage over the IMBH scenario in that it does not require a new exotic mechanism to produce very massive BHs in starbursts, but simply appeals to ordinary stellar evolution coupled with metallicity effects. It is also more attractive than the stellar mass BH with 20 scenario: with less extreme beaming factors and violations of the Eddington limit, it does not require extreme accretion scenarios.
However, while metallicity plays a important role in determining the X-ray luminosities of HMXBs, it cannot be the only factor as ULXs in the same metallicity environment have different X-ray luminosities. Thus, the E and W components of the SBS 0335–052 system have about the same metallicities, but of SBS 0335–052W is 2.4 times larger than that of SBS0335–052E. The X-ray luminosities of the two sources in Mrk 59 also differ by a factor of 2. The age of the burst is likely to be also a factor. As the timescale for HMXB formation is 3–10 Myr and the maximum number of HMXBs is expected to occur 20–50 Myr after the starburst, then we may expect, in a statistical sense, that the HMXB X-ray luminosity depends on the age of the starburst. If we use the equivalent width of the H emission line EW(H) as an age indicator: the W component has EW(H) = 80 Å, corresponding to a starburst age of 4 Myr (using the instantaneous star formation model with = 0.001, a Salpeter slope for the stellar initial mass function and = 100 of Leitherer et al., 1999), while the E component has EW(H) = 190 Å, corresponding to a younger starburst age of 3 Myr, and hence to a lower HMXB X-ray luminosity. As for the objects studied here, the X-ray sources in Mrk 71 are considerably weaker than those in Mrk 59, although the two BCDs have about the same metallicity. The X-ray luminosities of the point-source and two extended objects in Mrk 71 are at least 1–2 orders of magnitude lower than that of their counterparts in Mrk 59. The high surface brightness H ii region in Mrk 71 has EW(H) = 357Å as compared to EW(H) = 157Å for Mrk 59 (Izotov et al., 1997). Using the instantaneous model of Leitherer et al. (1999) with the same parameters as described before, these EW(H) correspond to starburst ages of 2.5 Myr and 4 Myr, respectively. Thus the weakness of the X-ray sources in Mrk 71 to be due to the fact that HMXBs have not had time to form, the onset of HMXB formation starting at 3 Myr.
Admittedly, these are only two suggestive examples. A more extensive study with a larger statistical sample will be needed to demonstrate or eliminate the hypothesis that the HMXB X-ray luminosities are correlated with the age of the starburst.
5 Conclusions
We have investigated the X-ray emission of the two cometary Blue Compact Dwarf (BCD) galaxies Mrk 59 and Mrk 71, based on XMM and Chandra observations. Our main findings are the following:
1. Mrk 59 contains two very bright X-ray point sources, IXO 72 and IXO 73, with 0.5 – 10 keV luminosities of (1.8–2.1)1039 and (2.4-8.9)1039 erg s-1, respectively. The cometary “head” H ii complex is also faintly detected, its diffuse emission constituting a few percent of the total X-ray emission from the galaxy. Both IXO 72 and IXO 73 possess optical counterparts, IXO 72’s counterpart being potentially identified as an individual luminous, massive star while IXO 73’s counterpart is a bright stellar object located in an slightly resolved compact H ii region. The above identifications suggest that both IXO 72 and IXO 73 are single objects, thus qualifying them as legitimate ultraluminous X-ray (ULX) sources. The 0.5 – 10 keV X-ray flux of IXO 72 has remained approximately constant over the past 10 yr, while that of IXO 73 has varied by a factor of 4 over the same period. The X-ray spectra of both sources are typical of ULXs. Such high X-ray luminosities may be related to the low metallicity of Mrk 59 (0.2 solar).
2. Mrk 71 contains four faint X-ray sources. The brightest one is spatially coincident with a background spiral galaxy. The second brightest one is coincident with a very compact H ii region and a bright star; if associated with Mrk 71, this star is extremely luminous and among the brightest stars known. The other two faint X-ray sources are associated with large H ii complexes. All three sources are 1–2 orders of magnitude fainter the Mrk 59 X-ray sources. As Mrk 71 has the same metallicity as as Mrk 59, metallicity cannot be the only factor in determining X-ray luminosities. The age of the starburst may play a role.
6 Acknowledgements
T.X.T. acknowledges the support of NASA grant NAG5-12937. F.E.B. acknowledges support for this project from Basal-CATA (PFB-06/2007), CONICYT-Chile (under grants FONDECYT 1141218 and Anillo ACT1101), Project IC120009 ”Millennium Institute of Astrophysics (MAS)”, funded by the Iniciativa Científica Milenio del Ministerio de Economía, Fomento y Turismo de Chile, and Chandra Postdoctoral Fellowship grant number PF4-50032 awarded by the Chandra X-ray Center, which is operated by the Smithsonian Astrophysical Observatory for NASA under contract NAS8-03060.
This research has made use of data obtained from the High Energy Astrophysics Science Archive Research Center (HEASARC), provided by NASA’s Goddard Space Flight Center and NASA/ESA Hubble Space Telescope, obtained from the data archive at the Space Telescope Science Institute. STScI is operated by the Association of Universities for Research in Astronomy, Inc. under NASA contract NAS 5-26555. This research also made use of software provided by the Chandra X-ray Center (CXC) in the application package CIAO and SAOImage DS9, developed by Smithsonian Astrophysical Observatory. Funding for the SDSS and SDSS-II was provided by the Alfred P. Sloan Foundation, the Participating Institutions, the National Science Foundation, the U.S. Department of Energy, the National Aeronautics and Space Administration, the Japanese Monbukagakusho, the Max Planck Society, and the Higher Education Funding Council for England. The SDSS was managed by the Astrophysical Research Consortium for the Participating Institutions. The Digitized Sky Surveys were produced at the Space Telescope Science Institute under U.S. Government grant NAG W-2166. The images of these surveys are based on photographic data obtained using the Oschin Schmidt Telescope on Palomar Mountain and the UK Schmidt Telescope. The plates were processed into the present compressed digital form with the permission of these institutions.
References
- Abazajian et al. (2009) Abazajian, et al. 2009, ApJS, 182, 543
- Arnaud (1996) Arnaud, K. A. 1996, in ASP Conf. Ser. 101: Astronomical Data Analysis Software and Systems V, vol. 5, 17–20
- Asplund et al. (2009) Asplund, M., Grevesse, N., Sauval, A.J., & Scott, P. 2009, ARA&A, 47, 481
- Baldi et al. (2002) Baldi, A., Molendi, S., Comastri, A., Fiore, F., Matt, G., & Vignali, C. 2002, ApJ, 564, 190
- Bertin & Arnouts (1996) Bertin, E., & Arnouts, S. 1996, A&AS, 117, 393
- Bromm & Larson (2004) Bromm, V., & Larson, R.B. 2004, ARAA, 42, 79
- Cash (1979) Cash, W. 1979, ApJ, 228, 939
- Colbert & Ptak (2002) Colbert, E. J. M., & Ptak, A. F. 2002, ApJS, 143, 25
- De Young & Heckman (1994) De Young, D.S., & Heckman, T.M. 1994, ApJ, 431, 598
- Drissen et al. (2000) Drissen, L., Roy, J.-R., Robert, C., Devost, D. & Doyon, R. 2000, AJ, 119, 688
- Ebeling (2003) Ebeling, H. 2003, MNRAS, 340, 1269
- Evans et al. (2010) Evans, I. N., Primini, F. A., Glotfelty, K. J., et al. 2010, ApJS, 189, 37
- Fabbiano et al. (1992) Fabbiano, G., Kim, D.-W., & Trinchieri, G. 1992, ApJS, 80, 531
- Fryer (1999) Fryer, C. L., 1999, ApJ, 522, 413
- Gehrels (1986) Gehrels, N. 1986, ApJ, 303, 336
- Gil de Paz et al. (2003) Gil de Paz, A., Madore, B. F., & Pevunova, O. 2003, ApJS, 147, 29
- Heil et al. (2009) Heil, L. M., Vaughan, S., & Roberts, T. P. 2009, MNRAS, 397, 1061
- Izotov & Thuan (2011) Izotov, Y.I., & Thuan, T.X. 2011, ApJ, 734, 82
- Izotov et al. (1997) Izotov, Y.I., Thuan, T.X., & Lipovetsky, V.A. 1997, ApJS, 108, 11
- Izotov et al. (2009) Izotov, Y.I., Thuan, T.X., & Wilson, J.C. 2009, ApJ, 703, 1984
- James et al. (2004) James, P. A., et al. 2004, A&A, 414, 23
- Jansen et al. (2001) Jansen, F., et al. 2001, A&A, 365, L1
- Leitherer et al. (1999) Leitherer, et al. 1999, ApJS, 123, 3
- Linden et al. (2010) Linden, T., Kalogera, V., Sepinsky, J. F., Prestwich, A., Zezas, A., & Gallagher, J. S. 2010, ApJ, 725, 1984
- Liu & Bregman (2005) Liu, J.-F., & Bregman, J. N. 2005, ApJS, 157, 59
- Liu & Mirabel (2005) Liu, Q. Z., & Mirabel, I. F. 2005, A&A, 429, 1125
- Loose & Thuan (1985) Loose, H.-H. & Thuan, T.X. 1985, in Star-forming dwarf galaxies and related objects, ed. D. Kunth, T.X. Thuan & J.T.T. Van ( Gif-sur-Yvette: Editions Frontières), 73
- López-Corredoira & Gutiérrez (2006) López-Corredoira, M., & Gutiérrez, C. M. 2006, A&A, 454, 77
- Lyons (1991) Lyons, L. 1991, A Practical Guide to Data Analysis for Physical Science Students; Cambridge, UK: Cambridge University Press, pp. 107
- Makishima et al. (2000) Makishima, K., et al. 2000, ApJ, 535, 632
- Mapelli et al. (2009) Mapelli, M., Colpi, M., & Zampieri, L. 2009, MNRAS, 395, L71
- Mewe et al. (1985) Mewe, R., Gronenschild, E. H. B. M., & van den Oord, G. H. J. 1985, A&AS, 62, 197
- Noeske et al. (2000) Noeske, K. G., Guseva, N.G., Fricke, K.J., Izotov, Y.I., Papaderos, P., & Thuan, T.X. 2000, A&A, 361, 33
- Papaderos (1998) Papaderos, P. 1998, Ph. D. thesis, University of Göttingen
- Prestwich et al. (2013) Prestwich, A. H., et al. 2013, ApJ, in press; (arXiv1302.6203)
- Roy et al. (1996) Roy, J.-R., Belley, J., Dutil, Y., & Martin, P. 1996, ApJ, 460, 284
- Sánchez-Sutil et al. (2006) Sánchez-Sutil, J. R., et al. 2006, A&A, 452, 739
- Stobbart et al. (2006) Stobbart, A.-M., Roberts, T. P., & Wilms, J. 2006, MNRAS, 368, 397
- Strüder et al. (2001) Strüder, L., et al. 2001, A&A, 365, L18
- Thuan (2008) Thuan, T.X., 2008, in Low-metallicity star formation: from the first stars to dwarf galaxies, ed. L. Hunt, S.C. Madden, & R. Schneider (Cambridge: Cambridge Univ. Press), 348
- Thuan & Izotov (1997) Thuan, T.X., & Izotov, Y.I. 1997, ApJ, 489, 623
- Thuan & Izotov (2005) Thuan, T.X., & Izotov, Y.I. 2005, ApJ, 627, 739
- Thuan et al. (1987) Thuan, T.X., Williams, T.B. & Malumuth E. 1987, in Starbursts and Galaxy Evolution, ed. T.X. Thuan, T. Montmerle & J.T.T. Van (Gif-sur-Yvette: Editions Frontières), 151
- Thuan et al. (2002) Thuan, T.X., Lecavelier des Etangs, A., & Izotov, Y.I., 2002, ApJ, 128, 565, 941
- Thuan et al. (2004a) Thuan, T.X., Hibbard, J.E, & Lévrier, F. 2004a, AJ, 128, 617
- Thuan et al. (2004b) Thuan, T.X., Bauer, F.E., Papaderos, P., & Izotov, Y.I. 2004b, ApJ, 606, 213
- Tolstoy et al. (1995) Tolstoy, E., Saha, A., Hoessel, J.G., & McQuade, K. 1995, AJ, 110, 1640
- Turner et al. (2001) Turner, M.J.L. et al. 2001, A&A, 365, L27
- van Paradijs & McClintock (1995) van Paradijs, J., & McClintock, J.E. 1995, in X-ray Binaries, ed. W.H. Lewin, J. van Paradijs & E.P.J. van den Heuvel (Cambridge: Cambridge Univ. Press), 58
- Watson et al. (2009) Watson, M. G., Schröder, A. C., Fyfe, D., et al. 2009, A&A, 493, 339
- Yang (2012) Yang, Y.-J. 2012, Half a Century of X-ray Astronomy, Proceedings of the conference held 17-21 September, 2012 in Mykonos Island, Greece. Online at ”http://xraygroup.astro.noa.gr/xcosmo2012/”
- Yoshii & Arimoto (1987) Yoshii, Y., & Arimoto, N. 1987, A&A, 188, 13
- Zampieri & Roberts (2009) Zampieri, L., & Roberts, T.P. 2009, MNRAS, 400, 677