Zinc abundances of planetary nebulae
Abstract
Zinc is a useful surrogate element for measuring Fe/H as, unlike iron, it is not depleted in the gas phase media. Zn/H and O/Zn ratios have been derived using the [Zn IV] emission line at 3.625m for a sample of nine Galactic planetary nebulae, seven of which are based upon new observations using the VLT. Based on photoionization models, O/O++ is the most reliable ionisation correction factor for zinc that can readily be determined from optical emission lines, with an estimated accuracy of 10% or better for all targets in our sample. The majority of the sample is found to be sub-solar in [Zn/H]. [O/Zn] in half of the sample is found to be consistent with Solar within uncertainties, whereas the remaining half are enhanced in [O/Zn]. [Zn/H] and [O/Zn] as functions of Galactocentric distance have been investigated and there is little evidence to support a trend in either case.
keywords:
planetary nebulae: general; Galaxy: bulge, stars: abundances; ISM: abundances; astrochemistry1 Introduction
Iron has been shown to be heavily depleted from the gaseous form in ionised media through both optical (Delgado Inglada et al., 2009; Shields, 1975) and infrared observations (Likkel et al., 2006). In planetary nebulae it can be depleted by more than 90% (Delgado Inglada et al., 2009). As shown in Sterling et al. (2005), depletion may be not be uniform throughout a planetary nebula. Iron depletion is also seen in many environments in the interstellar medium (ISM) (McDonald et al., 2010; Savage & Sembach, 1996). Therefore deriving iron abundances of planetary nebulae through direct observations of iron will not result in an accurate elemental abundance for the precursor star.
Zinc, of which there are five different natural isotopes, exists most abundantly as 64Zn and is predominantly created in two processes: the alpha rich freeze-out of supernovae and the s-process (Clayton, 2003; Woosley & Weaver, 1995). The condensation temperature of zinc is 684 K which is significantly lower than that of the other iron-peak elements which range from 1170 K for Cu to 1600 K for Ti, with iron itself having a condensation temperature of 1337 K (Lodders & Fegley, 1998). This low condensation temperature means it is significantly less likely for zinc to condense into solids in the progenitor star’s envelope than it is for iron.
Zinc abundances and depletion in the interstellar medium have been widely studied over the past several decades (e.g. Morton, 1975). In warm, low-density regions of the interstellar medium, zinc has been shown to be depleted by 0.0-0.2 dex (Savage & Sembach, 1996; Welty et al., 1999).
The abundance of zinc over a wide range of metallicities within the Milky Way was studied by Sneden et al. (1991) by examining a large sample of field and globular cluster stars. The Zn/M abundance was shown to be constant over a wide range of M/H, where M/H is defined as the average metallicity of the star derived from observations of Fe and Ni. There have been some recent studies which find some discrepancies between Zn and Fe abundances in Galactic stars: Prochaska et al. (2000), for example, find a mean enhancement of [Zn/Fe] to be 0.093 0.025 from a sample of ten thick disk stars and Chen et al. (2004) find [Zn/Fe] to be unenhanced in a sample of five alpha-poor halo stars but enhanced by 0.15 dex in a sample of ten thick disk stars. However, these are based upon much smaller samples than that studied by Sneden et al. (1991). Saito et al. (2009), report measurements of [Zn/Fe] of a sample of 35 stars to be Solar to within uncertainties over the range . Saito et al. (2009) also combine their measurements with that of 399 literature stars with the resulting sample covering the range . [Zn/Fe] was found to be consistent with solar in the ranges to within the measured standard deviation.
In planetary nebulae, the 3.625 m [Zn IV] line is well suited to abundance derivation as it lies between two hydrogen Humphreys series emission lines (3.646 m and 3.607 m) and less than 0.125 m away from the much stronger Pfund series emission line at 3.741 m. Zn3+, in contrast to most of the abundant Fe ions in nebulae, has a sparse energy level structure in its ground configuration, making the 3.625 m line relatively strong. The 3.625 m line is the only emission line of zinc observed in the infrared in planetary nebulae.
The 3.625 m [Zn IV] line was first identified by Dinerstein & Geballe (2001) in spectra taken using CGS4 on the UK Infrared Telescope (UKIRT) of NGC 7027 and IC 5117. They find the central wavelength, after corrections for the Earth’s orbital motion, to be within uncertainties of that predicted for the Zn3+ transition. They consider alternative identities of the line from nearby transitions of H2 or Cu4+. In the case of H2, this is ruled out on the basis of the observed wavelength of the line. The Cu4+ transition was deemed less likely than the transition of Zn3+ due to the lower elemental abundance, stronger depletion and higher ionisation state of the former species.
Dinerstein & Geballe (2001) presented the procedure for deriving from their measurements. However, since the collision strength of the Zn transition was not known at the time, their abundance estimates were necessarily expressed in terms of the value of this parameter (their equation 4). After correcting for the presence of other ions of zinc, elemental Zn/H can be determined. Dinerstein & Gaballe suggested that such Zn/H values are excellent tracers of the total Fe/H abundances and that [Zn/H] can be used as a surrogate for [Fe/H], in view of the minimal depletion of Zn and the fact that Zn closely tracks Fe over a wide range in metallicity.
Small contributions of the elemental abundance of zinc are expected from nucleosynthesis in AGB stars. The models of Karakas et al. (2009) show this enhancement of Zn over the course of a star’s time on the AGB is small: only the very low metallicity models show [Zn/Fe] , and the majority of the remaining models show [Zn/Fe] . Thus the measured abundance of Zn in planetary nebulae will, in general, reflect the abundance of Zn of the progenitor star.
The ability to determine meaningful Fe/H values in nebulae is important because Fe/H is the most widely used index of metallicity in stars; therefore by determining undepleted Fe/H ratios, reliable metallicities of the precursor stars of the planetary nebulae can be determined. By examining the O/Zn ratio as a proxy for O/Fe, -element enhancement in these objects can be assessed.
The remainder of this paper will detail measurements of zinc abundances of a sample of planetary nebulae using the 3.625 m emission line, and the extrapolated iron abundances.
| PNG | Name | RA | Dec | Ang. dia. | T | T(O III) | N(S II) | O/H | O++/O | Ref. |
| (arcsec) | ( K) | ( K) | ( cm-3) | () | ||||||
| M 2-29 | 18 06 40.86 | 26 54 55.95 | 3.6 | 7.6 | 1 ,2 | |||||
| M 1-20 | 17 28 57.61 | 19 15 53.94 | 1.9 | 7.9 | 3 ,2 | |||||
| M 1-31 | 17 52 41.44 | 22 21 57.00 | 7.0 | 5.8 | 4 ,2 | |||||
| M 3-15 | 17 45 31.71 | 20 58 01.57 | 4.2 | 7.9 | 4 ,2 | |||||
| M 3-25 | 18 15 16.97 | 10 10 09.47 | 3.9 | 5.2 | 5 ,6 | |||||
| K 3-30 | 19 16 27.70 | +05 13 19.40 | 3.3 | - | 1.0 | 10.0 | 3.9 | 0.80 | - | |
| M 3-14 | 17 44 20.62 | 34 06 40.60 | 2.8 | 7.9 | 7 ,2 | |||||
| NGC 7027 | 21 07 01.59 | +42 14 10.18 | 14.0 | 18.0 | 8 ,9 | |||||
| IC 5117 | 21 32 30.97 | +44 35 47.5 | 1.5 | 12.0 | 10 ,10 |
1: Exter et al. (2004); 2: Gesicki & Zijlstra (2007); 3: Wang & Liu (2007); 4: Górny et al. (2009); 5: Górny et al. (2004); 6: Kondratyeva (2003); 7: Cuisinier et al. (2000) ; 8: Zhang et al. (2005); 9: Pottasch & Bernard-Salas (2010); 10: Hyung et al. (2001).
a: adopted value
2 Observations and data reduction
Nine planetary nebulae, five of which are Galactic bulge nebulae, were observed using ISAAC (Infra-red Spectrometer And Array Camera, Moorwood et al. (1998)) on UT3 at ESO Paranal, Chile between 28/05/2012 and 30/05/2012. These nebulae were selected from the Catalogue of Galactic Planetary Nebulae (Acker et al., 1992) and were chosen based upon their galactic position, size of the nebula ( 5” in diameter), brightness, excitation and the intensity of the O III emission lines.
Our program was designed to target planetary nebulae belonging to the Galactic bulge. However, four nebulae not belonging to the bulge, namely PNG 019.7+03.2, PNG 040.4–03.1, PNG 023.0+04.3 and PNG 049.3+88.1 were observed as back-up targets when high winds caused pointing restrictions during part of the run. The last two objects yielded no detections or useful limits, and are not discussed further. Of the nine nebulae observed, seven were detected in the 3.625 m line including five bulge sources.
The observations used the Long Wavelength Spectrometer using the jiggle-nod method, with on-source exposure times of 30-60 minutes. The slit length was 120 arcsec, the slit width used was 1 arcsec. The wavelength coverage was 3.55-3.80 m and the resulting resolution was . Nodding was done along the slit, with nods of 15 to 30 arcsec depending upon the source being observed. This results in the source being in the field of view at all times during the observation, reducing the required observing time whilst still allowing background subtraction to be carried out effectively. The slit was aligned through the brightest portion of the nebulae and in most cases included more than 50% of the object, due to their small angular size. The position angle of the slit was 0∘ for all observations.
The detector spectral coverage in this wavelength domain and at this resolution is 0.255 m, allowing the [Zn IV] emission line to be observed concurrently with five lines from the Humphreys series of hydrogen (n=21-6 to n=17-6) and one Pfund series hydrogen emission line (n=8-5, henceforth H8-5).
The data were reduced using the jiggle-nod recipes provided by the ESO common pipeline library, including flat fielding. The wavelength calibrations were done using arc lamp lines rather than sky lines, as recommended in the ISAAC user manual, due to there being no usable sky emission lines within this wavelength range.
The data were relative flux calibrated using the telluric standard stars observed with each planetary nebula observation. These telluric standard stars are almost exclusively B-type stars taken from the Hipparcos Catalogue111ESA, 1997, The Hipparcos and Tycho Catalogues, ESA SP-1200, and are listed in Table 2. Their stellar types are well documented and, from these types, an effective temperature of each star could be estimated. In this spectral region, these stars are well described by blackbody distributions calculated from their effective temperatures. The correction function to apply across the spectrum was calculated by dividing the blackbody function of each of the standard stars by the observed telluric stellar spectrum, after the removal of stellar spectral features, and normalising. The difference between the calibration using the B-type stars and the K-type stars is that extra features exist in the spectra of the B-type stars that must be removed before the correction function is calculated. The observed planetary nebulae data were then multiplied by the normalised functions to produce relative flux calibrated data. One nebula was observed twice and its two resulting relative flux calibrated spectra were averaged. There was no significant difference in the intensities of the two spectra. We estimate the relative flux calibrations to be accurate to 5-10%.
Absolute flux calibrations are not required for the analysis done here because both the hydrogen and zinc lines are contained within the same spectrum and only the ratio of the two is required to derive the zinc-to-hydrogen abundance.
The spectra of sources with detections of the [Zn IV] line and several H I lines are shown in Fig. 1. Two spectral ranges are shown for each source so that the intensity of both the H8-5 and [Zn IV] lines can be clearly seen.
In order to measure the integrated line intensities for abundance calculations, the spectra were first smoothed, then a straight-line background level was fitted and the integrated intensities of lines measured, after correcting for obvious noise spikes. The abundance calculations were then carried out as described in Section 3.


2.1 Literature data
The [Zn IV] 3.625 m emission line was first identified by Dinerstein & Geballe (2001) through observations of NGC 7027 and IC 5117. We include these observations, using the newly calculated values of the energy averaged collision strength, in order to compare the results from the new sample of nebulae to that of results obtained from well-studied nebulae, calculated using the same method as for the new sample.
The observations of Dinerstein & Geballe (2001) contained the 3.625 m emission line as well as two lines of hydrogen from the Humphreys series (n=20-6, 3.607 m and n=19-6, 3.646 m, hereafter H20-6 and H19-6), but did not include the stronger H8-5 line which we use for the new sample due to its higher intensity.
The ISO archive was also searched for further observations covering the 3.625 m wavelength range. NGC 7027 is the only planetary nebula observed at sufficient resolution to identify the [Zn IV] emission line: TDT=02401183 taken from Sloan et al. (2003), shown in Fig. 3. Both the [Zn IV] and H8-5 lines are visible, although at much lower resolution than the spectra in Dinerstein & Geballe (2001). There were no new detections of [Zn IV] in other planetary nebulae found within the ISO archive.
3 Abundance derivation
In order to calculate zinc abundances from observed line intensity ratios, a number of calculations must be carried out. First, the emissivities of the lines must be calculated, then the ionic abundances may be derived. The unobserved ions must be accounted for using a suitable ionisation correction factor before the elemental abundances can be calculated.
3.1 Determination of physical parameters
Basic information about each new source detected in zinc is shown in Table 1 as well as the two nebulae previously observed by Dinerstein & Geballe (2001). was quoted from the second reference in column 11 and the angular diameters are taken from Acker et al. (1992). (O III), (S II), O/H and O++/O were calculated from the optical spectra published in the first reference in column 11 using the Nebular Empirical Analysis Tool (NEAT, Wesson et al. (2012)). NEAT uses the Kingsburgh & Barlow (1994) ICF scheme. Further technical details of the code, including error propagation and sources of atomic data, may be found in Wesson et al. (2012). The number of lines used as input varied from source to source, depending upon the available literature spectra. NGC 7027 had the largest input line list (227 lines in the wavelength range 3327.1–8727.2 ) and PNG had the smallest input line list (14 lines in the wavelength range 4340.4–7330.2 ). All lines published in the listed reference that are recognised by NEAT were used, and a full list of lines is available in each source’s corresponding reference (column 11).
There was not a sufficiently complete set of emission line fluxes for PNG 019.7+03.2 in the literature to successfully apply the NEAT package, nor to derive (O III) directly, so the value listed in Column 7 of Table 1 is (N II). Using a published sample of 51 planetary nebulae from Górny et al. (2009) with derived (N II) and O III), it is possible to extrapolate a O III) from the available (N II) value using a straight-line fit to their data. This would predict O III)=1.05 K for a (N II)=1.09 K. As these values are so similar, the effect on the emissivities is negligible, therefore (N II) is used for the remainder of the paper.
PNG 040.4 did not have sufficient optical data available in the literature to derive the required parameters. Therefore typical nebular parameters of 104 K and 104 cm-3 were adopted for (O III) and (S II) respectively, and typical values of O/H and O++/O for our disk nebula sample were assigned.
3.2 Line emissivities
Hydrogen emissivities are available as an extensive data list and an interpolation program from Storey & Hummer (1995). The H8-5 at 3.741 m is the strongest hydrogen line in our observed wavelength range, and is therefore the most appropriate line to use in the calculations. Using ) and (S II) listed in Table 1, the interpolation code was used to give more accurate H8-5 emissivities. For NGC 7027 and IC 5117, the H20-6 and H19-6 lines were used and their emissivities determined in the same manner as for H8-5.

[Zn IV] line emissivities are not available in the literature and must be calculated. Using the methodology described in Dinerstein & Geballe (2001) in the low-density limit and new collision strengths, , integrated over the electron energy distribution at temperature (Keith Butler, priv. comm.), the emissivity of the [Zn IV] line, , can be calculated using:
| (1) |
where is the statistical weight of level i and is the energy of the transition . is defined as (cgs units).
The energy-averaged collision strengths were calculated over a grid of electron temperatures ranging between 5000 K and 25000 K (Keith Butler, priv. comm.). The energy-averaged collision strengths were interpolated to the electron temperatures of each source using a power law.
The use of the low density limit can be shown to be justified by deriving the critical density, , for which the rate of collisional de-excitations equals the rate of spontaneous decays:
| (2) |
where A=0.43 s-1, gu=4 and =1.4. As shown in Table 1, the nebular densities are much lower than that of , thus the use of the low-density limit is well-justified.
3.3 Ionic abundances
| PNG | Telluric Standard | Spectral Type | T (K) |
|---|---|---|---|
| 004.003.0 | Hip088012 | B3II/III | 17000 |
| 006.1+08.3 | Hip076243 | B6IV | 14000 |
| 006.1+08.3 | Hip085442 | B9.5IV | 9790 |
| 006.4+02.0 | Hip085442 | B9.5IV | 9790 |
| 006.8+04.1 | HIP085355 | K3Iab | 4420K |
| 019.7+03.2 | HIP085355 | K3Iab | 4420K |
| 040.403.1 | Hip095732 | B6III | 17100 |
| 355.4-02.4 | Hip089439 | B0/1Ia/ab | 26000 |
After measuring the integrated line intensity ratios of [Zn IV] and H8-5, calculating the ionic abundance ratios is carried out using:
where is the flux of transition , given in Table 3. Extinction effects are negligible in this wavelength range, so need not be considered.
3.4 Ionisation correction factors
To convert the ionic abundances into elemental abundances, it is necessary to correct for those ions of that species that are not seen. For hydrogen, it is assumed that all H is present as H+, however this is not the case for Zn.
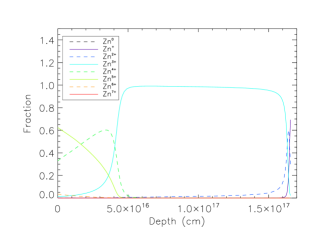
In order to examine the ionization correction factor required for zinc, as well as the dominance of the Zn3+ ion, we have run a grid of Cloudy (v 13.01) photo-ionization models (Ferland et al., 2013). The grid of models were given solar abundances and spherical geometry. Luminosity, initial radius and hydrogen density were set as log([erg/s])=38, log([cm])=17 and log([cm-3]) = 4. The central star’s radiation field was assumed to be a blackbody with temperatures ranging from K to K.
At central star temperatures between K and K, Zn3+/Zn at most depths, where depth is defined as the distance from the illuminated face of the nebular cloud. When the depth into the cloud is small, the fractions of zinc in other ions becomes significant, as shown in Fig. 4. The dominance of Zn3+ also does not hold when examined at temperatures smaller than K and greater than K.
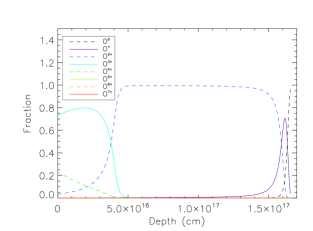
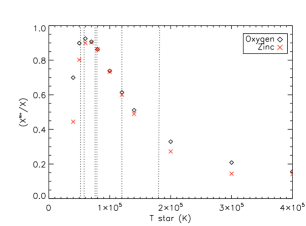
These models also show that over the range of central star temperatures K to K, the fraction of zinc in the Zn3+ ion is closely mapped by the fraction of oxygen present as O++, which is the dominant oxygen ion over the same temperature range, as shown in Fig. 5 and 6. O++/O has been determined for the majority of our sample from optical observations and all bar one of the sample of planetary nebulae central stars lie within this temperature range. Therefore, the ionisation correction factor for Zn3+ can be taken as ( and the values are listed in Table 1 for each nebula.
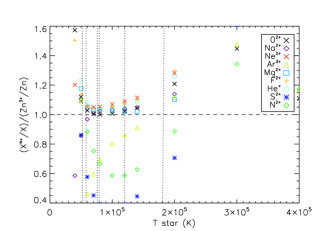
Dinerstein & Geballe (2001) use Ar/Ar3+ as the ionisation correction factor rather than O/O++. Our Cloudy models show that O++/O follows Zn3+/Zn more closely than Ar3+/Ar does, hence our choice of species. Additionally, over the temperature range K to K, the models show that Zn3+/Zn is most closely mapped by O++/O in comparison to all other species included in the model nebula. This is shown in Fig. 7.
3.5 Elemental abundances
From the calculated ionic abundances and using O++/O to correct for the unobserved ions of zinc, the Zn elemental abundance is simply:
| (3) |
Outside of the temperature range K to K, applying this correction will lead to inaccurate results where the abundance of Zn will be significantly underestimated. Zn/H may be converted to Zn/O using the O/H values shown in Table 1. As discussed earlier, the value of Zn/Fe has essentially the solar value for stars with (Saito et al., 2009; Umeda & Nomoto, 2002; Sneden et al., 1991), which includes all of our targets. Thus, it is possible to convert from [Zn/H] and [Zn/O] to [Fe/H] and [Fe/O] using the solar ratio of Zn/Fe.
4 Results
The results are shown in Table 3 in both logarithmic and linear forms. The solar elemental abundances are taken from Asplund et al. (2009). The results from the ISO observations are not displayed in Table 3 as they are within errors of those determined from the observations in Dinerstein & Geballe (2001), but due to their lower resolution had significantly larger uncertainties.
| PNG | ([Zn IV]) | F/F | Zn/H | Zn/O | [Zn/H] | [O/Zn] | |
| () | () | () | () | () | |||
| NGC 7027 | |||||||
| IC 5117 |
a: values are an estimate using average values for oxygen ratios in calculations where literature values were unavailable
b: flux are given for the H19-6 transitions and abundances are the mean of those derived from the H19-6 and H20-6 transitions, taken from Dinerstein & Geballe (2001).
4.1 Uncertainty considerations
All uncertainties associated with the physical conditions and chemical composition of the sample nebulae are shown in Table 1. The uncertainties on the measured flux ratio are given in Table 3. These errors have all been combined according to standard error propagation to give the uncertainties on the final abundances.
For PNG 040.4–03.1, we have adopted values of and dex for [Zn/H] and [O/Zn] ratios respectively.
There are also further uncertainties associated with the use of ionisation correction factors. The ionisation correction factor O/O++ agrees to within 2% with the value of Zn/Zn+3 predicted by the photoionization models, except for NGC 7027 and PNG 019.7+3.2, for which the uncertainty introduced by the ionisation correction is about 10%, due to the very high and low central star temperatures respectively. The calculated collision strength for [Zn IV] is estimated to be accurate to 20 (Keith Butler, priv. comm.), and the line emissivity should have a similar uncertainty. The uncertainties in the emissivities of the optical oxygen lines are likely to be greater due to their strong temperature dependences.
The sensitivity of the results on the derived physical input parameters can be examined by comparing the results derived using the parameters calculated by the Neat code with those calculated from literature parameters. In general, the results of [Zn/H] agree to less than 0.08 dex, which is within the calculated uncertainties of the results. The only nebula with a difference in [Zn/H] greater than 0.08 dex is NGC 7027, with a difference of 0.14 dex. The results of [O/Zn] agree to within 0.09 dex for all nebulae except PNG 006.4+02.0 which has a discrepancy of 0.3 dex. This difference is primarily caused by an increase in the value of as derived through Neat in comparison to that value derived in the literature. In general, the results are consistent to within calculated uncertainties.
The H8-5 line is asymmetrical in profile and potentially caused by a blend with a significantly weaker He I emission line. In order to assess the effect this has on the calculated abundances, we have calculated abundance ratios for the four highest signal-to-noise spectra (namely PNG , PNG , PNG and PNG ) from both the peak intensities of the H8-5 and [Zn IV] line and also using the integrated intensities of the H18-6 lines. The results are not significantly different from those derived using the integrated intensities of the H8-5 line. In general, [Zn/H] is reduced by 0.1 dex, but the abundance ratios of some nebulae are entirely unaffected (e.g. PNG ). The abundances derived for NGC 7027 and IC 5117 are unaffected due to the H19-6 and H20-6 lines being used in their calculations.
5 Discussion
All calculated ionic and elemental abundance ratios are shown in Table 3. Our results show a general trend of sub-solar Zn/H, with the lowest being 10% that of solar.
We have derived [Zn/H] and [O/Zn] in order to calculate the metallicities of the precursor stars of the planetary nebulae in our sample and to determine whether elements such as oxygen are enriched relative to Solar. A range of O/Zn is shown, with four of the sample nebulae showing enhancement of O/Zn in comparison to solar values.
PNG 004.0–03.0 shows sub-solar [O/Zn], however the uncertainties associated with this nebula are large, putting the solar value well within one sigma. [Zn/H] for this nebula is the most sub-solar at -1.0, five sigma away from Solar. Additionally, as discussed in Gesicki et al. (2010), this nebula contains a high density inner region which is likely an opaque disk. This may be the cause of the unusually low calculated values.
PNG 355.4–02.4 showed a very intense [Zn IV] emission line and has the highest F([Zn IV])/F(H8-5) of all the sample, leading to the highest [Zn/H] in the sample, suggesting that this nebula may simply be more metal-rich than the Sun . In addition to the high F([Zn IV])/F(H8-5) ratio, no Humphreys emission lines were detected in PNG 355.4–02.4. It is possible that this nebula could be hydrogen-poor rather than zinc-rich, although the low signal-to-noise ratio in this spectrum may be the cause of the non-detections of the Humphreys emission lines . The 3.625 m line has several noise spikes in close proximity, and it is possible a noise spike could be overlaid on the emission line, significantly increasing the measured zinc abundance which would also account for the high value of [Zn/H].
PNG 006.1+08.3, PNG 006.4+02.0 and PNG 006.8+04.1 show enhancement, with oxygen being enhanced over zinc by factors of 5, 2.5 and 3 respectively. PNG 006.4+02.0 and PNG 006.8+04.1 both have significantly sub-solar [Zn/H]. PNG 006.1+08.3, on the other hand, shows a [Zn/H] ratio that is more in line with Solar. These results imply that these three nebulae are, to varying degrees, enhanced in -elements over zinc.
PNG 019.7+03.2, a disk nebula, is consistent with Solar for both Zn/H and O/Zn.
Due to the lack of optical spectroscopy for the probable disk planetary nebula PNG 040.4-0.3, it was necessary to assume values for its electron temperature, electron density, and ionic and elemental oxygen abundances. Its Zn/H and O/Zn values are consistent with Solar, within estimated errors, however the results should be recalculated if optical spectra for this nebula become available.
The well-studied disk nebula NGC 7027 displays Zn/H at approximately 1/3 that of the Solar value, whilst being enhanced in O/Zn by a factor of 2. This deviation from Solar may be explained in part by its large size of 14 arcseconds. The zinc observations and optical observations were taken with different slit widths at different orientations, and therefore will not trace the same regions of gas. In such a large nebula, this effect could be significant and could cause the underestimation of the zinc abundance by the slit losses being different for different elements. For the majority of the other nebulae, the slit and nebulae have similar sizes meaning that this is less likely to cause discrepancies.
IC 5117 has a lower Zn/H ratio than solar by a factor of two, whilst being consistent with solar for O/Zn.
Two of the sample nebulae, PNG and PNG , show significant enhancements in [O/Zn] such that when errors are taken into account, they still lie at values greater than 0.2 over solar. Both nebulae have central star temperatures of K, putting them within the temperature range where maps in model nebulae to within .
5.1 Metallicity as a function of galactocentric distance
The planetary nebulae in this sample are at a variety of Heliocentric distances and Galactic latitude and longitudes. Transforming these parameters into a Galactocentric distance can be simply executed via geometry. The distance between the Sun and the Galactic centre has been taken to be 8.5kpc.
The l and b coordinates for all sources have been taken from Cutri et al. (2003) and the Heliocentric distances from Stanghellini & Haywood (2010), and are shown, along with their calculated Galactocentric distances (RG), in Table 4.
| PNG | R (kpc) | l (deg) | b (deg) | RG (kpc) |
|---|---|---|---|---|
| 8.4 | 4.087 | -3.005 | 0.79 | |
| 8.0 | 6.188 | +8.362 | 1.6 | |
| 5.2 | 6.455 | +2.015 | 3.4 | |
| 6.8 | 6.805 | +4.160 | 2.0 | |
| 5.8 | 19.752 | +3.273 | 3.6 | |
| 9.5 | 40.441 | -3.157 | 6.0 | |
| 5.8 | 355.444 | -2.467 | 2.8 | |
| NGC 7027 | 1.1 | 84.930 | -3.496 | 8.5 |
| IC 5117 | 8.2 | 89.873 | -5.134 | 12 |
Fig. 8 and 9 show [Zn/H] and [O/Zn] as a function of the Galactocentric distances of the observed sources.
Abundance gradients throughout the Milky Way have been previously studied. For example, Rich (1998) shows a decline in [Fe/H] from to over 1000pc in the Galactic bulge. Results derived specifically from planetary nebulae generally focus on the gradients of O and Ne through the galaxy. Pottasch & Bernard-Salas (2006), for example, find that the abundance of oxygen decreases over the range 3-11 kpc at a rate of dex/kpc. Gutenkunst et al. (2008) derive abundance gradients for a sample of Galactic Bulge and Galactic Disk nebulae for Ne, S, Ar and O. They report negative gradients for the abundance trends of Galactic disk nebulae of between and dex/kpc. For Galactic bulge planetary nebulae, the results are less clear, with fits to the abundances having very large uncertainties. It is clear that the bulge and disk do not share an abundance trend with Galactocentric distance.
As shown in Fig. 8, from our sample, [Zn/H] appears to increase with increasing RG until kpc, in contrast to Rich (1998) but more in agreement with the results of Gutenkunst et al. (2008) . After this point, there appears to be a shallow decline outwards, in agreement with the results from Pottasch & Bernard-Salas (2006) and Gutenkunst et al. (2008) . However, due to the small sample size, this must be taken with caution.
Fig. 9 shows that around half of our sample lie within one sigma of Solar [O/Zn], with the rest showing enhancement in oxygen. No trend of [O/Zn] with Galactocentric distance is discernible.


6 Conclusions
We have derived [Zn/H] and [O/Zn] for a sample of nine planetary nebulae: seven newly observed nebulae (five from the Galactic bulge and two from the Galactic disk) and two which were previously observed by Dinerstein & Geballe (2001).
Four out of five of those nebulae present in the Galactic bulge show sub-solar [Zn/H] and elevated [O/Zn]. The remaining bulge nebula shows an unusually high [Zn/H] and low [O/Zn].
One of the two newly observed Galactic disk nebulae, PNG 019.7+03.2, shows solar abundances for both [Zn/H] and [O/Zn], whereas the other, PNG 040.4–03.1, shows sub-solar [Zn/H] and elevated [O/Zn]. The latter, however, should be taken with caution as values for ionic abundances and nebular temperatures and densities could not be computed as sufficient optical spectra were not available in the literature.
The two nebulae, NGC 7027 and IC 5117, as observed by Dinerstein & Geballe (2001) show [Zn/H] lower than Solar by more than a factor of 2. NGC 7027 also exhibits an enhanced [O/Zn] ratio in comparison to Solar, whereas IC 5117 displays [O/Zn] which is in line with Solar. The distinct difference from Solar values in NGC 7027 may be attributable to the large size of the nebula (14 arcseconds) resulting in a significant difference between the slit losses of the optical observations, from which the nebular temperature, densities and oxygen abundances were derived, and of the infra-red observations, from which the zinc abundances were derived.
Overall, we have found the majority of this sample to exhibit sub-solar [Zn/H], with the lowest being 10% that of Solar. Half of the sample show [O/Zn] in line with the Solar value while the remaining half show enhancement in [O/Zn]. This will be further explored in a future paper that will present [Zn IV] observations of a larger sample of planetary nebulae from a wider range of Milky Way populations, and provide a broader context for our results on the Galactic bulge nebulae.
7 Acknowledgements
We thank Dr. Keith Butler for providing information on the [Zn IV] line emissivity prior to publication and the ESO staff at Paranal for support whilst observing. This research was supported in part by NSF grant AST 0708245 to H.L.D. We also acknowledge the support of the UK’s Science and Technology Facilities Council. Based on observations made with ESO telescopes at the Paranal Observatory under programme ID 089.D-0084(A).
References
- Acker et al. (1992) Acker A., Marcout J., Ochsenbein F., Stenholm B., Tylenda R., Schohn C., 1992, The Strasbourg-ESO Catalogue of Galactic Planetary Nebulae. Parts I, II.
- Asplund et al. (2009) Asplund M., Grevesse N., Sauval A. J., Scott P., 2009, ARA&A, 47, 481
- Chen et al. (2004) Chen Y. Q., Nissen P. E., Zhao G., 2004, A&A, 425, 697
- Clayton (2003) Clayton D., 2003, Handbook of Isotopes in the Cosmos: Hydrogen to Gallium. Cambridge Planetary Science, Cambridge University Press
- Cuisinier et al. (2000) Cuisinier F., Maciel W. J., Köppen J., Acker A., Stenholm B., 2000, A&A, 353, 543
- Cutri et al. (2003) Cutri R. M., Skrutskie M. F., van Dyk S., et. al 2003, 2MASS All Sky Catalog of point sources.
- Delgado Inglada et al. (2009) Delgado Inglada G., Rodríguez M., Mampaso A., Viironen K., 2009, ApJ, 694, 1335
- Dinerstein & Geballe (2001) Dinerstein H. L., Geballe T. R., 2001, ApJ, 562, 515
- Exter et al. (2004) Exter K. M., Barlow M. J., Walton N. A., 2004, MNRAS, 349, 1291
- Ferland et al. (2013) Ferland G. J., Porter R. L., van Hoof P. A. M., Williams R. J. R., Abel N. P., Lykins M. L., Shaw G., Henney W. J., Stancil P. C., 2013, Rev. Mexicana Astron. Astrofis., 49, 137
- Gesicki & Zijlstra (2007) Gesicki K., Zijlstra A. A., 2007, A&A, 467, L29
- Gesicki et al. (2010) Gesicki K., Zijlstra A. A., Szyszka C., Hajduk M., Lagadec E., Guzman Ramirez L., 2010, A&A, 514, A54
- Górny et al. (2009) Górny S. K., Chiappini C., Stasińska G., Cuisinier F., 2009, A&A, 500, 1089
- Górny et al. (2004) Górny S. K., Stasińska G., Escudero A. V., Costa R. D. D., 2004, A&A, 427, 231
- Gutenkunst et al. (2008) Gutenkunst S., Bernard-Salas J., Pottasch S. R., Sloan G. C., Houck J. R., 2008, ApJ, 680, 1206
- Hyung et al. (2001) Hyung S., Aller L. H., Feibelman W. A., Lee S.-J., 2001, ApJ, 563, 889
- Karakas et al. (2009) Karakas A. I., van Raai M. A., Lugaro M., Sterling N. C., Dinerstein H. L., 2009, The Astrophysical Journal, 690, 1130
- Kingsburgh & Barlow (1994) Kingsburgh R. L., Barlow M. J., 1994, MNRAS, 271, 257
- Kondratyeva (2003) Kondratyeva L. N., 2003, Astronomical and Astrophysical Transactions, 22, 181
- Likkel et al. (2006) Likkel L., Dinerstein H. L., Lester D. F., Kindt A., Bartig K., 2006, AJ, 131, 1515
- Lodders & Fegley (1998) Lodders K., Fegley B., 1998, The Planetary Scientist’s Companion. Oxford University Press, USA
- McDonald et al. (2010) McDonald I., Sloan G. C., Zijlstra A. A., Matsunaga N., Matsuura M., Kraemer K. E., Bernard-Salas J., Markwick A. J., 2010, ApJL, 717, L92
- Moorwood et al. (1998) Moorwood A., Cuby J.-G., Biereichel P. e. a., 1998, The Messenger, 94, 7
- Morton (1975) Morton D. C., 1975, ApJ, 197, 85
- Pottasch & Bernard-Salas (2006) Pottasch S. R., Bernard-Salas J., 2006, A&A, 457, 189
- Pottasch & Bernard-Salas (2010) Pottasch S. R., Bernard-Salas J., 2010, A&A, 517, A95
- Prochaska et al. (2000) Prochaska J. X., Naumov S. O., Carney B. W., McWilliam A., Wolfe A. M., 2000, AJ, 120, 2513
- Rich (1998) Rich R. M., 1998, in Friedli D., Edmunds M., Robert C., Drissen L., eds, Abundance Profiles: Diagnostic Tools for Galaxy History Vol. 147 of Astronomical Society of the Pacific Conference Series, Abundance Gradients in the Galactic Bulge and Halo. p. 36
- Saito et al. (2009) Saito Y.-J., Takada-Hidai M., Honda S., Takeda Y., 2009, PASJ, 61, 549
- Savage & Sembach (1996) Savage B. D., Sembach K. R., 1996, ARA&A, 34, 279
- Shields (1975) Shields G. A., 1975, ApJ, 195, 475
- Sloan et al. (2003) Sloan G. C., Kraemer K. E., Price S. D., Shipman R. F., 2003, ApJS, 147, 379
- Sneden et al. (1991) Sneden C., Gratton R. G., Crocker D. A., 1991, A&A, 246, 354
- Stanghellini & Haywood (2010) Stanghellini L., Haywood M., 2010, ApJ, 714, 1096
- Sterling et al. (2005) Sterling N. C., Dinerstein H. L., Bowers C. W., Redfield S., 2005, ApJ, 625, 368
- Storey & Hummer (1995) Storey P. J., Hummer D. G., 1995, MNRAS, 272, 41
- Umeda & Nomoto (2002) Umeda H., Nomoto K., 2002, ApJ, 565, 385
- Wang & Liu (2007) Wang W., Liu X.-W., 2007, MNRAS, 381, 669
- Welty et al. (1999) Welty D. E., Hobbs L. M., Lauroesch J. T., Morton D. C., Spitzer L., York D. G., 1999, ApJS, 124, 465
- Wesson et al. (2012) Wesson R., Stock D. J., Scicluna P., 2012, MNRAS, 422, 3516
- Woosley & Weaver (1995) Woosley S. E., Weaver T. A., 1995, ApJS, 101, 181
- Zhang et al. (2005) Zhang Y., Liu X.-W., Luo S.-G., Péquignot D., Barlow M. J., 2005, A&A, 442, 249