Revisiting the Saffman-Taylor experiment: imbibition patterns and liquid-entrainment transitions
Abstract
We revisit the Saffman-Taylor experiment focusing on the forced-imbibition regime where the displacing fluid wets the confining walls. We demonstrate a new class of invasion patterns that do not display the canonical fingering shapes. We evidence that these unanticipated patterns stem from the entrainement of thin liquid films from the moving meniscus. We then theoretically explain how the interplay between the fluid flow at the contact line and the interface deformations results in the destabilization of liquid interfaces moving past solid surfaces. In addition, this minimal model conveys a unified framework which consistently accounts for all the liquid-entrainment scenarios that have been hitherto reported.
pacs:
47.20.Ma, 47.54.-r,68.08.BcWhat liquid should be used to clean a hydrophilic container filled with an organic fluid? This seemingly trivial question turns out to be of major importance in a number of industrial process, including enhance recovery of the so-called heavy oils. An elementary thermodynamic reasoning would suggest using an aqueous liquid making the smallest possible contact angle with the container walls. In this letter we show that the answer is actually more subtle when the dynamics of the fluid interfaces is considered.
From a fundamental perspective, liquid-liquid interfaces driven past solid substrates have been extensively used as a proxy to investigate nonlinear-pattern formation such as Laplacian growth processes Couder (2002); Bensimon et al. (1986); Homsy (2002); Lenormand (2001). Until now the overwhelming majority of the experiments have been performed in the drainage regime, where a low-viscosity fluid displaces a high-viscosity fluid which preferentially wets the solid. From the Saffman-Taylor fingers growing in Hele-Shaw cells Saffman and Taylor (1958); Couder (2002); Bensimon et al. (1986) to the fractal patterns found in porous media Homsy (2002); Sahimi (1993); Lenormand (2001), the salient features of all the drainage patterns are very well captured by coarse-grained front-propagation models that discard the very details of the interactions between the liquid and the solid walls. Conversely, the experiments on imbibition dynamics, where the less viscous phase preferentially wets the solid walls, have been scarce and have yield somehow puzzling results Weitz et al. (1987); Stokes et al. (1986); Aarts et al. (2013). The first quantitative experiment in a prototypal Hele-Shaw geometry was performed only one year ago with colloidal liquids Aarts et al. (2013). Confocal imaging revealed an instability of the contact line. However, the resulting entrainement of a thin liquid sheet does not qualitatively modify the shape of viscous fingers. In contrast, imbibition experiments in porous media had revealed a marked qualitative change in the morphologies of the invasion patterns Weitz et al. (1987); Stokes et al. (1986); Lenormand (2001)
Here, we revise the seminal Saffman-Taylor experiment using water to mobilize viscous oils filling hydrophilic microfluidic channels. We demonstrate a novel type of liquid-entrainement instability and the subsequent growth of unanticipated imbibition patterns. We first quantitatively characterize their shape and propagation dynamics. We then theoretically explain how the intimate coupling between the short-scale molecular interactions with the solid and the large-scale flows results in the destabilization of the two-fluid interface. This model conveys a unified framework to consistently accounts for all the liquid entrainement scenarios that have been reported so far Snoeijer and Andreotti (2013); Aarts et al. (2013); Ledesma-Aguilar et al. (2013).
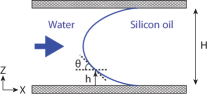
The experiment is thoroughly described in a supplementary document sup . Briefly, it consists in injecting a coloured aqueous solution in a microfluidic Hele-Shaw channel filled with silicon oil of viscosity ranging from 5 cp to 3500 cp. The invasion patterns are observed with a CCD camera with a spacial resolution of . To gain more knowledge about their 3D morphology, we also convert the transmitted-light intensity into the local water-pattern thickness with a resolution of Saintyves et al. (2013). The channels are made by bonding two glass slides with a double-sided tape. Prior to assembly, a thin film of thiolene-based resins is deposited on the two glass slides (NOA 81, Norland Optical Adhesives). Using NOA81 surfaces, the advancing contact angle of the aqueous solution immersed in silicon oil can be continuously varied from down to by means of a UV exposure Levaché et al. (2012). The width and the length of the main channel are , and respectively, Fig. 1. The channel height is constant over the entire device, and is left unchanged as the fluids flow, . In order to avoid any possible modification of the wetting properties, we make sure that the main channel does not contact any aqueous liquid prior to the imbibition experiment. To do so, the device is filled following a systematic sequence of injection steps described in sup . In addition, the chips are not recycled. More than 50 chips were used to produced the dataset introduced below.
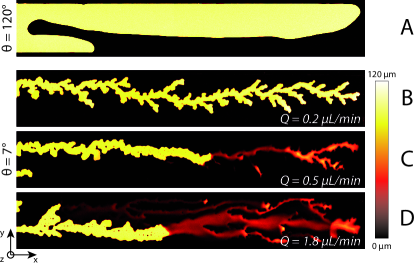
We first show in Fig. 1A the result of a standard drainage experiment, where silicon oil of viscosity is displaced in an hydrophobic channel (). The wedge-shape entrance of the main channel promotes tip splitting in this typical Saffman-Taylor pattern Lajeunesse and Couder (2000). The colors of Fig. 1A code for the local water thickness, the two fingers clearly fill the gap of the shallow channel. We also note that they grow along the side walls which they partly wet. The very same type of finger shapes were observed over a decade of flow rates : . In contrast, Fig. 1B and supplementary movie 1 correspond to an imbibition experiment () performed at small flow rate. The marked difference between these two fingering patterns clearly reveals the impact of on the water-front dynamics. The branching level is significantly increased while the width of the fingers is reduced compared to the drainage regime. More surprisingly, increasing the water flow rate above , the imbibition dynamics does not reduce to the mere propagation of a sharp water front any more, see Figs. 1C and 1D and supplementary movies 2 and 3. Thin water films are entrained from the finger tip throughout the oil phase, and merge to form complex interconnected patterns. Increasing the flow rate, the number of narrow thin films increases. Using a microscope and a 20x objective we found that the films propagate along the top and bottom walls. At this point we shall note that this latter observation is at odds with the entrainment dynamics reported in Aarts et al. (2013), where thin films were entrained in between the two confining walls.
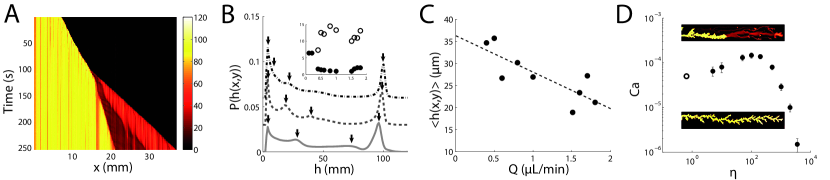
Fig. 2A conveys a clear picture of the interface dynamics at large scales. The imbibition-pattern thickness averaged over the -direction, , is plotted as a function of time and of the -position along the channel. At , the flow rate is smaller than , and a branched finger grows at a constant speed. As is increased above , a thin water film is entrained and forms a rim. This rim is separated by the initial finger by an even thiner flat film. The rim moves at a constant speed ahead the initial thick finger, which keeps on growing at a constant, yet smaller velocity. The main water finger slowly meanders in the channel following the interconnected track left by the entrained films thereby traping small oil pockets in the channel. The topology of the resulting holey imbibition pattern, Fig. 1D is not akin to the branched structure emerging from a Laplacian growth process as observed in all the drainage experiments.
To further characterize the pattern heterogeneities, we measured the instantaneous distribution of the film-thickness field. was found to be stationary, in agreement with the constant speed of the two fronts separating the three regions (finger, flat film and rim) in Fig. 2A. is typically composed of four peaks, that may overlap, Fig. 2B. The leftmost peak corresponds to the edges of the pattern where the water thickness is by definition vanishingly small. The second peak corresponds to the flat-film regions. The third and broadest peak is centered on the typical rim-thickness value. The rightmost narrow peak located at corresponds to the main finger. The strong increase with of the lefmost-peak amplitude reflects the increase of the perimeter-over-surface ratio at high water injection rate. This ratio is plotted in Fig. 2B inset both for the main finger and for the entrained film region. As exceeds , this quantity drops discontinuously for the main finger as liquid entrainement suppresses branching. Oppositely, in the entrained-film region the ratio jumps to higher values as the holes increase the pattern perimeter while reducing its area. Fig. 2C also demonstrates that the mean thickness of the films decreases linearly with .
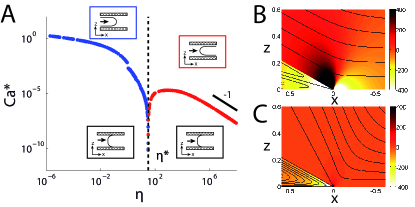
To gain more physical insight, we henceforth describe the imbibition process in term of the three dimensionless numbers that control the interface dynamics: the advancing contact angle , the viscosity ratio of the two fluids , and the capillary number , where is the interface velocity, and is the surface energy of the two-fluids interface which we estimate to be . Here we focus on the roles of and for a small contact angle value. Repeating the same experiment with oils of different viscosity, we measured the -averaged tip velocity of the fingers from which a water film is entrained. These measurements define the experimental phase diagram shown in Fig. 2D. Unexpectedly, the critical capillary number above which the meniscus is unstable, undergoes non-monotonic variations with and displays a maximum for . This observation rules out a naive scaling argument which would consist in comparing the magnitude of the Laplace pressure and of the viscous stress in the oil (reps. in the water) phase at the macroscopic scale . Such estimates would result in a scalings (resp. ), none of which is experimentally observed. To go beyond this oversimplified description, we now introduce a minimal model which accounts for the interplay between the fluid flows and the meniscus shape at all scales.
For sake of simplicity we ignore curvature effects in the -plane, and focus on steadily moving interfaces that are translationally invariant along the -direction. The meniscus shape is determined by the local balance between the Laplace pressure and the normal-stress discontinuity across the fluid interface. Introducing the curvilinear coordinate along the interface, , and the local interface curvature , the unit-vector normal to the surface , it takes the compact form:
| (1) |
where, the is the stress discontinuity at the interface. This equation couples to the Stokes equations for the two fluid flows. To solve this demanding problem, we built on Snoeijer (2006); Marchand et al. (2012), and make an additional ansatz which has proven to yield excellent agreement with lattice Boltzman simulations Chan et al. (2013). In the frame moving with the contact line, the velocity and the pressure fields in both phases are assumed to be locally given by the Hu and Scriven solutions for the flow in a wedge of angle , where is the local angle between the tangent vector and the -axis, Fig. 3A Huh and Scriven (1971). Within this approximation, the stress discontinuity in Eq. 1 is readily computed, and the shape of the interface is fully prescribed by completing Eq.1 with the boundary conditions: , , where is the curvilinear length of the meniscus. Eq. 1 is then recast into a 4-dimensional dynamical system, and this boundary value problem is effectively solved using an iterative collocation method as explained in sup .
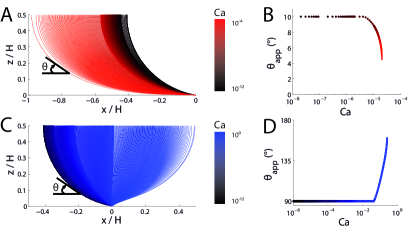
The evolution of the meniscus shape with the capillary number is shown in Fig. 3A for . Increasing increases the meniscus length and reduces of the apparent contact angle value. More quantitatively, we show in Fig. 3B that , measured here at the point of minimal curvature, decays to for a finite value of above which no stationary solution is found for the meniscus profile: in agreement with our experimental findings, a low-viscosity-liquid film is entrained along the walls.
However, when considering the case of moderate and small viscosity ratios, we found another instability mechanism, see e.g. Fig. 3C for which . As increases, the apparent curvature of the meniscus decreases and changes sign. As a result the apparent contact angle increases toward . Above a critical value, again, no stationary solution is found. However, this dual instability yields a meniscus shape opposite to the one found for large : a liquid sheet grows upstream between the two plates. The interface profile shown in Fig. 3C exactly corresponds to the one one reported in Aarts et al. (2013) for colloidal liquid with moderate viscosity contrast, . Therefore our numerical results solve the apparent contradiction between Aarts et al. (2013) and our experimental findings: viscous-finger menisci can experience two qualitatively different liquid-entrainment instabilities.
To further check the consistency of our predictions. We conducted experiments with silicon oil having an ultra-low viscosity . Even though this viscosity ratio prevents the formation of viscous fingers, we did observe a strong change in the liquid motion at sufficiently high . Again, above a critical capillary number (open symbol in Fig. 2D), a liquid sheet is entrained between the two plates ahead the main front, and subsequently re-wets the confining wall. As a result oil droplets are trapped on the two solid surfaces, see supplementary movie 4. This observation is akin to the ones reported both in Aarts et al. (2013), and in Marchand et al. (2012) for air entrainment in a liquid bath. Together with our first experimental findings, this last experiment unambiguously confirms that, thin films can be entrained from a driven meniscus according to two different scenarios set by the magnitude of the viscosity ratio, .
We stress that both scenarios echoes the intricate coupling between the two fluid flows at the contact line. Even when it is associated to the smaller viscosity, the flow in the wetting phase significantly alter the stability of the meniscus upon imbibition dynamics. Sufficiently close to the contact line, due to the geometrical divergence of the strain rate, compares to . In the absence of any intrinsic length scale for the interface dynamics in Eq. 1, and in the Stokes equation, the local modification of the meniscus curvature by the flows at the tip of the liquid wedge propagates up to the macroscopic scales.
These two entrainment scenarios define the stability diagram plotted in Fig. 4A. The stable meniscus region in the plane is bounded by two critical curves, that meets at . Below the entrained films propagate at the center of the gap, whereas above entrainement occurs along the confining walls. This prediction capture well the salient features of the experimental phase diagram shown in Fig. 2D. However we did not achieve a quantitative agreement. For instance was predicted to be of the order of , yet it was measured to be close to unity. Needless to say that this discrepancy is not really surprising given the simplification of the meniscus geometry in the -direction, and potentially due to pining effect at the contact line which we have ignored.
Two last comments are in order. Firstly, we provide a simple criteria to distinguish between the two liquid-entrainment scenarios. To do so, we consider the flow in a perfect wedge of angle , which is a reasonable approximation in the very vicinity of the contact line. Below , in the low-viscosity liquid, the stream lines have a simple V-shape, Fig. 4C. Conversely above they split into two recirculations, Fig. 4B. Simultaneously the radial velocity of the fluids at the interface changes its sign: is defined as the viscosity-contrast value at which the radial component of the interface velocity vanishes. Secondly, looking now at the pressure field in the oil phase, we can gain additional physical insight into the high regime. Fig. 4B indeed reveals that the tip of the liquid wedge is pulled downstream by a marked depression spot located at in the oil phase, thereby promoting entrainment past the solid wall.
In summary, we have demonstrated a novel class of forced imbibition patterns. They stem from the entrainment of thin films out of the interface between a wetting fluid and a high viscosity fluid when driven past solid surfaces. In addition, we have introduced a minimal theoretical framework which accounts well for all the imbibition-induced meniscus instabilities that have been reported so far. Our findings should provide useful guidelines for the formulation of effective additive for cleaning, and enhance oil recovery applications.
We thank B. Andreotti, J. Snoeijer and E. Santanach Carreras for illuminating discussions, and C. Odier for help with the experiments. D.B acknowledge support from Institut Universitaire de France.
References
- Couder (2002) Y. Couder, Perspectives in Fluid Dynamics: A Collective Introduction to Current Research (Cambridge University Press, 2002).
- Bensimon et al. (1986) D. Bensimon, L. Kananoff, S. kiang, B. Shraiman, and C. Tang, Reviews of Modern Physics 58, 977 (1986).
- Homsy (2002) G. Homsy, Annual Review of Fluid Mechanics, Vol 43 19, 271 (2002).
- Lenormand (2001) R. Lenormand, Journal of Physics-Condensed Matter 2, SA79 (2001).
- Saffman and Taylor (1958) P. G. Saffman and G. Taylor, Proceedings of the Royal Society A: Mathematical, Physical and Engineering Sciences 245, 312 (1958).
- Sahimi (1993) M. Sahimi, Reviews of Modern Physics 65, 1393 (1993).
- Weitz et al. (1987) D. A. Weitz, J. P. Stokes, R. O. Ball, and A. C. Kushnick, Physical Review Letters 59, 2967 (1987).
- Stokes et al. (1986) J. P Stokes, D. A. Weitz, J. P Gollub, A. Dougherty, M. O. Robbins, P. M. Chaikin, and H. M. Lindsay, Physical Review Letters 57, 1718 (1986).
- Aarts et al. (2013) D. G. a. L. Aarts, S. A. Setu, I. Zacharoudiou, G. Davies, D. Bartolo, S. Moulinet, a. a. Louis, and J. Yeomans, Soft Matter (2013).
- Snoeijer and Andreotti (2013) J. H. Snoeijer and B. Andreotti, Annual Review of Fluid Mechanics, Vol 43 45, 269 (2013).
- Ledesma-Aguilar et al. (2013) R. Ledesma-Aguilar, A. Hernández-Machado, and I. Pagonabarraga, Physical Review Letters 110, 264502 (2013).
- (12) Supplementary informations. Description of the experiments and of the numerical methods..
- Saintyves et al. (2013) B. Saintyves, O. Dauchot, and E. Bouchaud, Physical Review Letters 111, 047801 (2013).
- Levaché et al. (2012) B. Levaché, A. Azioune, M. Bourrel, V. Studer, and D. Bartolo, Lab on a chip 12, 3028 (2012).
- Lajeunesse and Couder (2000) E. Lajeunesse and Y. Couder, Journal of Fluid Mechanics 419, 125 (2000).
- Snoeijer (2006) J. H. Snoeijer, Physics of Fluids 18 (2006).
- Marchand et al. (2012) A. Marchand, T. Chan, J. Snoeijer, and B. Andreotti, Physical Review Letters 108, 204501 (2012).
- Chan et al. (2013) T. S. Chan, S. Srivastava, A. Marchand, B. Andreotti, L. Biferale, F. Toschi, and J. H. Snoeijer, Physics of Fluids 25, 074105 (2013).
- Huh and Scriven (1971) C. Huh and L. Scriven, Journal of Colloid and Interface Science 35, 85 (1971).
- (20) L. F. Shampine, I. Gladwell, and S. Thompson, Solving ODEs with MATLAB, Cambridge University Press.
SUPPLEMENTARY INFORMATIONS
I Experiments
I.1 Microfluidics
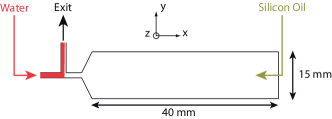
The experiment consists in injecting an aqueous solution (water, SDS 1 wt% and food dye) in a microfluidic Hele-Shaw channel filled with silicon oil (Rhodorsil Oils of viscosity ranging from 5 cp to 3500 cp). The channels are made by bonding two glass slides with a double-sided tape cut with a precision plotting cutter (graphtec robo). Prior to assembly, a thin film of thiolene-based resins is deposited on the two glass slides (NOA 81, Norland Optical Adhesives). Using NOA81 surfaces, the advancing contact angle of the aqueous solution immersed in silicon oil can be continuously varied from downto by means of a deep-UV exposure Levaché et al. (2012). The geometry of the resulting channels is sketched in the supplementary figure 1. Their height is constant over the entire device, , and does not change as the fluids are flown. The width and the length of the main channel are , and respectively. In order to accurately control both the wetting properties of the walls, and the initial shape of the water-oil meniscus, the liquids are injected as follows. First, the channel is filled with silicon oil by applying a constant pressure which is maintained over the entire experiment. Then, the aqueous solution is flown at a constant flow rate with a precision seringe pump (Nemesys, Cetoni). The two fluids meet at the T-junction and form a flat interface, supplementary Figure 1. Once the interface reaches a stationary shape, the T-junction outlet is closed to trigger the invasion the Hele-Shaw cell by the aqueous solution. In order to avoid any possible modification of the wetting properties of the hydrophilic surfaces by the water, the surfactant, or the dye molecules the chips are not recycled.
I.2 Observations and measurements
The invasion patterns are observed with a macro lens (Nikkor f/2.8G, Nikon) mounted on a , 14bit CCD camera (Prosilica GX3300), which yield a spacial resolution of . We also convert the transmitted-light intensity into the local water-pattern thickness with a resolution of .
The local thickness of the water films relate to the image intensity via the Beer-Lambert absorption law:
| (2) |
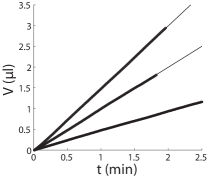
where is the dye concentration, is the absorptivity, and is the transmitted intensity for a channel filled with silicon oil. was determined by performing experiments with colored water only, in channels of known height using solutions with increasing concentrations. Note that the measure of allowed us to correct the spatial heterogeneities of the observation setup. We also performed a systematic correction of the (minute) temporal fluctuations of the light source by bringing the average light intensity outside the channel to the same value for all images. We benchmarked this method by measuring the increase of the volume of aqueous solution injected at constant flow rates e.g. for the three imbibition experiments corresponding to Fig. 1 (, and respectively). These three curves shown in supplementary figure 2 are perfectly fitted by straight lines, the slope of which indeed corresponds to the imposed flow rates within a error (best linear fits: , and respectively).
II Numerical resolution of the meniscus shape
The geometry of the meniscus is depicted in the supplementary figure 3. In order to solve Eq. 1 within a small curvature approximation and a wedge-flow ansartz Chan et al. (2013), we first consider as an extra variable, and rescale by , and the local thickness by , the interface shape is then the solution of:
| (3) | ||||
| (4) | ||||
| (5) | ||||
| (6) |
associated with the boundary conditions: , , , and . is a slip length used to regularize Eq. 4, none of the following results qualitatively depends on this parameter. The non-linear function in Eq. 5 is readily computed from the Hue and Scriven solution for a wedge flow Huh and Scriven (1971):
| (7) |
This boundary value problem is effectively solved using an iterative collocation method. In fact we used the bvpc4 Matlab routine shampine2003solving .