11email: epm@iaa.es, jvm@iaa.es, kehrig@iaa.es 22institutetext: Leibniz-Institut für Astrophysik Potsdam (AIP). An der Sternwarte 16, 14482 Potsdam, Germany 22email: 33institutetext: Departamento de Física Teórica y del Cosmos. Universidad de Granada, Campus Fuentenueva, Granada, Spain.
33email: mrelano@ugr.es 44institutetext: Instituto de Astronomía, Universidad Nacional Autónoma de México, Apdo. Postal 70264, 04510, Méx. D. F., Mexico 44email: chris.morisset@gmail.com
The giant Hii region NGC 588 as a benchmark for 2D photoionisation models
Abstract
Aims. We use optical integral field spectroscopy and 8m and 24m mid-IR observations of the giant H ii region NGC 588 in the disc of M33 as input and constraints for two-dimensional tailor-made photoionisation models under different geometrical approaches. We do this to explore the spatial distribution of gas and dust in the interstellar ionised medium surrounding multiple massive stars.
Methods. Two different geometrical approaches are followed for the modelling structure: i) Each spatial element of the emitting gas is studied individually using models which assume that the ionisation structure is complete in each element to look for azimuthal variations across gas and dust. ii) A single model is considered, and the two-dimensional structure of the gas and the dust are assumed to be due to the projection of an emitting sphere onto the sky.
Results. The models in both assumptions reproduce the radial profiles of H surface brightness, the observed number of ionising photons, and the strong optical emission-line relative intensities. The first approach produces a constant-density matter-bounded thin shell of variable thickness and dust-to-gas ratio, while the second gives place to a radiation-bounded thick shell sphere of decreasing particle density. However, the radial profile of the 8m/24m IR ratio, depending on the gas and dust geometry, only fits well when the thick-shell model is used. The resulting dust-to-gas mass ratio, which was obtained empirically from the derived dust mass using data from Spitzer, also has a better fit using the thick-shell solution. In both approaches, models support the importance of the low surface-brightness positions on the integrated spectrum of the nebula, the chemical homogeneity, the ionisation-parameter radial decrease, and the robustness of strong-line methods to derive the equivalent effective temperature in extended regions. These results must be taken with care in view of the very low extinction values that are derived from the IR, as compared to that derived from the Balmer decrement. Besides, the IR can be possibly contaminated with the emission from a cloud of diffuse gas and dust above the plane of the galaxy detected at 250 m Herschel image.
Key Words.:
galaxies: individual: M33, ISM – ISM: abundances, dust, extinction, structure – H ii regions: abundances1 Introduction
High surface brightnessH ii regions in the optical spectral range are luminous tracers of both the physical properties and chemical abundances of the interstellar medium (ISM) of the galaxies where they are located. Indeed, H ii regions in star-forming galaxies are one of the most widely objects used to find out these properties throughout the Universe. In non-resolved H ii regions the optical spectra are collected by means of integrated fibres or long-slit techniques, while integral field spectroscopy (IFS) allows spectral measurements with 2D spatial resolution for objects in the Local Universe. The studies of the structure of H ii regions then become more complex, and therefore more elaborated depictions become now necessary. This opens the gate to a better understanding of the interplay between stars, dust, and gas appearing in different spatial positions and to assess if the assumptions made to study integrated observations in non-resolved objects lead to accurate determinations of their properties.
The most challenging issues that come from the study of the two-dimensional structure of H ii regions appears as a consequence of the lack of spatial uniformity in many of their properties. For instance, it is shown by Ercolano et al. (2009) and Jamet & Morisset (2008) that the distribution of the ionising stars in relation to the gas alters the ionisation structure and the electron temperature. Other authors (e.g., Giammanco et al. 2004) point out the relevance of gas density inhomogeneities, which also lead to inhomogeneities in the other physical properties derived from optical spectroscopy. Castellanos et al. (2002) also show how the ionisation structure of the gas depends on the amount of available gas in different matter-bounded configurations, which gives place to large fractions of escaping ionising photons and then affects the observed emission-line ratios used to derive the physical properties and chemical abundances of the gas.
Photoionisation models constitute powerful tools for the interpretation of the physics involved in H ii regions. Under appropriate geometrical considerations, models allow us to relate the collected observational information to both quantitative and qualitative characterisations of the studied objects and to derive their physical properties and chemical abundances. Models that are 3D are the most suitable appliances to spatially disentangle the effects of different ionising sources on the non-uniform surrounding gas. Nevertheless, the lack of observational information about the distribution of gas and stars along the line of vision prevents this kind of 3D model from fitting many optical IFS data on H ii regions most of the time. On the other hand, other techniques based on photoionisation models try to describe the observed spatial variations in ionised gaseous nebulae as a consequence of the projection of a 3D structure on a plane. This is the case of the codes, NEBU_3D (Morisset et al., 2005) or Cloudy 3D (Morisset, 2006). In a novel approach to reproduce IFS data, Pérez-Montero et al. (2011a) use 1D photoionisation models to fit the optical IFS (Relaño et al., 2010) and 8 m and 24 m mid-IR Spitzer bands properties of the Giant H ii Region (GH iiR) NGC 595 in the disc of M33. In that work, different annuli around the ionising source are defined in the area covered by a mosaic of several integral field unit (IFU) pointings, and their measured integrated properties are later fitted by the models. These models depict a uniform metallicity across a thin shell, whose optical and IR observed structure can be explained with azimuthal variations (i.e., in the plane of the galaxy) in some of the properties of the H ii region, as in the dust-to-gas ratio and the matter-bounded geometry.
Since both azimuthal variations and projection effects are expected to co-exist as causes of the observed spatial variations throughout the distribution of gas and dust in H ii regions, it is necessary to explore both model strategies in well-known and characterised objects, as is the case of the GH iiR NGC 588, which is also in M33. Two-dimensional observations of NGC 588 in both optical and mid-IR are described in Monreal-Ibero et al. (2011) (hereafter MI11); thus, a 2D observational characterisation of the properties of the ionised gas and the hot dust is possible. Besides, previous studies on this GH iiR, which are based on ground and spacecraft imaging in different bands from the UV up to the NIR, were used by Jamet et al. (2004) to study the location and nature of the ionising stellar population.
The aim of this work is to study the possible causes of the observed spatial variations across NGC 588 for both the optical and mid-IR properties to test the solidness of the strong-line methods used in integrated observations. This is done to derive physical properties and chemical abundances by means of photoionisation models of the well-studied GH iiR NGC 588. To do so, we took two different assumptions: i) an improved version of the approach employed by Pérez-Montero et al. (2011a) for NGC 595, based on different models for the individual observed spatial elements which are used to explain the observations that are caused by azimuthal variations of its properties throughout the field of view and ii) a single model projected onto the sky which is used to explain the variations as a consequence of the perspective. In the next section, we describe the 2D structure of NGC 588 and the data sampling of the spatial distribution for both optical and mid-IR data studied in MI11 and the derivation of the integrated dust-to-gas ratio from dust temperature and total Hi mass. In Section 3, we present our models and in Section 4, we discuss our results. Finally, we summarise our results and conclusions in Section 5.


2 Data description and analysis
2.1 Properties and 2D structure of NGC 588
The optical observations modelled here were taken on October 9-10, 2009 during the commissioning run of the new Potsdam Multi-Aperture Spectrophotometer (PMAS, Roth et al. 2005, Roth et al. 2010) CCD on the 3.5 m telescope at the Calar Alto Observatory (Almería, Spain). The PMAS was used in the lens array mode (LARR), which is made out of 1616 square elements, with the magnification scale of 11 arcsec2. A mosaic of six tiles was needed to map most of the surface of NGC 588. The V600 grating and the 22 binning mode were also utilised, achieving a 3.4 Å full width half maximum spectral resolution and covering a spectral range of 3 620 Å- 6 800 Å. This is adequate for the needs of our modelling, since the main optical emission lines, including [O ii] 3727 Å, H, [O iii] 5007 Å, H, [N ii] 6584 Å, and [S ii] 6717, 6731 Å, were observed. Further details of the observations and data reduction can be found in MI11.
The IR data of NGC 588 analysed in this paper were taken from the Spitzer Data Archive: the 8 m image from IRAC (Infrared Array Camera, Fazio et al. 2004) and 24 m - 160 m from MIPS (Multiband Imaging Photometer, Rieke et al. 2004). The spatial resolutions of the images at 8, 24, 70, and 160 m are 2′′, 6′′, 18′′, and 40′′, respectively. The stellar contribution at 8 m was subtracted using the emission at 3.6 m, following the method described in Helou et al. (2004) and Calzetti et al. (2007). The IR observations and data reduction of 8 m, 24 m, 70 m, and 160 m images are described in Verley et al. (2007). We also used the 250 m emission map from the Herschel telescope in this study. The emission at 250 m clearly delineates the H emission of H ii regions with shell morphology (see Fig.3 of Verley et al. 2010). This map was taken as part of the ‘Open Time Key Project’ HerM33es (Kramer et al., 2010).
NGC 588 has a much more complex and irregular reddening structure than NGC 595. Overall, it is more excited (e.g., in the brightest H regions log([Oii]/[Oiii]) 0.15 in NGC 588 and 0.9 in NGC 595). This excitation difference is also evident by inspecting the relative fluxes of other emission lines not affected by dust depletion. Rubin et al. (2008) measure log([Neii]/[Neiii]) 0.10 in NGC 588 and 0.86 in NGC 595 from Spitzer/IRS data. The integrated 8m/24m ratio measured by Spitzer in NGC 588 is 2 times higher than that in NGC 595. Since the 8m is associated mainly with the emission of polycyclic aromatic hydrocarbons (PAHs) formed in the photodissociation region (PDR) and the emission at 24m owes mainly to the small and hot dust grains mixed with the ionised gas, this ratio can be used as an indicator of the geometry in H ii regions (e.g., Bendo et al. 2008). The velocity maps in NGC 588, which are measured by MI11, are typical for evolved H ii regions, where most of the mechanical energy has already been ejected into the ISM. No density structure from [S ii] emission lines is found. Regarding the brightest optical emission lines, it is found that the relative intensity of low excitation lines, as [O ii], [S ii], or [N ii], increase radially, in contrast to [O iii], which decreases at a larger distance to the ionising sources. The different radial structure of high- and low- excitation emission lines implies that some diagnostics based on strong lines can present large variations across the nebula. On the contrary, other estimators based only on low-excitation lines, such as N2O2 or N2S2, which trace the nitrogen-to-oxygen (N/O) abundance ratio (Pérez-Montero & Contini, 2009) remain uniform within the errors across the gas. It is therefore that the ionisation parameter decreases radially and there is a chemical homogeneity across the region found from several strong-line methods.
Considering the metal content of NGC 588, Vílchez et al. (1988) derive an oxygen abundance 12+log(O/H) = 8.30 0.06, which is consistent with the radial distance of this region to the centre of M33 (e.g., Rosolowsky & Simon 2008). Nevertheless, its log(N/O) = -1.52 0.07 is lower than the expected value with the same criterion (e.g., Magrini et al. 2007). In a later work, Jamet et al. (2005) derive a slightly lower metallicity [12+log(O/H) = 8.16 0.07, 0.3 Z⊙] and a higher log(N/O) [=-1.39 0.09], but they argue that no confident estimation of these abundances can be made, since they obtain an electron temperature of [O iii] based on the ratio of 5007 Å and 88 m emission-lines, which are about 3000 K lower than those derived using similar optical diagnostic ratios. They then consider different geometrical approaches to make 1D tailor-made models of this region, but electron temperatures and ionic abundances are quite similar to those obtained from the measured optical emission lines in all cases.
2.2 Data sampling
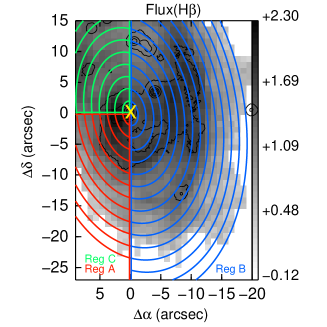
NGC 588 presents a ring-like morphology in H (see maps in MI11 and also in Muñoz-Tuñón et al. (1996)). Therefore, the strategy to extract the spatial information is similar to the one adopted in Pérez-Montero et al. 2011a for NGC 595, which is based on elliptical concentric annuli. However, we found that the ionisation structure does not necessarily follow the same ring-like symmetry in MI11. In particular, the [O iii]5007Å/H line ratio is especially high in the SE quadrant, while the values of the [N ii]/H, [S ii]/H, [O iii]/[O ii], and [O ii]/H line ratios in the NE quadrant correspond to larger ionisation parameters than those measured at similar distances to the emission peak. Therefore, we decided to model the GHiiR by dividing it in three regions, as depicted in Fig. 1. Hereafter, we refer to the corresponding defined regions as A (SE quadrant), B (W half) and C (NE quadrant).
We divided each region in annuli, which were considered as circles onto the plane of the galaxy but have an elliptical shape owing to the inclination of the disc onto the sky. The elliptical annuli were all centred at the location of the peak of emission in the continuum (R.A. (J2000): 1h32m45.7s, DEC.(J2000): +30∘38′55.1”). The position of the centre and the annuli are shown in Fig. 1 compared to the emission of the gas and dust in different wavelengths. The major to minor axis ratio of the ellipse was derived using the inclination angle of the galaxy (i=56∘ for M33, van den Bergh 2000), and we chose a position angle of 10∘ for the major axis, since this orientation better traces the shell structure of the region (see Fig. 1). In this configuration, we used rings of 2′′width to obtain the profiles for the elliptical regions from our IFS observations and 8 m image, while rings of 6′′width were utilised for the 24 m image. The covered radial distance varies, depending on the region, which can range from about 90 pc for region C to 150 pc for region B if we consider the distance to M33 adopted in MI11, which is of 840 kpc.
We applied masks to the data cube of our IFS observations to isolate the emission coming from each annulus and the integrated spectra for each of them which were produced. The spectra were analysed using the MPFITEXPR algorithm (Markwardt, 2009) to fit the different emission lines with a Gaussian function plus a 1-degree polynomial function for the continuum subtraction. The final result of this procedure is a set of integrated fluxes for the emission lines fitted in the spectrum corresponding to each elliptical annulus. Flux errors were obtained as a combination of those derived in the profile fitting procedure and the uncertainty in the continuum subtraction (see Pérez-Montero & Díaz 2003 and references therein). The IFS observations were not taken under photometric conditions. Since no absolute calibration was performed with the help of auxiliary images, all the fluxes are in relative units (see MI11 for details).
2.3 Description of the measured radial profiles
The co-addition of the emission from the fibres included in each annulus allowed us to find the radial variation of different ratios based on the reddening-corrected emission-line intensities. The different spatial behaviour observed in these ratios for different angular positions has motivated a separate analysis.
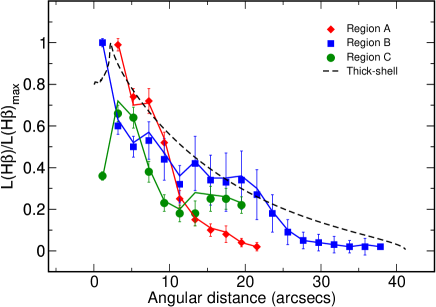
The radial profile of the H surface brightness relative to the H emission peak, as plotted in Fig. 2, has its maximum in the central position, and it decreases with distance in the three regions, although in a more irregular manner in region C.


In Fig. 3, the radial variation of some ratios involving the measured optical emission-lines are shown. The R23 parameter is defined as the sum of [O ii] 3727 Å and [O iii] 4959,5007 ÅÅ relative to H intensity (Pagel et al., 1979) and is used as an estimator of metallicity, despite its bi-valuated behaviour. Its radial profile, shown in the upper left panel of Fig. 3, is quite different in the three regions: it is uniform around log R23 0.9 in the inner annuli of region B and in the whole region C, but it increases with distance in region A and the outer annuli of region B, reaching values larger than log R23 1.3.
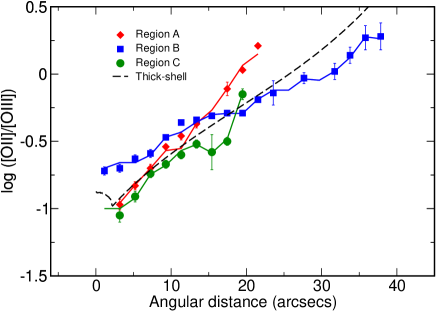
The ratio of oxygen emission lines [O ii]/[O iii], shown in upper right panel of Fig.3, depends mainly on the ionisation parameter (Díaz et al. 2000, ; i.e., the ratio between ionising photons and particle density, in the case of matter-bounded nebulae also depends strongly on the thickness of the gas envelop. The radial profiles have similar behaviours in the three regions with the same average value being lower at closer distances to the ionising source (e.g., with larger ) but having a larger slope in regions A and C and lower in region B.
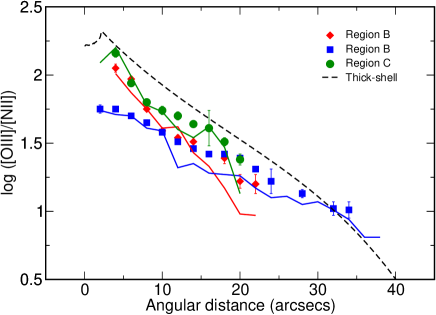
The emission-line ratio [N ii] 6584Å/H, defined as N2, is used as an estimator of metallicity (e.g., Storchi-Bergmann et al. 1998), although it also depends on the ionisation parameter (Pérez-Montero & Díaz, 2005) and on the nitrogen abundance (Pérez-Montero & Contini, 2009). As can be seen in the left middle panel of Fig. 3, [N ii] 6584Å/Hincreases radially from the inner to the outer annuli in all three regions, although the average value is lower in region C. The opposite behaviour is seen for the ratio of [O iii] at 5007 Å and [N ii] at 6584 Å, (middle right panel of Fig.3), known as O3N2, and is also used to estimate metallicities (Alloin et al., 1979). In region B, it is found for both the lower average value and variation.
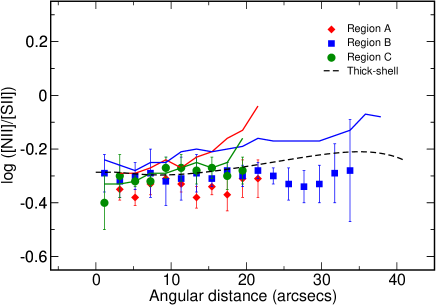
In the case of ratios that depend only on low-excitation emission lines, the observations in MI11 were confirmed. Both [N ii]/[O ii] and [N ii]/[S ii], which are also known as N2O2 and N2S2, respectively, and which are proposed as estimators of N/O (Pérez-Montero & Contini, 2009), remain constant across all the three regions, as shown in lower panels of Fig.3.
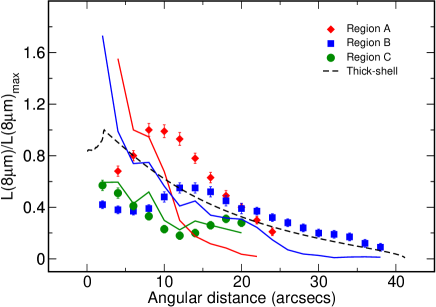
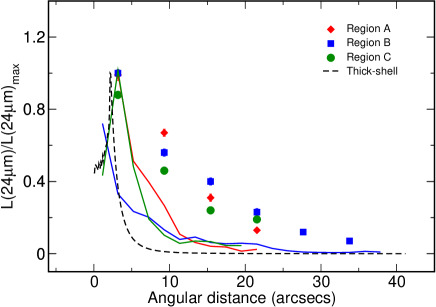
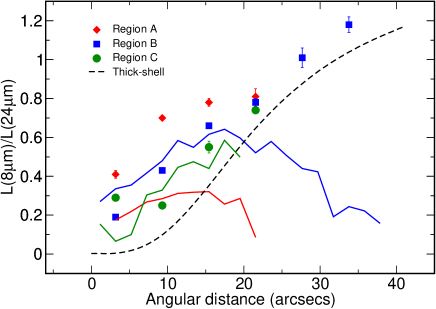
Regarding the observed surface brightness of the Spitzer bands at 8 m and 24 m , as shown in Fig.4, both present maxima at the central annuli of the three regions with decreasing radial profiles, although the maximum 8m emission is slightly displaced towards outer position in regions A and B. The ratio of surface brightness 8 m/24 m sampled at the same spatial resolution increases radially in the three regions, from values around 0.2 in the central position to values higher than 1 for the further ones, which agrees with the average values of this ratio found by Bendo et al. (2008) in a sample of H ii regions in spiral-discs. The average value of this ratio, however, is sensibly lower in region C.
2.4 Dust mass and extinction in NGC 588
Mid- and far-IR observations allow us to estimate the total amount of dust within the GH iiR and obtain an estimate of the extinction. The dust mass derived from these observations can be used to derive a dust-to-gas mass ratio that can be later compared with results from the models.
We assumed that most dust mass is in the form of grains in thermal equilibrium, thus the dust mass can be computed for a given flux () using the following expression:
| (1) |
where is the observed flux, is the Planck function, is the mass absorption coefficient (=24.6 cm2 g-1 (Lisenfeld et al., 2002) with , , which is typical of interstellar grains (Draine & Lee, 1984), and is the assumed distance of M33 (840 kpc), Freedman et al. 1991). To derive the dust mass, we need to know the dust temperature, which can be estimated from the (70 m)/(160 m) ratio (e.g., Tabatabaei et al. 2007). We estimated the dust temperature by using the 70 m and 160 m images of M33 from Spitzer (Verley et al., 2007), whose emission was integrated for NGC 588. Assuming an upper limit, where the entire 70 m emission comes from big grains, this temperature is 29 K, and assuming that only 60% of the 70 m emission comes from big grains, we estimated a temperature of 25 K. The dust temperature estimate for NGC 588 is slightly higher than the one derived in Xilouris et al. (2012), which uses two modified blackbodies that include the emission from 24m to 500m.
By taking values for the dust temperature of T=25, 27, and 30 K, we estimated the dust mass using the emission at 160 m in Eq. 1, and we found , , and , respectively. The total Hi mass corresponding to the H ii region was derived from the Hi map given in Gratier et al. (2010). We integrated the Hi emission by using the same 70′′diameter aperture to obtain the 70 m and 160 m fluxes and derived a total Hi mass of 6.5. Since the mass of the molecular cloud associated with NGC 588 is negligible (Bluhm et al. 2003 and Verley et al. 2007) we can consider the M(Hi) to be representative of the total gas mass. With this approximation, we derived values for the dust-to-gas ratio in NGC 588 of , , and for the three dust mass estimates, respectively (500 M⊙, 380 M⊙, and 270 M⊙). These estimates for the dust-to-gas ratio are close to the Galactic standard value (, Draine & Lee 1984).
We can also derive the inner extinction, which is the amount of dust produces in the H ii region. Using the dust temperature estimated above and the integrated flux at 160 m for the H ii region, we can predict the dust opacity at 160 m, μm by following the equation:
| (2) |
where is the solid angle covered by the region. Assuming μm (Tabatabaei et al., 2007) from standard dust models for the diffuse emission, we obtain an estimate of the extinction at H. We derived values for of 0.06, 0.04, and 0.03, which is equivalent to extinctions (A(H)=1.086) of 0.06, 0.05, and 0.03 for dust temperatures of 25K, 27K, and 30K, respectively. This range for the extinction agrees within the uncertainties of the intrinsic extinction that is derived using the H/24 m ratio for NGC 588 (Relaño & Kennicutt, 2009). However, it must be noted that this value is much lower than the average extinction value derived from the Balmer decrement both from IFS (MI11) and other optical integrated observations (e.g. Melnick 1979, Viallefond & Goss 1986, Melnick et al. 1987) and which point to values of the inner extinction in the range A(H) = 0.3 - 0.7. This disagreement could be consequence of different extinction properties for the gas in the H ii region and the dust emitting in the IR.
3 Model description
Photoionisation models were performed to reproduce the observed relative fluxes of the brightest optical emission-lines and Spitzer mid-IR broad filters that were centred at 8 m and 24 m in all annuli of the three defined regions. Improving the models described in Pérez-Montero et al. (2011a) for NGC 595, where the observed [O ii]/H and [O iii]/H emission-line ratios were used, we also compared the models with the nebular ratios of [N ii] 6584 Å/H and [S ii] 6717,6731 ÅÅ/H.
To do so, two different extreme approaches were envisaged: i) the observed properties in each annulus were considered to be independent of the properties of the rest of the nebula, so a different model was computed for each one of these annuli. This methodology is useful for seeking azimuthal variations in the properties of the gas and the dust. The resulting geometry of the models under this assumption is a matter-bounded (MB) thin shell. ii) The observed properties of the gas are a consequence of the projection of an emitting gas-sphere onto the sky. This approach is useful for studing possible projection effects. In this case, a single model was done to reproduce the observations and a radiation-bounded (RB) thick shell is obtained in this case.
In both approaches, models were made using the code Cloudy v.10.00 (Ferland et al., 1998), which models the effects of a radiation source on a one-dimensional gas and dust distribution. Input gas-phase abundances were used to match the derived metallicity from optical observations and assumed chemical homogeneity, as suggested in MI11. In the thin-shell approach the observations were reproduced using the value derived by Jamet et al. (2005), which includes He, O, and S elemental abundances that are derived from optical, collisionally excited lines and the measurement of the corresponding electron temperatures. In the thick-shell model, a slightly higher oxygen abundance was required [12+log(O/H) = 8.3] to reproduce the observations. In both approaches, a same value of N abundance was used to reproduce the radial profiles involving [N ii] emission lines [12+log(N/H) = 6.9]. The abundances for the rest of elements were rescaled by taking the difference to the oxygen abundance in the solar photosphere as a reference as given by Asplund et al. (2009).
Regarding the ionising spectral energy distribution (SED) used in both approaches, we adopted the conclusions of the spectrophotometric star-by-star study of this GH ii R made by Jamet et al. (2004). These authors conclude that the SED of the three observed ionising clusters is dominated by the most massive stars in the southern cluster, which hosts two WN stars. Later, Jamet et al. (2004) adopted an effective temperature of 41 000 K as equivalent for the three clusters. Therefore, we used the SED of a single WM-Basic O star (Pauldrach et al., 2001) with metallicity Z = 0.5Z⊙ for our models (the closest available to the value that corresponds to the measured oxygen gas-phase abundance), log(g) = 4.0, and effective temperature equal to 41 000 K. We checked the effect of a Starburst99 (Leitherer et al., 1999) SED in our models that corresponds to the equivalent cluster age proposed in Jamet et al. (2004) (around 4.3 Myr), which is attained by means of, among other techniques, colour-magnitude diagrams. However, we were not able to satisfactorily reproduce the radial profile of sny of the observed properties, whose spatial distribution we tried to fit. This is owing to the much lower relative number of ionising photons in a SED for this age in relation with the two dominant massive stars. This IMF sampling effect in this low massive GH iiR is well described in Cerviño et al. (2003) and Jamet et al. (2004). In any of these cases, although all the observed emission-line profiles are well fit using the assumed single star SED, some effects from the low massive stars to the low-excitation emission-lines are not be negligible.
| MB Thin-shell | RB Thick-shell | |
|---|---|---|
| L(H) | C | C |
| I([O ii])/I(H) | C | C |
| I( [O iii])/I(H) | C | C |
| I([N ii])/I/H) | C | C |
| I([S ii])/I/H) | C | C |
| L(8m) | F | F |
| L(24m) | F | F |
| gas density | I | F |
| Q(H) | F | I |
| dust-to-gas ratio | F | I |
| abundances | I | I |
| SED | I | I |
| inner radius | I111free in the first annulus | I |
| outer radius | F | F |
| filling factor | F | I |
In Table 1, we list the different parameters considered in the two geometrical approache, by distinguishing between the following input, if they are fixed in the models; free, if they vary to find the better solutions; and constrained, if they are fit to the observed values by means of varying the free parameters. Details are explained in the following sub-sections.
3.1 MB thin-shell geometry models
We used the same methodology and geometrical approach assumed for the modelling of NGC 595 that was carried out by Pérez-Montero et al. (2011a). This consists of the direct comparison between the transmitted spectra predicted by the models in each annulus, as defined over the shell, and the IFS observed spectra in the same regions. As Cloudy models result in a closed geometry around the ionising sourceby default and observations are analysed in a plane, all resulting magnitudes were divided by the corresponding area before their comparison (i.e., the surface of a sphere in the case of models and the corresponding angular size of the annuli for the observations). This procedure gives a qualitative rather than a quantitative analysis, but it constitutes a solid approach to study the azimuthal variations of the physical properties of gas and dust as a function of the distance to the ionising source in each part of the nebula.
A model for each annulus was calculated assuming that a complete ionisation structure is formed for different positions of the shell. A set of initial input model conditions was imposed in each model, and then an automatic iterative process was carried out by the code to fit the observed features, including the emission-line intensities relative to H of [O ii] at 3727 Å, [O iii] at 4959, 5007 Å, [N ii] at 6584 Å, and [S ii] at 6717, 6731 Å, and the H surface luminosity relative to the maximum luminosity measured in the H ii region.
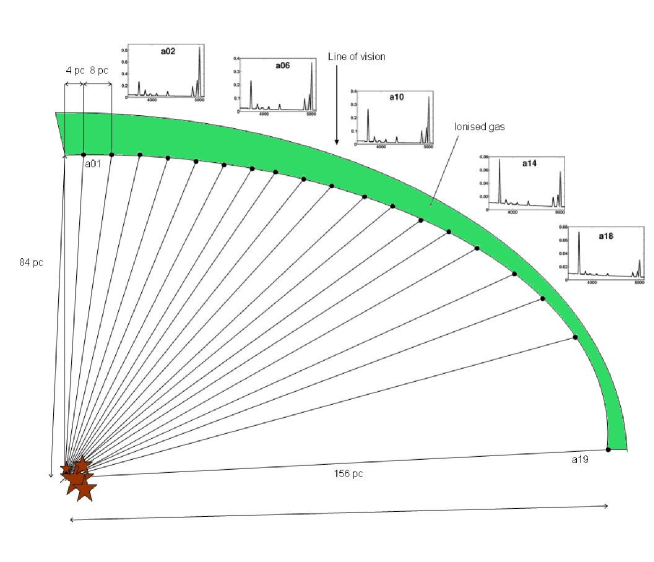
Since a hollow shell is considered, the distance between the inner face of the shell and the ionising source in the central annulus cannot be taken in the models simply as the projected angular distance, which is 4 pc (corresponding to 1 ′′ at the assumed M33 distance). Instead, a larger distance for the inner radius in this closest annulus is required to optimise the fitting of the observed quantities in the models. In this case, the best agreement between the observed and modelled emission-line ratios was found by assuming a distance of 84 pc between the inner face of the gas and the ionising source. The difference between the distance found by the models and the observed projected distance in this annulus can be interpreted as an unseen component of the distance in the direction perpendicular to the plane of projection. However, the inner radius for this annulus is a free parameter of the model and must be considered as an arbitrary value found to reproduce the observations under this geometrical assumption. In contrast to the innermost annuli, in the outermost this deprojection does not require models and observation do not agree. Therefore, the considered factor of deprojection for the furthermost annulus is 1 (i.e. the distance measured in the projected image and the inner radius of its corresponding model is the same, which is 156 pc in region B). In this way, the ratio between the adopted and projected distances is not uniform in the intermediate annuli, but it gradually decreases by assuming the geometry of a hollow ellipsoid of revolution. In Fig. 5, this can be seen by the resulting shell with their different modelled positions, which correspond to the annuli shown in Fig. 1 in a cut perpendicular to the plane of the projected sky for region B. However, it must be kept in mind that the ratio between semi-axes in this resulting geometry is arbitrary, as no reliable information about the deprojection factor or the inner radius can be obtained using this method. A constant density of 50 particles per cm3 was assumed, according to the values measured using the emission line ratio of [S ii] 6717Å/6731Å, which ranges between 10 and 100 particles per cm3 in the considered regions (MI11).
We left the following as free parameters: the number of ionising photons, the filling factor, the thickness of the gas shell, and the amount of dust, which is varied in each iteration of the model as a means to find the best agreement with the observed H surface brightness and emission-line ratios. A different number of ionising photons was considered in each model to test the robustness (i.e., non-degeneracy) of the solution in each model. The dust-to-gas ratio must also be considered to reproduce the observed emission because the dust heating affects thermal balance of the gas. It was also left as a free parameter to study possible spatial variations across the field of view. We adopted the default grain properties of Cloudy v10.00, which essentially has the properties of the ISM and follows a MRN (Mathis et al., 1977) grain size distribution.
In all models, the resulting filling factor and thickness lead to a plane-parallel MB geometry, where a large fraction of the ionising photons emitted by the central cluster escape to the outer ISM of the galaxy. The average in the four optical emission-line ratios (i.e., [O ii]/H, [O iii]/H, [N ii]/H, and [S ii]/H) and the relative H flux is better than 0.2 in all cases. The results of these models of the three studied regions for relative H surface brightness, optical emission-line ratios, and mid-IR emission are plotted as solid lines in Figs. 2-4.
3.2 RB thick-shell geometry model
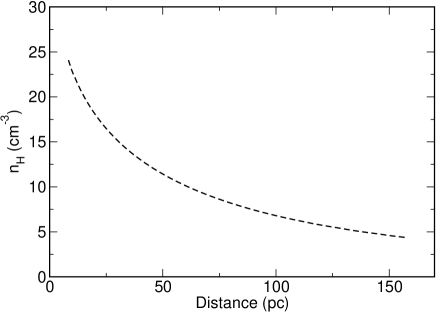
As an alternative to the models presented in the previous subsection, we explored the possibility of a spherical distribution of the gas. A sphere around the central source filled with gas that assumes a certain density law naturally shows a decrease in the surface brightness due to the diminution of the column with the angular distance to the centre of the object. Nevertheless this radial variation would not exactly follow the observed shape of the surface brightness decrease, so we need to also change the density according to the radius. We used the pseudo 3D code pyCloudy222Available at https://sites.google.com/site/pycloudy/ (the python version of Cloudy 3D, Morisset 2006) to compute a spherical model and to determine the values of the emission line intensities when projected on the plane of the sky. The pyCloudy code generates Cloudy input files corresponding to different angular directions (from the point of view of the ionising source) and runs the corresponding 1D model, which is later integrated in the line of vision for different impact parameters to get the observed radial variation. We determined the density law by trial and error, so that the global variation of the surface brightness is reproduced. The resulting density law is shown in Fig. 6 and has the following form,
| (3) |
with units of cm-3 and in units of pc. The inner radius of this model was arbitrarily set to 8.33 pc.
As in the previous approach, the thick-shell model has a unique central photoionising source that dominates the equivalent SED in this GH iiR. The number of ionising photons in this model, Q(H) = 1050.73 s-1, was set to agree with the value derived from the extinction-corrected total H luminosity derived by Relaño & Kennicutt (2009) [log(L(H) = 38.92 0.09 erg/s]. Dust is included in the model by using the same standard properties described for the thin-shell model, and no attempt was made to change the dust content with the radius. A constant filling factor of 0.055 was used to match the observed size and density of the region. The model is RB. The emergent spectrum is calculated when the electron temperature is lower than 4 000 K, which happens for an outer radius of 160 pc. The decrease of the ionisation relative to the radial distance to the centre of the object is naturally reproduced by the decrease of the ionisation parameter due to the dilution of the radiation when moving away from the central source. The aim of this model is only to reproduce the global variations of the observables with the radial distance; its simpleness can obviously not reproduce the differences observed in the regions A, B, or C. These differences are thus thought to be associated with local variations in the assumed radial laws for the density and filling factor. The results of this model in regards to H relative surface brightness, optical emission-line ratios and mid-IR emission is shown as a dashed line in Figs. 2-4.
4 Results and discussion
4.1 Geometrical implications
Although the models under the two different assumptions described above are able to reproduce most of the 2D observed structure of NGC 588, the final geometries considered in them are very different. On one hand, a thin-shell geometry for the gas surrounding the ionising star clusters and following the shape of an ellipsoid in revolution, as sketched in a vertical cut in Fig. 5, turns out fundamental to correctly fit the distribution for most of the observed optical properties in this GH iiR. On the other hand, a thick-shell geometry in a sphere appears naturally when a single 3D model projected in two dimensions is considered instead.
The relative distance between the three main stellar clusters in NGC 588 reported by Jamet et al. (2005) results in a much lower distance between them and the outer radius of the gas-shell, thus, minimising the effects of the spatial distribution of the stars. According to Ercolano et al. (2009), this distribution can have non-negligible effects on the ionisation and thermal structure of the gas. Although the SED is dominated by a few massive stars located close to each other in this nebula, the distribution of the three observed clusters can be relevant for the properties of the that ate gas closer to the stars in the RB thick shell approach, but no direct isolated observations of the gas in these positions is available for such an analysis.
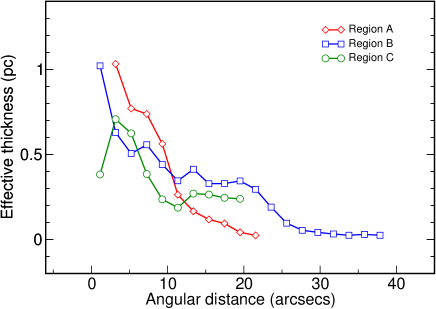
While we fixed the filling factor to match the observed size of NGC 588 in the thick-shell approach, all the models for the different positions of the thin-shell were calculated by using the filling factor and the outer radius of the shell as free parameters, among others, in each one of the modelled annuli. The resulting models present a degeneracy in these two parameters to study them consistently, and to establish comparisons between the different thickness in each annulus, it is necessary to define the effective thickness as
| (4) |
where is the filling factor, is the volume of the shell, which depends on both the inner and the outer radii, and , and is the outer surface of the shell. In Fig. 7, the resulting effective thickness is shown for the three defined regions above as a function of the distance between the ionising source and the inner face of the shell. The effective thickness is larger in the inner annuli of regions A and B, and it then decreases for the outer annuli, while the thickness is more irregular in region C. This thickness variation is required by the models to explain the observed shape of the H surface brightness.
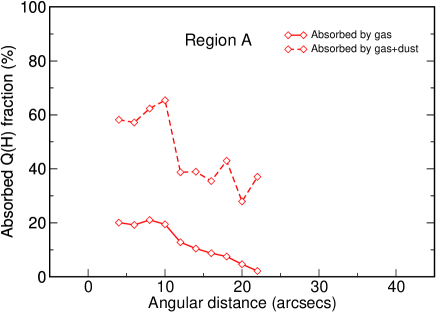
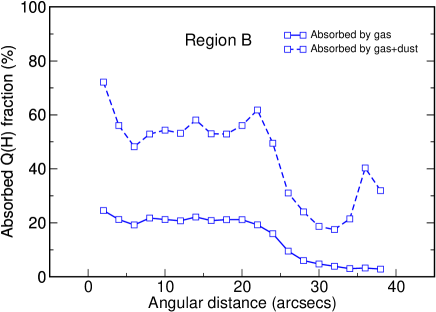
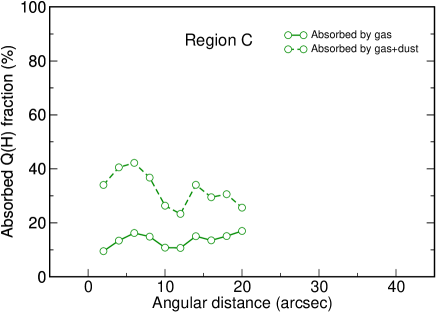
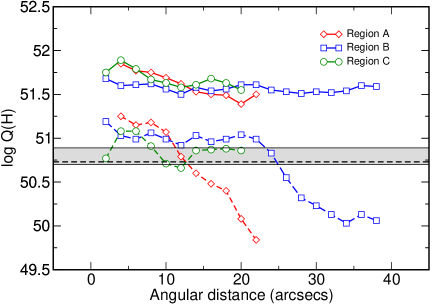
As a consequence of the resulting MB geometry for this solution in all annuli, a fraction of hydrogen ionising photons, , escape from the gas envelope. In Fig. 8, the predicted fraction of absorbed photons from only gas (in solid line) and from both the gas and the dust (in dashed line) for each one of the three regions as a function of the distance to the ionising source is shown. As can be seen, according to these models, the fraction of photons absorbed by the gas is larger in the inner annuli of regions A and B, where the effective thickness is larger, with values around 25% and down to only 4% in the outer annuli of these regions. In contrast, this fraction is keept around 20% in region C but with great fluctuations due to the variations in the effective thickness. Taking the fraction of the photons absorbed by the dust into account, we can calculate the fraction of photons escaping from the nebula. The fraction of these escaping photons changes from around 20% in the inner annuli of regions A and B and up to 70% in the outer annuli. For region C, this fraction oscillates between 30% and 60%. Using a surface-weighted mean, we estimate the mean fraction of hydrogen ionising photons absorbed by the gas (10 %) and those escaping from the nebula (60%). Taking these factors into account, the number of ionising photons absorbed by the gas in these models is log Q(H) = 50.70 which agrees with the total H luminosity measured by Relaño & Kennicutt (2009) for this GH iiR. The total number of ionising photons and the fraction of them that is absorbed by the gas is plotted for each model under this assumption in Fig. 9. In contrast, the number of ionising photons in the thick-shell approach is totally absorbed by gas and dust, and no photon-leakage is predicted, therefore agreeing with the measured H luminosity in this GH iiR.
4.2 Functional parameters
According to the more classical vision in the study of H ii regions, there are three so-called functional parameters, which control the ionisation and thermal inner structure of the gas (e.g., McGaugh 1991, Pérez-Montero & Díaz 2005): the metallicity (), the ionisation parameter (), and the equivalent effective temperature (). As shown above, the relative geometry among the gas, the dust, the stars, and other important parameters, such as the dust-to-gas ratio, also have very important roles that become evident with the study of the spatial distribution of the observed properties. Nevertheless, the study of the three classical functional parameters is still fundamental for the global understanding of the physical processes governing the interplay between gas, dust and radiation in ionised gaseous nebulae.
Although in MI11, for instance, a guess about the behaviour of some of these parameters, as derived from the variation of the relative intensity of the brightest optical emission-lines in NGC 588 is proved ; all the used strong-line methods are based on calibrations of integrated observations or models, and a poor knowledge about their behaviour in spatially resolved regions is attained. Therefore, a thorough check of the main strong-line methods in this context by means of tailor-made models is compulsory to confirm the conclusions obtained in MI11 and to explore the validity of these methods for spatially-resolved GH ii Rs.
4.2.1 Metal content of the gas
The amount of chemical species that are heavier than helium in the gas-phase is one of the factors that most affects the cooling rate of the gas and thus the emissivity of the optical emission-lines. At present, in the case of NGC 588, there is no observational evidence of any chemical inhomogeneity. Our models support this result since the radial profiles of all optical emission-lines obtained using IFU PMAS are reproduced under two different adopted geometries. The uniform oxygen abundance considered in the models [12+log(O/H) = 8.16 (thin-shell), 8.30 (thick-shell)] agrees with the values derived by different authors (Vílchez et al. 1988, Jamet et al. 2005) by means of collisional emission-lines and an estimate of the electron temperature from auroral-to-nebular appropriate emission-line ratios. Nevertheless, it has been found by Jamet et al. (2005) that a non-negligible disagreement between the [O iii] electron temperature derived from the integrated ratio of [O iii] 5007 Å and 4363 Å in the optical and the ratio between 5007 Å and the IR emission-line at 88 m, which has been taken from ISO observations, is about 3 000 K lower. However, despite that a realistic SED was not used, we do not find any difference between the electron temperature derived from [O iii] optical and mid-IR emission lines in our models. This result agrees with those from one-dimensional tailor-made models for the same H ii region made by Jamet et al. (2005) who varies their assumptions on the geometry, density, and adopted SED.
Strong-line methods used to derive (e.g., R23, O3N2, and N2), all present variations across the nebula that can be explained without resorting to chemical inhomogeneities. According to Pérez-Montero & Díaz (2005), most of them have non-negligible dependences on the other functional parameters. As shown in the upper left panel of Fig. 3, the case of R23 remains nearly uniform in the inner annuli of region B, and all region C. As was already pointed out by MI11, R23 in this GH ii R is at the value of the so-called turnover region (i.e., when R23 has a maximum value, and both upper- and lower-branch calibrations join (e.g., McGaugh 1991)). This means that this parameter cannot be used to find out metallicities within the range 8.0 - 8.4. In addition, the R23 parameter reaches values even higher than the maximum obtained for different sequences of photoionisation models and compilations of integrated observations in the outer annuli of regions A and B. According to some authors (e.g., Dopita & Sutherland 1996), the very high fluxes of [O ii] and [O iii] relative to H can be caused by the presence of high-velocity gas shocks. To study the possible presence of shocks, we looked for them by two means: i) we searched for emission of the good shock tracer [O i] 6300 Å, which is indicative of shocks (e.g. Dopita & Sutherland 1996). At the distance of M33 and at the spectral resolution of the IFU data, it was not possible to properly deblend the emission of the [O i] 6300 Å sky line from a putative emission from NGC 588. Therefore, this search relies on a good background subtraction. The only part of our field of view where this could be done was in the lower left tile, since it simultaneously samples the edge of the GH iiR and the emission from the rest of M33. We coadded the emission that corresponds to several spaxels of the region and to the background in this tile and subtracted them. The search for the line was unsuccessful: ii) we looked for spaxels with line widths typical for those found in shocks ( 100 km s-1). No spaxels with line widths larger than the instrumental one (i.e., km s-1) were detected. Therefore, no observational evidences support an important role of shocks in this region. The very high values of R23 could only be reproduced in the thin-shell approach without considering either chemical inhomogeneities or high-velocity gas-shocks and by only assuming changes in the geometry and the dust-to-gas ratio in the observed regions.
Other strong-line methods to derive are based on [N ii] emission lines, as it is the case of N2 and O3N2. The radial profiles of these two parameters can be seen in left and right middle panels of Fig. 3, respectively. They both present a large variation from the inner to the outer annuli in the three regions. According to Pérez-Montero & Contini (2009), all strong-line estimators of the metallicity based on [N ii] emission lines have a non-negligible dependence of the nitrogen-to-oxygen ratio (N/O). However, as in the case of , all our models correctly reproduce the inner variations of all quantities involving [N ii] emission-lines by assuming a uniform value for N/O. Therefore, the variations of N2 and O3N2, can only be explained by invoking geometrical effects, which also lead to variations in the ionisation parameter. Indeed, the two strong-line methods used to derive N/O, N2O2 and N2S2, which do not depend on log ), do not present large variations, as can be seen in the left and right lower panels of Fig. 3, respectively.
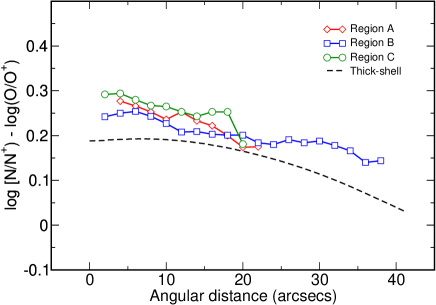
The N/O value derived from thin-shell models is 0.15 dex larger than the value reported by Jamet et al. (2005) [log(N/O) = -1.39 0.09]. In contrast, this value agrees with the value obtained from the thick-shell model. The cause of this disagreement for the N/O abundance ratio can be sought in the corresponding ionisation correction factor (ICF) for nitrogen. The most widely used expression for this ICF is based on the assumption: N/O N+/O+, which leads to
| (5) |
This expression is supported by sequences of photoionisation RB models at different N/O ratios by Pérez-Montero & Contini (2009). Nevertheless, as can be seen in Fig. 10, there is an offset of 0.2 dex on average for all the annuli of the three studied regions in NGC 588, which gives place to the larger total N/O ratio in the thin-shell model relative to the classical approximation. This can be due to the cut in the ionisation structure in several MB gas configurations and, thus, vary the usual expressions for ICF that are considered in models of a less complex geometry. In the thick-shell model, N/N+ is 0.1 dex higher than O/O+ on average.
In both models, the derived total nitrogen abundance [12+log(N/H) = 6.9] is consistent with the nitrogen abundance that corresponds to the galactocentric distance of this H ii region (5.6 kpc), which is 7.0 0.2, according to Eq. 5 in Magrini et al. (2007).
4.2.2 Ionisation parameter
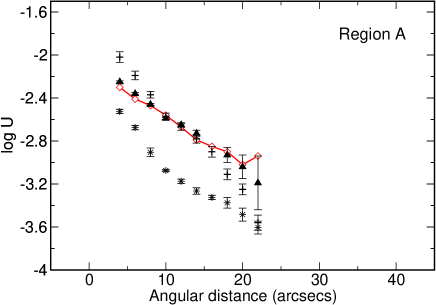
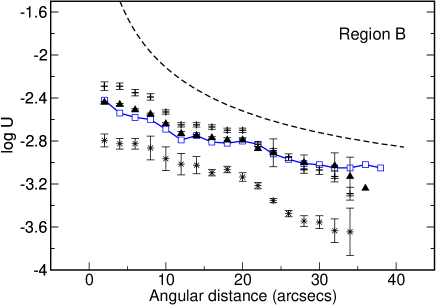
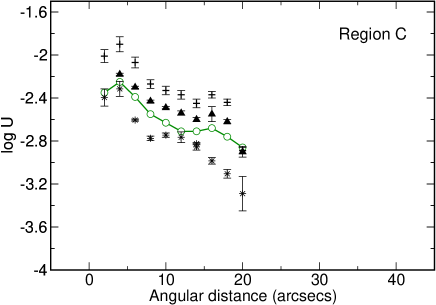
Most of the observed radial profiles in the relative intensities of the strong emission-lines are associated with an expected variation of across the nebula that are already pointed out by MI11. In Fig. 11, we show from top to bottom for the three defined regions the derived from the models (average value for thin-shell models and projected U() in the thick-shell). As can be seen, the maximum value in all approaches, is reached in the innermost annuli of the three regions and this value decreases with the distance to the ionising source by reaching the lowest values in the outermost annuli of region B. The cause for this radial decrease is different depending on the assumed geometry in the models. In the RB thick-shell approach, this decrease is mostly owing to the larger distance from the inner shell of the corresponding annuli to the ionising source, while this log decrease is also due to the variation of the thickness and dust-to-gas ratio across the shell in the MB thin-shell approach .
The predicted variation of log in the different model approaches gives us the possibility to compare it with the values obtained from different observed strong-line ratios and to test the extent of these ratios which are defined for RB geometries of integrated observations, in this context. The resulting obtained from the expressions, as proposed by Díaz et al. (2000), uses three different emission line ratios: [O iii]/[O ii], [S ii]/H, and [O ii]/H , which are also shown in Fig. 11. In the case of the latter two, the used expressions have a dependence on metallicity, which we fixed at Z=0.3Z⊙. As can be seen, all three indicators for the three regions lead to a radial decrease of in the same way of the models. The agreement between the derived from the models and the observational radial profiles derived from the three strong-line calibrators is good, although it is noticeably better in the case of [O iii]/[O ii] and [O ii]/H , as compared to [S ii]/H, which gives lower values of . This disagreement, which is less significant in the innermost annuli of region C, cannot be related in principle to the change in the effective thickness of the shell, as the offset is approximately the same for all the annuli of the regions. The disagreement is probably not due to the dependence of the derived from [S ii]/H on , as this disagreement is not observed for [O ii]/H, which also gives an estimate of with an additional dependence on . As already pointed out by MI11, this could be the consequence of a non-negligible contribution to the [S ii] emission-line flux of the diffuse gas above the GH iiR (see Fig. 11 in MI11).
In contrast, the projected U() derived from thick-shell models and shown in the middle panel of Fig. 11 gives values much higher than those obtained from both thin-shell models and emission-line ratios, possibly owing to the fact that in each point the ionisation structure is not completely covered in this spherical RB approach.
The variation across the nebula also illustrates the importance of the contribution of the regions of low surface brightness to the integrated properties, as already shown by MI11, for which little variations in the slit width or position can lead to significant differences in the integrated derived properties of the nebula.
4.2.3 Equivalent effective temperature
The equivalent effective temperature depends above all on the shape of the SED of the ionising source. This can be characterised, for instance, with the ratio of hydrogen-to-helium ionising photons. In all the models used to reproduce NGC 588, a single ionising source of = 41 000 K was used by adopting the conclusions from the star-by-star analysis made by Jamet et al. (2004), and was kept unchanged across all the modelled annuli. Therefore, for this case, it is important to study to what extent the calibrators based on strong-emission lines in the optical spectrum can modify the estimation of , as a consequence of the spatial variations across the three defined regions.
According to Vílchez & Pagel (1988), the parameter can be used to find the radiation hardness. This parameter depends on the relative ionic abundances of several species whose brightest emission lines can be observed in the optical and near-IR spectrum (i.e. O+, O2+, S+, and S2+). The equivalent to the parameter, which based only on relative emission-lines if no estimate of the electron temperature is available, can be expressed as
| (6) |
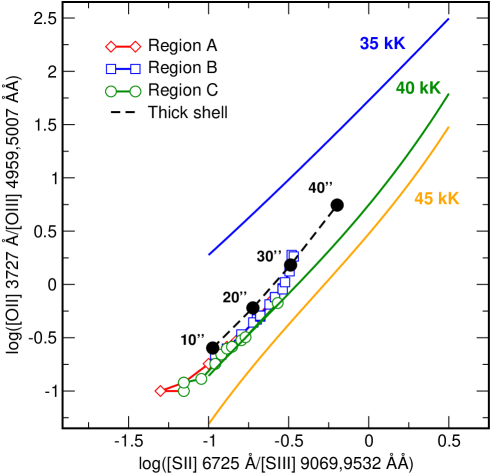
although this emission-line ratio has also an additional dependence on (Morisset, 2004). A study of the spatial variation of this parameter can be carried out from the results of the models. Unfortunately, no spatially resolved measurements of the [S iii] emission line exists. As in the case of the models made for NGC 595 (Pérez-Montero et al., 2011a) the parameter is not uniform across the nebula in NGC 588, according to models. However, this does not mean that the estimated from this method gives a non-uniform estimate of . As already shown by Pérez-Montero et al. (2011b), the fits to the grids of photoionisation models with the same in the [O ii]/[O iii],[S ii]/[S iii] plane have slopes higher than 1. Therefore, an estimation of cannot be given only in terms of but also by means of a direct comparison of the two involved ratios and the appropriate sequences of models. This plot is shown in Fig.12, where the results of the tailored models described in this work are compared with the fits to sequences of single-star models with different values and the same metallicity as NGC 588. As can be seen, as in the case of NGC 595 (Pérez-Montero et al., 2011b), the models predict that it is possible to measure a uniform value for for all the spatial elements, as they are ionised by the same ionising source, which are independent of the spatial variations of other physical properties in those regions. This result is found for the two geometrical assumptions considered in the models. According to models and lacking of an observational confirmation in this case, we can thus conclude that despite the log variations and the assumption of different geometries. The estimation from the method is robust even when different spatial elements in an Hii regions are used. However, the absolute scale of this diagnostic must be taken with care, as already shown by Morisset (2004) and Pérez-Montero & Vílchez (2009). In this case, the scale is slightly lower than the adopted value for the SED in these models, which is at 41 000 K.
4.3 Dust-to-gas ratio and IR emission
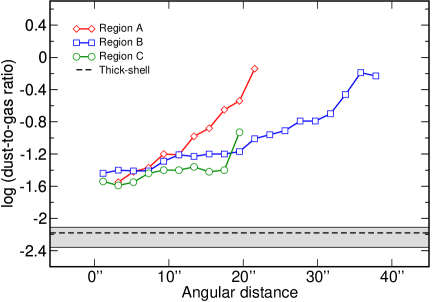
The dust-to-gas mass ratio is a key parameter in ionised gaseous nebulae because the relative abundance of dust affects the thermal equilibrium of the gas. Unlike the thick-shell approach, where a constant value of the dust-to-gas mass ratio, agrees with the value derived from mid-IR observations, is used to match the observations, in the thin-shell approach the dust-to-gas ratio is introduced as a free parameter. As shown in Fig. 13, this ratio has to increase radially in the models of the three studied regions of the shell to correctly reproduce the observed optical emission-line ratios, as is the case for high relative intensity of [O ii] and [O iii]. Even in the parts of the shell that are closer to the ionising source, where a lower dust-to-gas ratio is required, the obtained values are sensibly higher than the dust-to-gas ratio derived from the integrated observations. The enhancement of the dust-to-gas ratio combined with the decrease of the effective thickness for the outer annuli of the thin-shell have a consequence: the models under this geometry do not either reproduce the radial profile of the Spitzer 8 m-to-24 m ratio in the outer spatial positions, as shown in Fig. 4. The radial profiles of the surface brightness at 8 m and 24 m are well traced by these models as fruit of the geometrical dilution, but the required enhancement of the dust-to-gas ratio in the outer annuli of the thin-shell models makes the ratio decrease in the outer parts. The reason is that the main emitters at 24m are the smallest and hottest dust grains mixed with the ionised gas.
In contrast, the increase in the 8 m/24 m ratio in the thick-shell model is reproduced with a constant dust-to-gas ratio due to the radial decrease of the dust temperature. While the dust is hot and the emission at 24 m is high in the innermost parts, this dust is cooler, and the ratio is dominated by the free-free emission at 8 m in the outer parts according to the models.
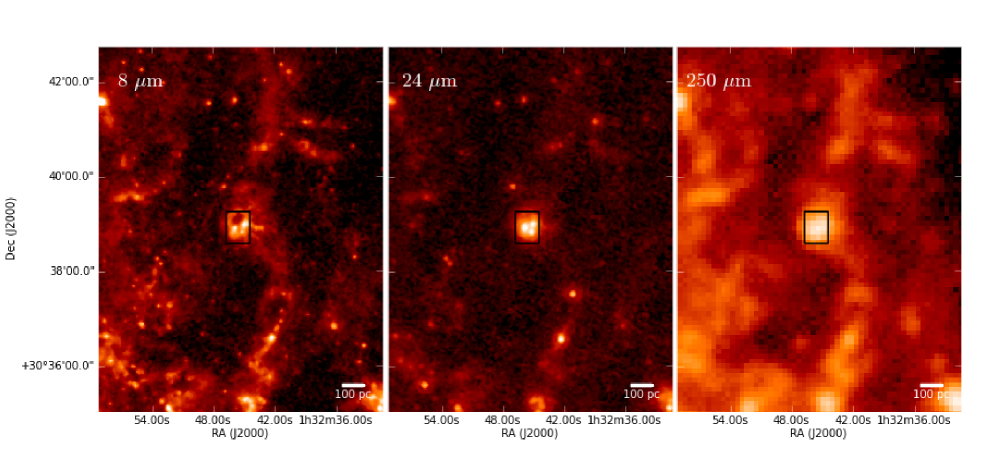
Nevertheless, a much larger optical extinction is derived from the Balmer decrement by MI11, which would be indicative of different spatial positions for gas and dust. Other IR sources could be the cause of the high values of this ratio in the outer parts of this GH iiR and of the disagreement between optical and IR extinction. In Fig. 14, we show the area around the region of NGC 588 observed with PMAS, as seen by Spitzer in 8 m and 24 m and by the Herschel telescope in 250 m broadband. As can be seen, the 8 m emission of the dust around the H ii region is notably larger than in 24 m. This emission, which probably comes from a cloud of diffuse dust above the plane of the galaxy, is confirmed by inspecting the 250 m image, where traces of dust appear at positions that are not associated with the H ii region. This diffuse emission can thus contribute to the 8m emission at the location of NGC 588 coming mainly from PAHs.
Regarding visual extinction, no clear spatial trend within the errors is found from the Balmer decrement. This is also found in both geometrical approaches. In the thin-shell models, the decrease in the effective thickness makes the extinction similar in all annuli although dust-to-gas ratio increases with distance.
5 Summary and conclusions
The two-dimensional optical and mid-IR spatial structure of the GH iiR NGC 588 in the disc of M33 was studied by means of one-dimensional tailor-made photoionisation models. This object constitutes an appropriate target to study the spatial interplay between gas, dust, and stars and, thus, to explore the validity of different methods used for integrated observations because it is very well characterised in observations at several bands.
The observational source for this study was the work made by MI11, who describe PMAS - CAHA 3.5 m optical IFU observations and compare them with Spitzer 8 m and 24 m mid-IR images. For this work, we also used Spitzer integrated data at 70 m and 160 m to derive the dust-to-gas ratio and Herschel 250 m to study the presence of diffuse dust in positions outside the GH iiR.
To analyse the spatial variation of the observed main emission-line ratios and the IR emission, we followed the same procedure as Pérez-Montero et al. (2011a) for NGC 595 in which elliptical annuli were defined around the emission-peak. Although NGC 588 presents a ring-like morphology as seen in the H image, it does not have the same axial symmetry as NGC 595, so different regions were defined to reproduce the different observed patterns. Then, the emission in the three defined regions was co-added at different angular distances to the ionising clusters. Finally, the resulting radial profiles for H surface brightness and the emission-line ratios of [O ii]/H, [O iii]/H, [N ii]/H, and [S ii]/H were taken to constrain the models that were made for the different annuli in the three regions.
We adopted two different model strategies to find out the nature of the observed spatial variations across the field of view in this GHiiR. On one hand, we considered each spatial element as having a complete ionisation structure that could be modelled independently. This model strategy is an improved version of the methodology described in Pérez-Montero et al. (2011a) for NGC 595 and accounts above all for azimuthal spatial variations of both the observed and the derived properties in two dimensions. The resulting geometry in these models consists of a hollow ellipsoid of revolution, whose MB thin-shell has most of the emission of the GH iiR. In this geometry, the optical emission is fitted by assuming a decreasing thickness and an increasing dust-to-gas ratio where most of the ionising photons are absorbed by dust and an additional fraction leaks from the nebula.
On the other hand, we considered that the 2D observed properties of the nebula are due to the projection of a sphere onto the sky. This was modelled in a single photoionisation model using the pyCloudy code (Morisset, 2006). The resulting geometry in this model consists of a RB spherical thick-shell with decreasing particle density.
In both approaches, both the H surface brightness and the main optical emission-line ratios were reproduced. The models also reproduce the radial variation of the Spitzer emission bands at 8 m and 24 m. However, the ratio between them is underestimated in the outer annuli in the thin-shell geometry due to the enhancement of the dust-to-gas ratio, which makes the emission at 24m to increase there. On the contrary, this ratio is well reproduced by the thick-shell model. We thus conclude that both projection and azimuthal spatial variations are possibly present in the properties of the gas and the dust in NGC 588. However, as the thick-shell approximation achieves a better fit to the mid-IR observations, the projection effects dominate over the azimuthal ones. This also shows the importance of fitting both optical and mid-IR spatial properties to better understand the spatial distribution of the region.
A single-star SED, which is equivalent to the observed stellar clusters as demonstrated by Jamet et al. (2004), was used in the models. This does not allow a detailed study of the inner ionisation structure in the GH iiR. However, the oxygen gas-phase abundance derived by the models [12+log(O/H) = 8.16, thin-shell, 8.3, thick-shell] for both assumptions is uniform across the nebula and agrees with the values measured by several authors (Vílchez et al. 1988, Jamet et al. 2005), who use the electron temperature based on optical collisionally excited emission lines. The conclusions are made by MI11. Under the assumption of a chemical homogeneity, we reproduced the very high values of R23 in the outer annuli of regions A and B only in the thin-shell models without considering high-velocity gas-shocks. Therefore, contrary to the rest of the nebula, azimuthal spatial variations of the geometry and dust-to-gas ratio are possibly behind the behaviour of these lines at these distances. According to both models, the estimation of from the parameter is quite uniform across the nebula despite the high variation of several emission-line ratios involving both high- and low-excitation emission lines. This indicates that this method is very robust and independent of the assumed geometry of the models. However, this result needs to be confirmed with more observations of the spatial distribution of this parameter.
The MB thin-shell models fit the optical observables by assuming an increasing dust-to-gas ratio, which go up to much higher values than that derived for the integrated nebula from IR emission at different bands. This estimation points to a value close to the standard Galactic value and was obtained empirically from the total dust mass, as found using the dust temperature derived from the ratio between 70 m and 160 m, and the total Hi mass. This value is consistent with the dust-to-gas ratio assumed in the thick-shell approach. However, the extinction value derived from this assumption is much lower than the estimates from the optical Balmer decrement from different authors. The 8 m image around the area of the GH iiR shows structures of the dust, which are not associated with the H ii region and which are confirmed with the Herschel image at 250 m. The presence of a cloud of diffuse gas and dust above the plane of the galaxy at the same position of NGC 588 could also explain the high values of the 8m/24m ratio.
Acknowledgements
This work has been partially supported by projects AYA2007-67965-C03-02, AYA2007-67625-C02-02, and AYA2010-21887-C04-01 of the Spanish National Plan for Astronomy and Astrophysics, and by the project TIC114 Galaxias y Cosmología of the Junta de Andalucía (Spain). This research was also supported by a Marie Curie Intra European Fellowship within the 7th European Community Framework Programme ERG: PERG08-GA2010-276813. CM acknowledges support from grant CONACyT CB2010/153985 (México).
We thank Simon Verley for providing us with the Spitzer images and for his help with their reduction and analysis. We are grateful to the Herschel Open Time Key Project HerM33es for the 250 m image used in this paper. We also thank an anonymous referee whose comments have largely helped to improve the final manuscript.
This paper uses the plotting package JMAPLOT developed by Jesús Maíz-Apellaniz (available at http://jmaiz.iaa.es/iWeb/Software.html).
References
- Alloin et al. (1979) Alloin, D., Collin-Souffrin, S., Joly, M., & Vigroux, L. 1979, A&A, 78, 200
- Asplund et al. (2009) Asplund, M., Grevesse, N., Sauval, A. J., & Scott, P. 2009, ARA&A, 47, 481
- Bendo et al. (2008) Bendo, G. J., Draine, B. T., Engelbracht, C. W., et al. 2008, MNRAS, 389, 629
- Bluhm et al. (2003) Bluhm, H., de Boer, K. S., Marggraf, O., Richter, P., & Wakker, B. P. 2003, A&A, 398, 983
- Calzetti et al. (2007) Calzetti, D., Kennicutt, R. C., Engelbracht, C. W., et al. 2007, ApJ, 666, 870
- Castellanos et al. (2002) Castellanos, M., Díaz, Á. I., & Tenorio-Tagle, G. 2002, ApJ, 565, L79
- Cerviño et al. (2003) Cerviño, M., Luridiana, V., Pérez, E., Vílchez, J. M., & Valls-Gabaud, D. 2003, A&A, 407, 177
- Díaz et al. (2000) Díaz, A. I., Castellanos, M., Terlevich, E., & Luisa García-Vargas, M. 2000, MNRAS, 318, 462
- Dopita & Sutherland (1996) Dopita, M. A. & Sutherland, R. S. 1996, ApJS, 102, 161
- Draine & Lee (1984) Draine, B. T. & Lee, H. M. 1984, ApJ, 285, 89
- Ercolano et al. (2009) Ercolano, B., Bastian, N., & Stasińska, G. 2009, Ap&SS, 324, 199
- Fazio et al. (2004) Fazio, G. G., Hora, J. L., Allen, L. E., et al. 2004, ApJS, 154, 10
- Ferland et al. (1998) Ferland, G. J., Korista, K. T., Verner, D. A., et al. 1998, PASP, 110, 761
- Freedman et al. (1991) Freedman, W. L., Wilson, C. D., & Madore, B. F. 1991, ApJ, 372, 455
- Giammanco et al. (2004) Giammanco, C., Beckman, J. E., Zurita, A., & Relaño, M. 2004, A&A, 424, 877
- Gratier et al. (2010) Gratier, P., Braine, J., Rodriguez-Fernandez, N. J., et al. 2010, A&A, 522, A3+
- Helou et al. (2004) Helou, G., Roussel, H., Appleton, P., et al. 2004, ApJS, 154, 253
- Jamet & Morisset (2008) Jamet, L. & Morisset, C. 2008, A&A, 482, 209
- Jamet et al. (2004) Jamet, L., Pérez, E., Cerviño, M., et al. 2004, A&A, 426, 399
- Jamet et al. (2005) Jamet, L., Stasińska, G., Pérez, E., González Delgado, R. M., & Vílchez, J. M. 2005, A&A, 444, 723
- Kramer et al. (2010) Kramer, C., Buchbender, C., Xilouris, E. M., et al. 2010, A&A, 518, L67
- Leitherer et al. (1999) Leitherer, C., Schaerer, D., Goldader, J. D., et al. 1999, ApJS, 123, 3
- Lisenfeld et al. (2002) Lisenfeld, U., Israel, F. P., Stil, J. M., & Sievers, A. 2002, A&A, 382, 860
- Magrini et al. (2007) Magrini, L., Vílchez, J. M., Mampaso, A., Corradi, R. L. M., & Leisy, P. 2007, A&A, 470, 865
- Markwardt (2009) Markwardt, C. B. 2009, in Astronomical Society of the Pacific Conference Series, Vol. 411, Astronomical Data Analysis Software and Systems XVIII, ed. D. A. Bohlender, D. Durand, & P. Dowler, 251
- Mathis et al. (1977) Mathis, J. S., Rumpl, W., & Nordsieck, K. H. 1977, ApJ, 217, 425
- McGaugh (1991) McGaugh, S. S. 1991, ApJ, 380, 140
- Melnick (1979) Melnick, J. 1979, ApJ, 228, 112
- Melnick et al. (1987) Melnick, J., Moles, M., Terlevich, R., & Garcia-Pelayo, J.-M. 1987, MNRAS, 226, 849
- Monreal-Ibero et al. (2011) Monreal-Ibero, A., Relaño, M., Kehrig, C., et al. 2011, MNRAS, 413, 2242
- Morisset (2004) Morisset, C. 2004, ApJ, 601, 858
- Morisset (2006) Morisset, C. 2006, in IAU Symposium, Vol. 234, Planetary Nebulae in our Galaxy and Beyond, ed. M. J. Barlow & R. H. Méndez, 467–468
- Morisset et al. (2005) Morisset, C., Stasińska, G., & Peña, M. 2005, MNRAS, 360, 499
- Muñoz-Tuñón et al. (1996) Muñoz-Tuñón, C., Tenorio-Tagle, G., Castaneda, H. O., & Terlevich, R. 1996, AJ, 112, 1636
- Pagel et al. (1979) Pagel, B. E. J., Edmunds, M. G., Blackwell, D. E., Chun, M. S., & Smith, G. 1979, MNRAS, 189, 95
- Pauldrach et al. (2001) Pauldrach, A. W. A., Hoffmann, T. L., & Lennon, M. 2001, A&A, 375, 161
- Pérez-Montero & Contini (2009) Pérez-Montero, E. & Contini, T. 2009, MNRAS, 398, 949
- Pérez-Montero & Díaz (2003) Pérez-Montero, E. & Díaz, A. I. 2003, MNRAS, 346, 105
- Pérez-Montero & Díaz (2005) Pérez-Montero, E. & Díaz, A. I. 2005, MNRAS, 361, 1063
- Pérez-Montero et al. (2011a) Pérez-Montero, E., Relaño, M., Vílchez, J. M., & Monreal-Ibero, A. 2011a, MNRAS, 412, 675
- Pérez-Montero & Vílchez (2009) Pérez-Montero, E. & Vílchez, J. M. 2009, MNRAS, 400, 1721
- Pérez-Montero et al. (2011b) Pérez-Montero, E., Vílchez, J. M., Relaño, M., & Monreal-Ibero, A. 2011b, in Stellar Clusters & Associations: A RIA Workshop on Gaia, 225–228
- Relaño et al. (2010) Relaño, M., Monreal-Ibero, A., Vílchez, J. M., & Kennicutt, R. C. 2010, MNRAS, 402, 1635
- Relaño & Kennicutt (2009) Relaño, M. & Kennicutt, R. C. 2009, ApJ, 699, 1125
- Rieke et al. (2004) Rieke, G. H., Young, E. T., Engelbracht, C. W., et al. 2004, ApJS, 154, 25
- Rosolowsky & Simon (2008) Rosolowsky, E. & Simon, J. D. 2008, ApJ, 675, 1213
- Roth et al. (2010) Roth, M. M., Fechner, T., Wolter, D., et al. 2010, in Society of Photo-Optical Instrumentation Engineers (SPIE) Conference Series, Vol. 7742, Society of Photo-Optical Instrumentation Engineers (SPIE) Conference Series
- Roth et al. (2005) Roth, M. M., Kelz, A., Fechner, T., et al. 2005, PASP, 117, 620
- Rubin et al. (2008) Rubin, R. H., Simpson, J. P., Colgan, S. W. J., et al. 2008, MNRAS, 387, 45
- Storchi-Bergmann et al. (1998) Storchi-Bergmann, T., Schmitt, H. R., Calzetti, D., & Kinney, A. L. 1998, AJ, 115, 909
- Tabatabaei et al. (2007) Tabatabaei, F. S., Beck, R., Krügel, E., et al. 2007, A&A, 475, 133
- van den Bergh (2000) van den Bergh, S. 2000, The Galaxies of the Local Group (Cambridge)
- Verley et al. (2007) Verley, S., Hunt, L. K., Corbelli, E., & Giovanardi, C. 2007, A&A, 476, 1161
- Verley et al. (2007) Verley, S., Hunt, L. K., Corbelli, E., et al. 2007, A&A, 476, 1161
- Verley et al. (2010) Verley, S., Relaño, M., Kramer, C., et al. 2010, A&A, 518, L68
- Viallefond & Goss (1986) Viallefond, F. & Goss, W. M. 1986, A&A, 154, 357
- Vílchez & Pagel (1988) Vílchez, J. M. & Pagel, B. E. J. 1988, MNRAS, 231, 257
- Vílchez et al. (1988) Vílchez, J. M., Pagel, B. E. J., Diaz, A. I., Terlevich, E., & Edmunds, M. G. 1988, MNRAS, 235, 633
- Xilouris et al. (2012) Xilouris, E. M., Tabatabaei, F. S., Boquien, M., et al. 2012, A&A, 543, A74