Low temperature heat capacity of a severely deformed metallic glass
Abstract
The low temperature heat capacity of amorphous materials reveals a
low-frequency enhancement (boson peak) of the vibrational
density of states, as compared with the Debye law. By measuring the
low-temperature heat capacity of a Zr-based bulk metallic glass
relative to a crystalline reference state, we show that the heat
capacity of the glass is strongly enhanced after severe plastic
deformation by high-pressure torsion, while subsequent thermal
annealing at elevated temperatures leads to a significant
reduction. The detailed analysis of corresponding molecular dynamics
simulations of an amorphous Zr-Cu glass shows that the change in
heat capacity is primarily due to enhanced low-frequency modes
within the shear band region.
Published in:
J. Bünz et al.,
Phys. Rev. Lett. 112, 135501 (2014)
DOI: 10.1103/PhysRevLett.112.135501
© 2014 American Physical Society.
Metallic glasses show mechanical, electrical, and magnetical properties, which can be very distinct from the properties of their crystalline counterparts Wang et al. (2004). One characteristic feature of glassy materials is a low-frequency enhancement of the vibrational density of states as compared with the Debye law. This excess contribution with respect to crystalline systems is commonly referred to as the boson peak. The boson peak is situated in the terahertz region of the vibrational spectrum and hence also influences the low temperature heat capacity. After several decades of controversy, it is now quite accepted that the boson peak is due to quasi-localized transverse vibrational modes associated with “defective” soft local structures in the glass Shintani and Tanaka (2008); Schober (2011); Schober and Laird (1991); Laird and Schober (1991); Derlet et al. (2012). The enhancement of the local vibrational density of states (often referred to as “soft modes”) leads to additional scattering of phonons. The resulting contribution to the heat capacity in excess of the Debye -law becomes visible as a peak, if is plotted in the temperature range of to Angell (1995). The boson peak is a general feature of glasses, irrespective of the dominant type of the interatomic or intermolecular binding energy and is thus also observed in metallic glasses. Although there is agreement concerning the connection between the phonon spectrum of glasses and the peculiarities of parts of the spectrum related to the boson-peak anomalies, the atomistic description of any structural origin of the low-frequency excited states remains unclear despite of numerous experimental and theoretical investigations. These excited states are described in terms of soft harmonic potentials Karpov et al. (1983); Gil et al. (1993), fluctuating force or elastic constants Schirmacher and Wagener (1993); Schirmacher et al. (1998); Schirmacher (2006); Schirmacher et al. (2007); Ferrante et al. (2013), strings of atoms Schober and Oligschleger (1996), smeared out Van Hove singularities Taraskin et al. (2001); Chumakov et al. (2011), or interstitialcy-like “defects” Vasiliev et al. (2009). Even though the various models for describing the boson peak behavior differ in their specific assumptions and interpretations, they have in common that the glass state is described by spatially heterogeneously distributed regions having decreased elastic constants. These regions are distributed mesoscopically, i.e., on a scale of a few nanometers. In metallic glasses, rather localized and structurally disturbed regions occur upon application of external stress exceeding the elastic limit. These so-called shear bands have a typical thickness of the order of Wilde and Rösner (2011) and present the regions where plastic shear strain was localized and quasi-plastic straining occurred under the conditions of shear softening.
In order to analyze the contribution of shear bands to the low-temperature heat capacity, we performed measurements on a metallic glass that was subjected to severe torsional deformation under a high applied hydrostatic pressure Meng et al. (2012). In a previous investigation of that material, individual shear bands could not be identified after applying large strain to the sample Meng et al. (2012). Nonetheless, the sample exhibits regions with deformation-induced structural changes, that can be considered as “macroscopic shear bands”. Zr-based metallic glasses, especially the composition investigated here, show rather “strong” behavior concerning their fragility characteristics, which according to Ediger et al., should lead to a more pronounced boson-peak Ediger et al. (1996). The sample was forced to withstand catastrophic failure by crack formation despite the large strain via geometrical confinement. In consequence, the regions of strong deformation localization, i.e. the shear bands, experienced severe conditions and the number of such regions is maximized Meng et al. (2012).
Thus, this confined deformation up to severe strain values produces a specific state that is well-suited to distinguish the contributions of shear band and matrix regions outside the shear bands. To that end we performed molecular dynamics simulations of deformation of a metallic glass—a model system comparable to the Zr-Cu-Al glass—to differentiate the behavior of matrix and shear band regions in the glass.
Furthermore, we measured the response of the heat capacity at low temperatures upon the thermomechanical processing of the glass to gain more insights into the structural relaxation behavior of the deformed metallic glass.
The sample material was cast from ingots of pure metals to obtain an amorphous master ingot. We cut the master ingot into the specific dimensions for torsional deformation under an applied hydrostatic pressure (HPT). The HPT-discs had a diameter of , and a thickness of . We deformed the samples with an applied pressure of for 50 revolutions. Further information about the materials processing can be found in Ref. Meng et al., 2012.
The characteristic temperatures were measured by differential scanning calorimetry (DSC) experiments using a Perkin Elmer Diamond DSC. The experiments were performed with a constant heating rate of under a high purity argon flow of .
We take the glass transition temperature as the temperature where the increase of heat capacity during the glass transition amounts to half the value of the difference between the heat capacity of the liquid phase and the glass phase . We measured a glass transition temperature of and an onset of crystallization at . The undercooled liquid interval accessible to calorimetry measurements at this heating rate amounts to .
The amorphicity of the samples was checked at room temperature by X-ray diffraction (XRD) with a Siemens D5000 diffractometer. The samples, both deformed and as-cast, show identical broad diffraction maxima typical for the amorphous phase. There is no sign of partial crystallization, nor did the HPT deformation change the structure in a way detectable in XRD.
The heat capacity was measured under high vacuum conditions with a Quantum Design PPMS (Physical Property Measurement System), which allows cooling down to with a liquid helium system. The samples were polished for good thermal contact and cut into pieces, each with a mass of to . The samples were placed on top of a sapphire block of known heat capacity with a thermal grease to ensure good thermal contact. At each temperature, a known heat pulse is applied and sample and platform are heated to a temperature . After the end of the heat pulse, the sample temperature relaxes to the heat sink temperature according to
| (1) |
with the time constant Lashley et al. (2003). The factor is the thermal conductance between sample platform and heat sink. The heat capacity can now be measured by fitting the temperature decay with an accuracy better than 3%. Prior to the measurement of the samples, we measured and with an empty sapphire crystal with the applied grease for baseline correction.
Each heat capacity curve in this work includes three individual measurements at each temperature to ensure reproducibility. We chose the spacing between temperatures in a logarithmic way to preferentially sample the region of low temperature.
The annealing of the samples above was done in a TA Instruments Q500 DSC under constant argon flow of . Annealing at temperatures below and for long times was performed in a Thermometric TAM III microcalorimeter. Both methods allow to simultaneously measure the emitted heat flow to investigate relaxational events and exclude crystallization. For obtaining a crystalline reference of identical composition, we heated a Zr50Cu40Al10 sample up to , above the crystallization temperature.
Molecular dynamics (MD) computer simulations using the software lammps Plimpton (1995) were used for discriminating the matrix and shear band contributions to the heat capacity. For this purpose, we simulated a system using the Finnis-Sinclair type potential by Mendelev et al. Mendelev et al. (2009). A bulk metallic glass sample was prepared by quenching from the melt to with a cooling rate of . The simulation box consisting of 364500 atoms was generated by a replication of the quenched system. We induced shear band formation using a volume conserving pure shear deformation with a shear rate of up to a maximum shear of 20%. Additionally, we annealed the deformed sample at for and .
We used the von Mises local shear invariant Shimizu et al. (2007) as implemented by Ovito Stukowski (2010) as a criterion for distinguishing atoms: Atoms with were marked as belonging to the shear band or shear transformation zones (STZs), while all others were considered as matrix atoms.
As a first step to obtain heat capacity values, we calculated the phonon density of states (PDOS) from the Fourier-transform of the velocity autocorrelation function Dickey and Paskin (1969). This was done separately for the atoms in the shear band and in the matrix after unloading and equilibrating the system with a barostat at zero stress.
To calculate the corresponding heat capacities from the phonon density of states , we employed the harmonic approximation of the free energy Pathria (1996):
| (2) |
In this model we assume , which gives a reasonable approximation at low temperatures. As a reference, we also calculated heat capacities for the CuZr B2 crystal using the same method.
Note that the direct calculation of the specific heat from the time averaged inner energy given by the classical trajectories in MD simulations would yield unphysical values in the low temperature regime due to the missing quantum-statistical contributions.
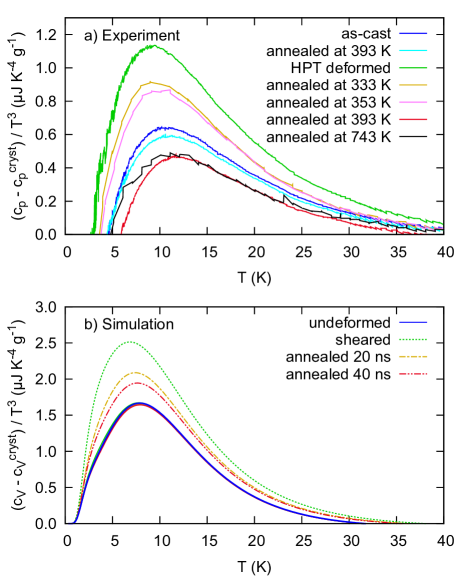
The experimentally measured heat capacity is plotted as versus in Fig. 1(a), making visible the contribution of the boson peak at low temperatures. The -curve of the crystalline Zr-Cu-Al sample is used as reference and therefore subtracted from the data of each amorphous sample. Since the crystalline sample shows no contribution to the boson peak but a comparable heat capacity from electronic and “lattice” contributions, the excess heat capacity plotted in Fig. 1(a) is solely due the boson peak.
The HPT-deformed glass shows an enhanced peak, whose height is almost twice as high compared to the as-cast state. The peak maximum of the deformed sample is slightly shifted by to lower temperatures.
We annealed the samples at different temperatures with simultaneous measurement of the relaxational heat flow in the microcalorimeter. After at most seven days the heat flow signal reached the background, indicating that the sample was close to an equilibrium state at that temperature. The undeformed sample shows a slight decrease of the boson peak after annealing at , while annealing at and lowers the boson peak of the deformed sample to an intermediate height between the deformed and the as-cast state. The deformation “defects” are not completely healed by the thermal treatment. Otherwise the sample that was annealed at shows a boson peak which is even lower than the boson peak of the as-cast sample or of the undeformed sample relaxed at . Additional DSC experiments were performed and did not show any evidence for partial crystallization during annealing. Furthermore, we heated a HPT-deformed sample to . The sample reaches internal equilibrium within the first of annealing and has a defined thermal history after cooling with . The boson peak has the same height as the one of the HPT-deformed samples which is in metastable equilibrium at . The undeformed sample, which was equilibrated at the same temperature, shows a higher boson peak.
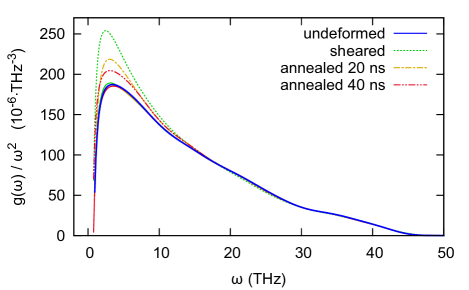
In Figure 2 the PDOS calculated by the computer simulation is shown. The data is split into contributions of the matrix (solid lines) and contributions of the shear band (dashed lines). The data is plotted for the as-quenched glass, the glass deformed to a shear of 20%, and the deformed sample annealed for and at . Most evidently, the vibrational spectrum of the matrix does not change between the undeformed, sheared, and annealed samples, whereas the spectrum of the shear band shows an increased boson peak which reduces again with annealing. Figure 1(b) shows the corresponding heat capacities calculated from the PDOS. As in the experiment—and as already suggested by the PDOS—the boson peak in the heat capacity increases after deformation and decreases again after annealing. The simulation overestimates the difference in heat capacity between crystal and glass but shows qualitatively the same features as the experiment. Due to the small timescale accessible by the simulation we don’t observe a complete recovery of the shear band in the deformed glass by thermal annealing.
However, the computer simulations clearly show that the shear band regions relax to a state of lower excess heat capacity, while the contribution of the matrix is not changing. The experimentally observed fact that the deformed sample shows a significantly reduced boson peak after thermal annealing at high temperature as compared to the as-cast case is indicative for a structural relaxation. Since the excess with respect to the crystalline reference is reduced, this suggests a relaxation towards a more crystal-like state within the shear band region. This interpretation is supported by recent results indicating the prevalence of shear bands for the formation of nanocrystals or crystal-like medium range order Wilde and Rösner (2011); Rösner et al. (2013). The enhanced atomic mobility within the shear bands Bokeloh et al. (2011) does also favor the relaxation of the modified glass structure towards a more ordered state.
The change of the boson peak with applied pressure can often be explained by mere changes of the elastic constants. In these cases the change of the peak height is accompanied by a shift of the boson-peak frequency. When plotting the data in units of the Debye frequency, the peaks are identical Schirmacher (2006); Chumakov et al. (2011). In our case the frequency of the boson peak, and therefore its position in the heat capacity plot, does not shift in either experiment or simulation. This indicates a real change of the disorder statistics, i.e., the distribution of local moduli, and not only a change of the global elasticity.
All in all, our findings clearly show that all changes of the specific heat induced by plastic deformation and annealing stem from the regions of strain localization. The matrix will stay relatively intact in the processes.
Both experimental and simulation data show that plastic deformation enhances the boson contribution to the heat capacity. Molecular dynamics simulations provide direct evidence that the additional contributions to the boson peak result from structures that are located in the shear bands, while the PDOS in the matrix stays unchanged with deformation and annealing. The experiment supports this perspective as the change of boson peak height of the undeformed samples during annealing is relatively small compared to the deformed samples.
It should be noted that in our current work the experimental conditions always lead to a strong strain localization. The analysis given here does not cover a more homogeneous deformation behavior, in which the matrix could also show a changed vibrational spectrum, if there is even a distinction between shear band and matrix. In this case an increase of the boson peak after deformation may be observed over the whole system.
Several studies show that shear bands can heal during annealing even at temperatures well below Jiang et al. (2005); Xie and George (2008); Ritter and Albe (2011). In contrast, our findings indicate that the shear band structure after annealing differs from an annealed, undeformed glass. Diffusion studies demonstrate accelerated diffusion Bokeloh et al. (2011) and excess free volume Kanungo et al. (2004) inside of shear bands. This could promote structural relaxation and short to medium range ordering that drives the system to another meta-basin in the energy landscape Heuer (2008). This meta-basin would exhibit different structural properties: The decrease of the boson peak below the values of the undeformed glass in that case suggests an increasingly crystal-like structure.
The authors thank Yoshihiko Yokayama (Institute of Metal Research, Tohoku University) for providing the amorphous ingot material and Leonie Koch for providing the model structures. The authors gratefully acknowledge the computing time granted by the John von Neumann Institute for Computing (NIC) and provided on the supercomputer JUROPA at Jülich Supercomputing Centre (JSC). Financial support by DFG grants no. Al-578/13-1 and WI-1899/12-1 is gratefully acknowledged. This work is partly supported by the Grant-in-Aid for Scientific Research on Innovative Area “Bulk Nanostructured Metals” through MEXT, Japan (contract no. 22102004).
References
- Wang et al. (2004) W. H. Wang, C. Dong, and C. H. Shek, Mat. Sci. Eng. R 44 (2004).
- Shintani and Tanaka (2008) H. Shintani and H. Tanaka, Nat. Mater. 7, 870 (2008).
- Schober (2011) H. R. Schober, J. Non-Cryst. Solids 357, 501 (2011).
- Schober and Laird (1991) H. R. Schober and B. B. Laird, Phys. Rev. B 44, 6746 (1991).
- Laird and Schober (1991) B. B. Laird and H. R. Schober, Phys. Rev. Lett. 66, 636 (1991).
- Derlet et al. (2012) P. M. Derlet, R. Maaß, and J. F. Löffler, Eur. Phys. J. B 85, 1 (2012).
- Angell (1995) C. A. Angell, Science 267, 1924 (1995).
- Karpov et al. (1983) V. G. Karpov, M. I. Klinger, and F. N. Ignat’ev, Zh. Eksp. Teor. Fiz. 84, 760 (1983).
- Gil et al. (1993) L. Gil, M. A. Ramos, A. Bringer, and U. Buchenau, Phys. Rev. Lett. 70, 182 (1993).
- Schirmacher and Wagener (1993) W. Schirmacher and M. Wagener, Solid State Commun. 86, 597 (1993).
- Schirmacher et al. (1998) W. Schirmacher, G. Diezemann, and C. Ganter, Phys. Rev. Lett. 81, 136 (1998).
- Schirmacher (2006) W. Schirmacher, Europhys. Lett. 73, 892 (2006).
- Schirmacher et al. (2007) W. Schirmacher, G. Ruocco, and T. Scopigno, Phys. Rev. Lett. 98, 025501 (2007).
- Ferrante et al. (2013) C. Ferrante, W. Pontecorvo, G. Cerullo, A. Chiasera, G. Ruocco, W. Schirmacher, and T. Scopigno, Nat. Commun. 4, 1793 (2013).
- Schober and Oligschleger (1996) H. R. Schober and C. Oligschleger, Phys. Rev. B 53, 11469 (1996).
- Taraskin et al. (2001) S. N. Taraskin, Y. L. Loh, G. Natarajan, and S. R. Elliott, Phys. Rev. Lett. 86, 1255 (2001).
- Chumakov et al. (2011) A. I. Chumakov, G. Monaco, A. Monaco, W. A. Crichton, A. Bosak, R. Rüffer, A. Meyer, F. Kargl, L. Comez, D. Fioretto, H. Giefers, S. Roitsch, G. Wortmann, M. H. Manghnani, A. Hushur, Q. Williams, J. Balogh, K. Parliński, P. Jochym, and P. Piekarz, Phys. Rev. Lett. 106, 225501 (2011).
- Vasiliev et al. (2009) A. N. Vasiliev, T. N. Voloshok, A. V. Granato, D. M. Joncich, Y. P. Mitrofanov, and V. A. Khonik, Phys. Rev. B 80, 172102 (2009).
- Wilde and Rösner (2011) G. Wilde and H. Rösner, Appl. Phys. Lett. 98, 251904 (2011).
- Meng et al. (2012) F. Meng, K. Tsuchiya, Seiichiro II, and Y. Yokoyama, Appl. Phys. Lett. 101, 121914 (2012).
- Ediger et al. (1996) M. D. Ediger, C. A. Angell, and S. R. Nagel, J. Phys. Chem. 100, 13200 (1996).
- Lashley et al. (2003) J. C. Lashley, M. F. Hundley, A. Migliori, J. L. Sarrao, P. G. Pagliuso, T. W. Darling, M. Jaime, J. C. Cooley, W. L. Hults, L. Morales, D. J. Thoma, J. L. Smith, J. Boerio-Goates, B. F. Woodfield, G. R. Stewart, R. A. Fisher, and N. E. Phillips, Cryogenics 43, 369 (2003).
- Plimpton (1995) S. Plimpton, J. Comp. Phys. 117, 1 (1995), http://lammps.sandia.gov/.
- Mendelev et al. (2009) M. I. Mendelev, M. J. Kramer, R. T. Ott, D. J. Sordelet, D. Yagodin, and P. Popel, Philos. Mag. 89, 967 (2009).
- Shimizu et al. (2007) F. Shimizu, S. Ogata, and J. Li, Mater. Trans. 48, 2923 (2007).
- Stukowski (2010) A. Stukowski, Model. Simul. Mater. Sci. Eng. 18, 015012 (2010), http://ovito.org/.
- Dickey and Paskin (1969) J. M. Dickey and A. Paskin, Phys. Rev. 188, 1407 (1969).
- Pathria (1996) R. K. Pathria, Statistical Mechanics, 2nd ed. (Elsevier Butterworth-Heinemann, 1996).
- Rösner et al. (2013) H. Rösner, C. Kübel, M. Peterlechner, and G. Wilde, Ultramicroscopy submitted (2013).
- Bokeloh et al. (2011) J. Bokeloh, S. V. Divinski, G. Reglitz, and G. Wilde, Phys. Rev. Lett. 107, 235503 (2011).
- Jiang et al. (2005) W. H. Jiang, F. E. Pinkerton, and M. Atzmon, Acta Mater. 53, 3469 (2005).
- Xie and George (2008) S. Xie and E. P. George, Acta Mater. 56, 5202 (2008).
- Ritter and Albe (2011) Y. Ritter and K. Albe, Acta Mater. 59, 7082 (2011).
- Kanungo et al. (2004) B. P. Kanungo, S. C. Glade, P. Asoka-Kumar, and K. M. Flores, Intermetallics 12, 1073 (2004).
- Heuer (2008) A. Heuer, J. Phys.: Condens. Mat. 20, 373101 (2008).