20 Anson Road, Level 8
Singapore 079912
{clifton.phua,yuzhang.feng,junyao.ji,timothy.soh}@sas.com
%the␣affiliations␣are␣given␣next;␣don’t␣give␣your␣e-mail␣address%unless␣you␣accept␣that␣it␣will␣be␣publishedhttp://www.sas.com/singapore
Clifton Phua and Yuzhang Feng and Junyao Ji and Timothy Soh
Visual and Predictive Analytics
on Singapore News:
Experiments on GDELT, Wikipedia, and ^STI
Abstract
The open-source Global Database of Events, Language, and Tone (GDELT) is the most comprehensive and updated Big Data source of important terms extracted from international news articles . We focus only on GDELT’s Singapore events to better understand the data quality of its news articles, accuracy of its term extraction, and potential for prediction. To test news completeness and validity, we visually compared GDELT (Singapore news articles’ terms from 1979 to 2013) to Wikipedia’s timeline of Singaporean history. To test term extraction accuracy, we visually compared GDELT (CAMEO codes and TABARI system of extraction from Singapore news articles’ text from April to December 2013) to SAS Text Miner’s term and topic extraction. To perform predictive analytics, we propose a novel feature engineering method to transform row-level GDELT from articles to a user-specified temporal resolution. For example, we apply a decision tree using daily counts of feature values from GDELT to predict Singapore stock market’s Straits Times Index (^STI). Of practical interest from the above results is SAS Visual Analytics’ ability to highlight the various impacts of June 2013 Southeast Asian haze and December 2013 Little India riot on Singapore. Although Singapore is unique as a sovereign city-state, a leading financial centre, has strong international influence, and consists of a highly multi-cultural population, the visual and predictive analytics reported here are highly applicable to another country’s GDELT data.
Keywords:
GDELT, Big Data, Singapore, Visual Analytics, Predictive Analytics1 Introduction
The Global Data on Events, Location and Tone (GDELT) provides one of the best opportunities to perform Big Data analytics on news and events [1]. GDELT [2]:
-
•
is freely available and uses a variety of international news sources with daily updates
-
•
contains more than 250 million events from 1979 to present
- •
We focus our analytical efforts only on Singapore which is a relatively small and peaceful country in the world, compared to parts of the Middle East111How Computers Can Help Us Track Violent Conflicts - Including Right Now in Syria, http://themonkeycage.org/2013/07/09/how-computers-can-help-us-track-violent-conflicts-including-right-now-in-syria/ (2013) 222The Arab Spring and GDELT, http://blog.gdelt.org/2013/10/02/the-arab-spring-and-gdelt/ and Africa [5]. One benefit is that, as authors of this paper, we know recent Singapore’s key events well; and another benefit is that we have to experiment with machine learning (such as building of decision trees) beyond conflict, violence, or protests using GDELT. Below are 4 questions and our corresponding answers after performing initial experiments:
-
1.
Can GDELT be used to understand Singapore better? Yes, to a certain extent. We were able to highlight some key events by exploring different analytical approaches
-
2.
Is GDELT’s news complete and valid? The news sources are comprehensive, but not all articles were valid for our analytical objectives
-
3.
Can GDELT’s term extraction be improved? There can be additional insights from using natural language processing, on top of CAMEO codes and TABARI system
-
4.
Can GDELT be used to predict non-political outcomes? We propose a novel feature engineering algorithm to transform GDELT into a machine learning dataset. For experimental purposes, we attempt to naively predict an index of the Singapore stock market
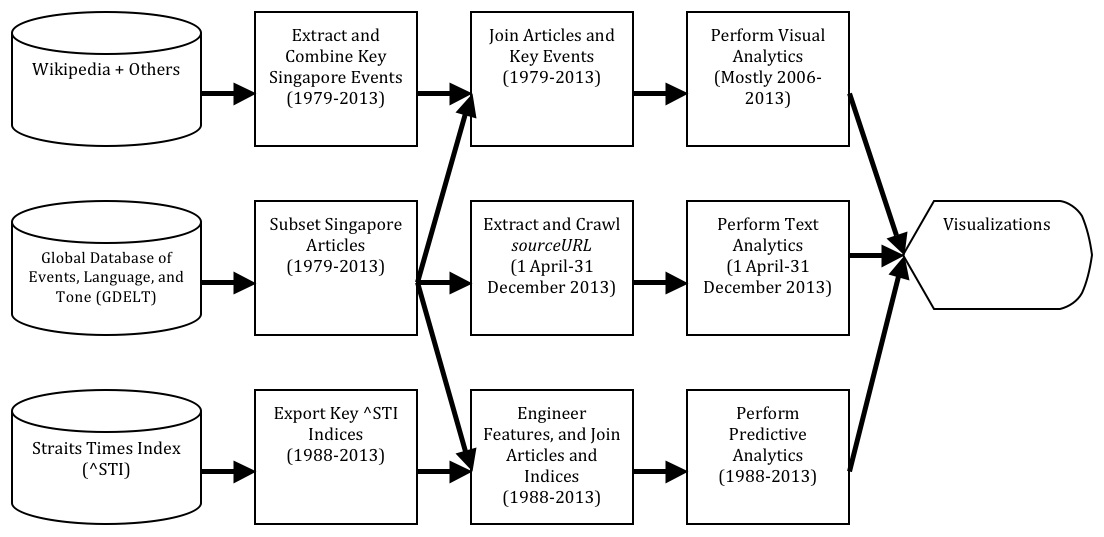
With reference to 1st and 2nd columns of Figure 1, we retrieved only Singapore GDELT articles using ActionGeo_CountryCode333How to both download and read GDELT using just R, http://blog.gdelt.org/2013/09/02/how-to-both-download-and-read-gdelt-using-just-r/. Next, we extract and merge key Singapore events (ground truth) from Wikipedia’s Timeline of Singaporean history, Wikipedia’s List of major crimes in Singapore, BBC Singapore chronology of key events, and TimelinesDB Singapore timeline. Third, we exported the Straits Times Index (^STI) from Yahoo Finance. We chose ^STI as target variable, over interest rates/flat resale price index/unemployment rate/GDP per capita, because it has daily data and it can be slightly influenced by the previous day’s news.
At 3rd column of Figure 1, we joined articles and key events (1979-2013) into a 717,124-row dataset if they shared the same date. Next, we crawled the sourceURL column’s hyperlinks (1 April 2013 to 31 December 2013) using boilerplate detection [6]; and managed to extract 30% of URLs (8,498 out of 28,177). Third, we use Algorithm (Sub-section 4.1) to engineer features, joined them to ^STI indices (1988-2013) with a 1-day lag, to create a 68,514-row dataset.
The last 2 columns in Figure 1 show that visual analytics (Section 2) and predictive analytics (Section 4) were performed. The visualizations are possible using SAS Visual Analytics (VA) [7]. VA provides a robust set of business intelligence capabilities and approachable analytics, enabling different types of users to gain insights from any size of data through data visualization and exploratory analysis. Text analytics (Section 3) was performed using SAS Text Miner (TM) [8]. TM discovers information buried in collections of text. By automatically reading text data and delivering algorithms for rigorous, advanced analyses, the solution makes it possible to grasp future trends and act on new opportunities more precisely and with less risk.
2 Data Quality of News Articles
Due to space constraints, Figures 7 to 15 in Appendix provides sufficient background to our choice of bubble plot and geomap analysis to understand GDELT’s data quality.
2.1 Bubble Plot Analysis
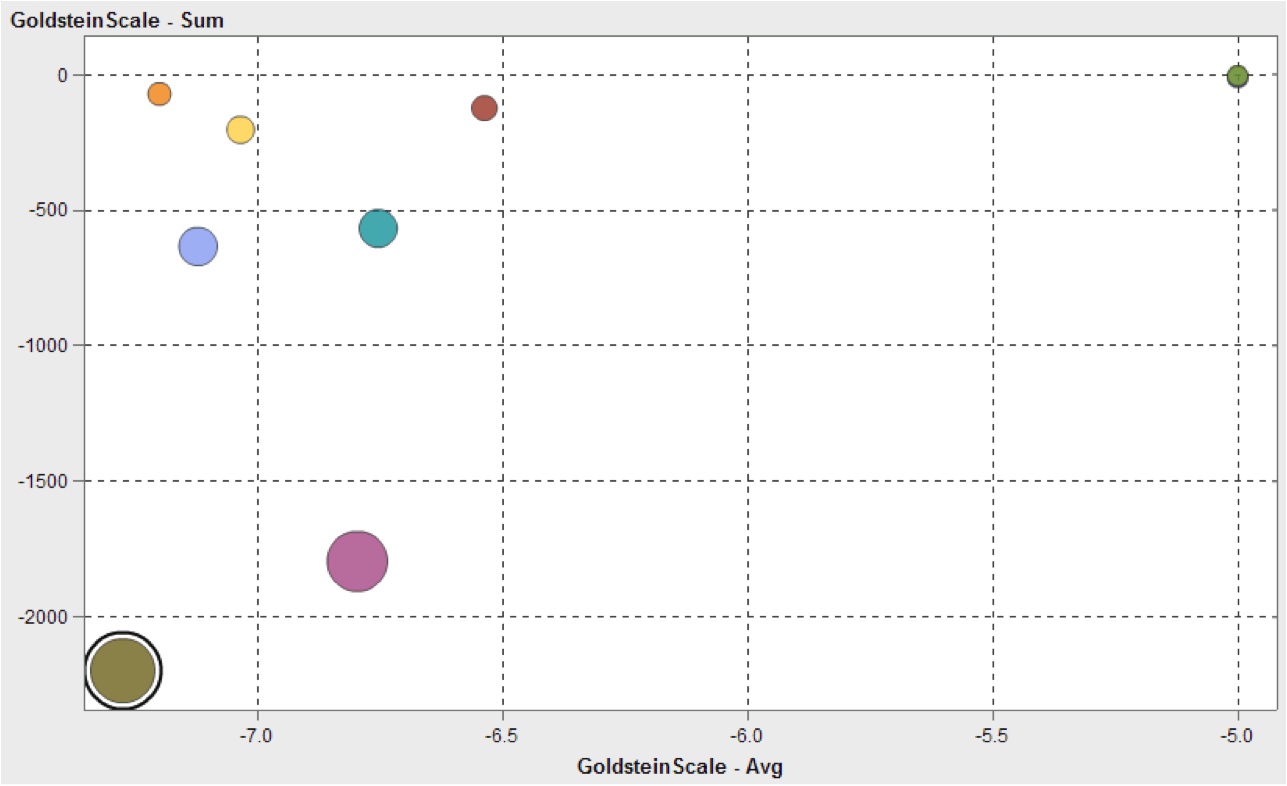
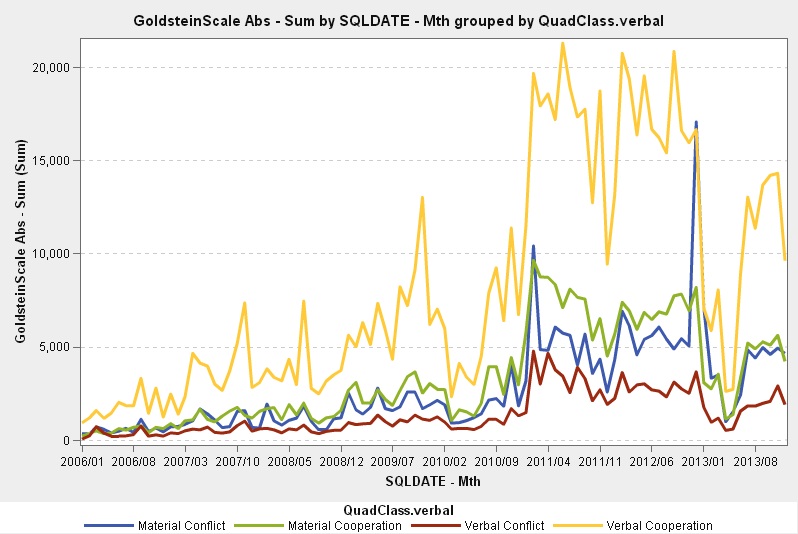
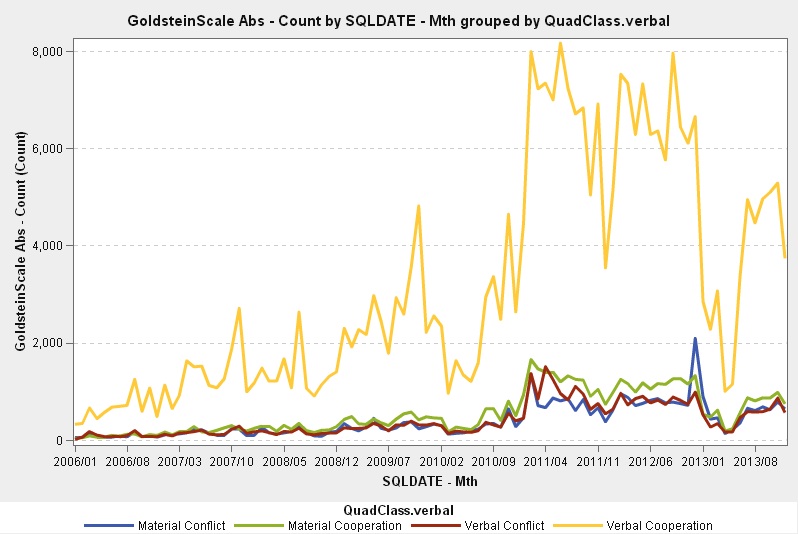
Figure 2 shows a bubble plot from April to December 2013 (sourceURL only existed from April 2013) with the following criteria:
-
1.
QuadClass = Material Conflict
-
2.
event = 1 (months where key Singapore events occurred)
-
3.
IsRootEvent = true (GDELT events were parsed in the first paragraph of the news article)
-
4.
Only regional news publications from Singapore/Malaysia/Indonesia were chosen (www.channelnewsasia.com, news.asiaone.com, www.straitstimes.com, sg.news.yahoo.com, www.todayonline.com, www.businesstimes.com.sg, www.singaporestar.com, www.thestar.com.my, www.themalaysianinsider.com, www.themalaymailonline.com, www.nst.com.my, and www.thejakartapost.com - that were parsed from the sourceURL column, to eliminate over-reporting of events that are of international interest which would overshadow other key Singapore events). The selection of news sources from sourceURL column is only for the bubble plot. The other visualizations used all news sources, because the amount of data was already small from applying other filters.
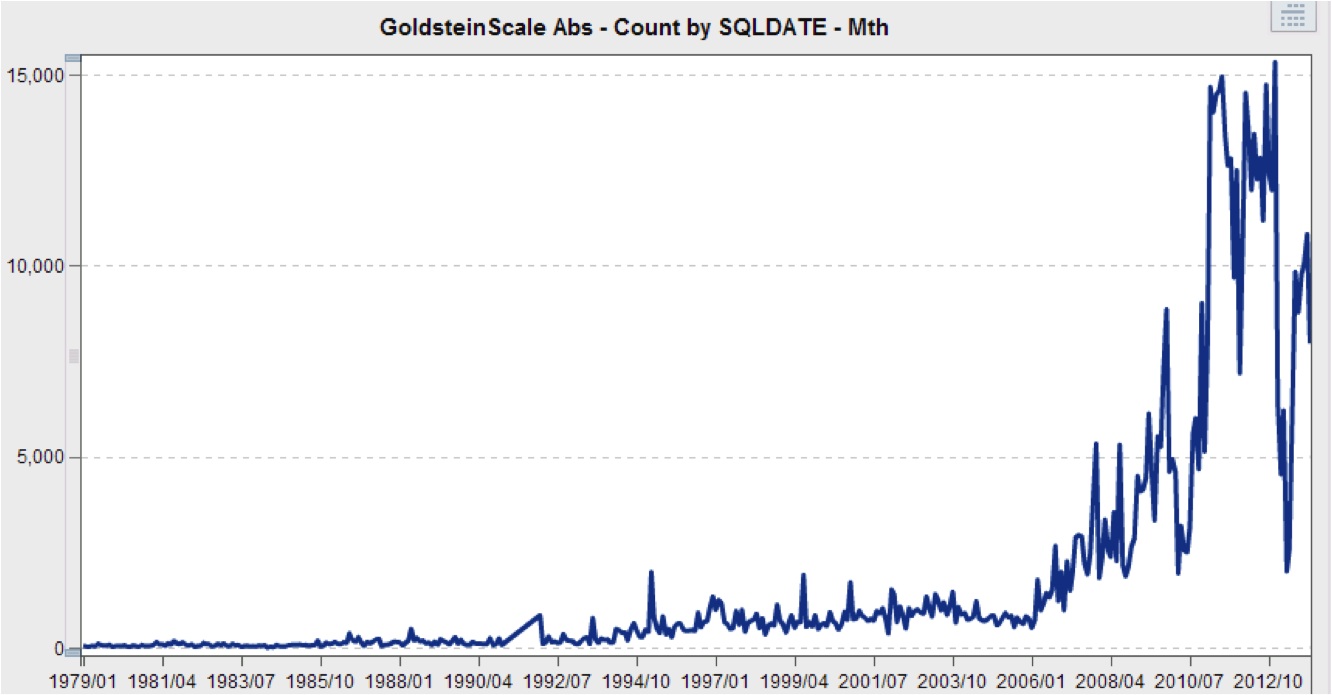
Big bubbles at bottom left or top right ends of the plot are interesting. For example, the highlighted bubble at the bottom left is Singapore news articles in July 2013, upon closer inspection of its sourceURL column, show a large number of news sources linking to the locally well-known Kovan double murder on 12 July 2013.
Visually, we see only a small number of the key Singapore events clearly highlighted in the GDELT GoldsteinScale trends (large bubbles on the extreme ends). This is usually caused by many other less important and random events occurring near or during the duration (7 days before or 14 days after) of the key Singapore events. To test the validity of Singapore GDELT data, a much more detailed list of key Singapore events is required.
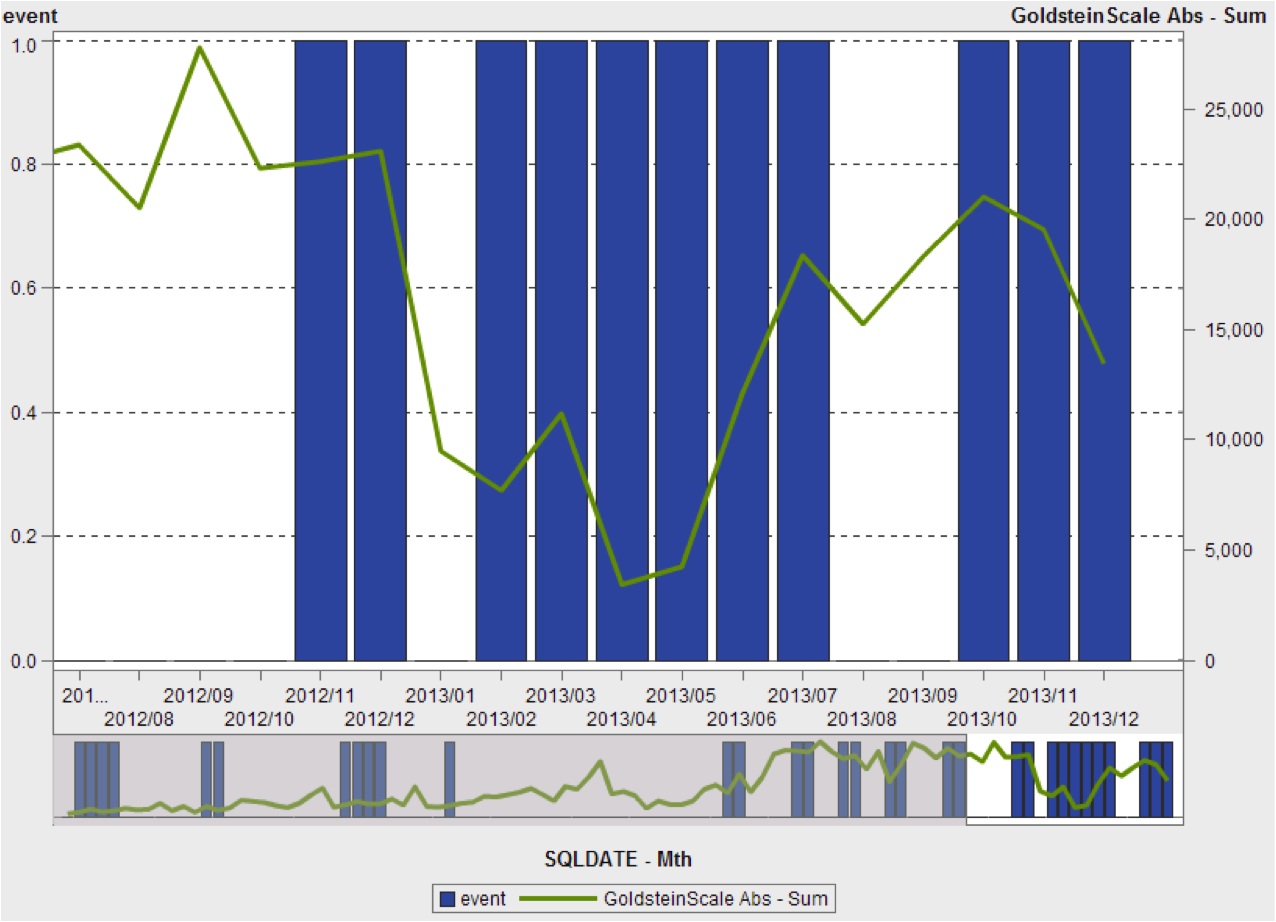
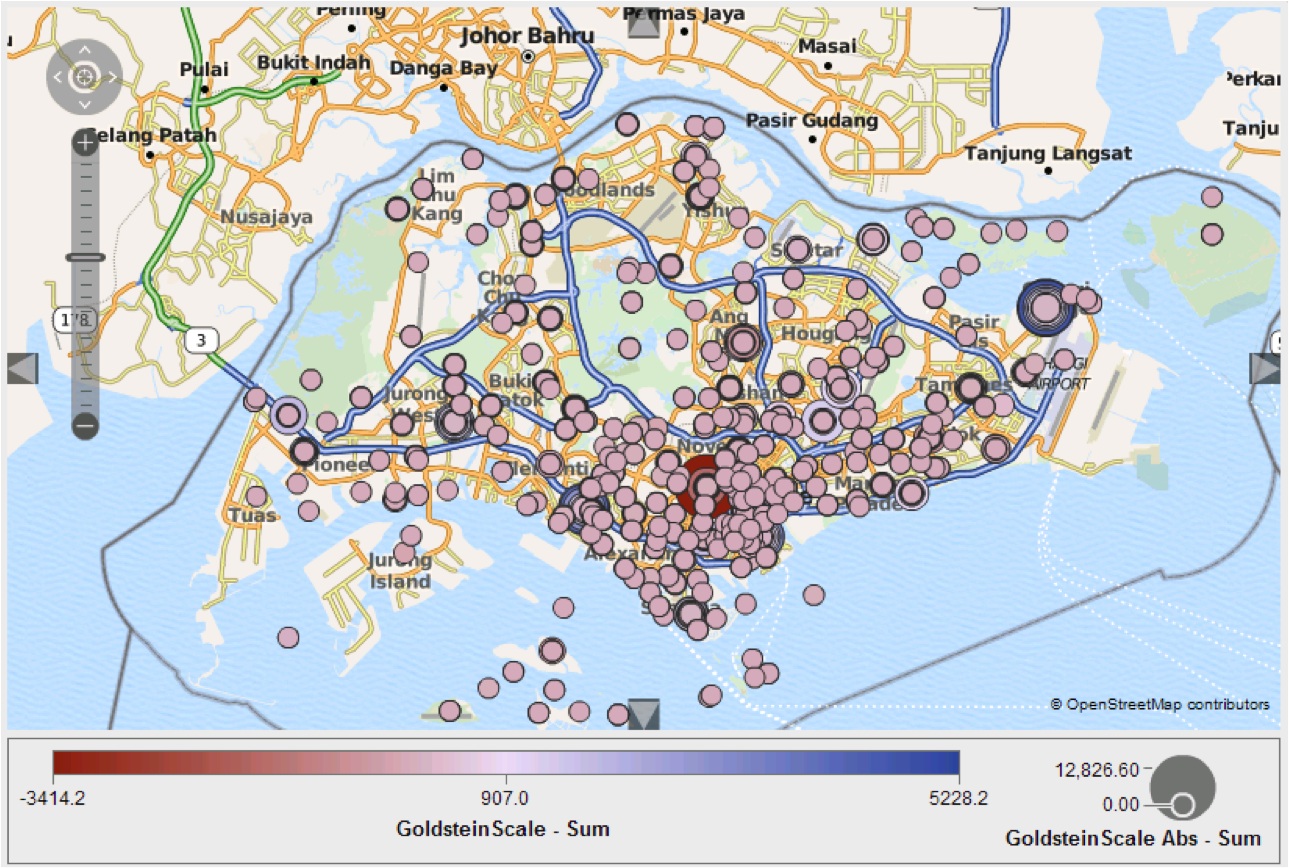
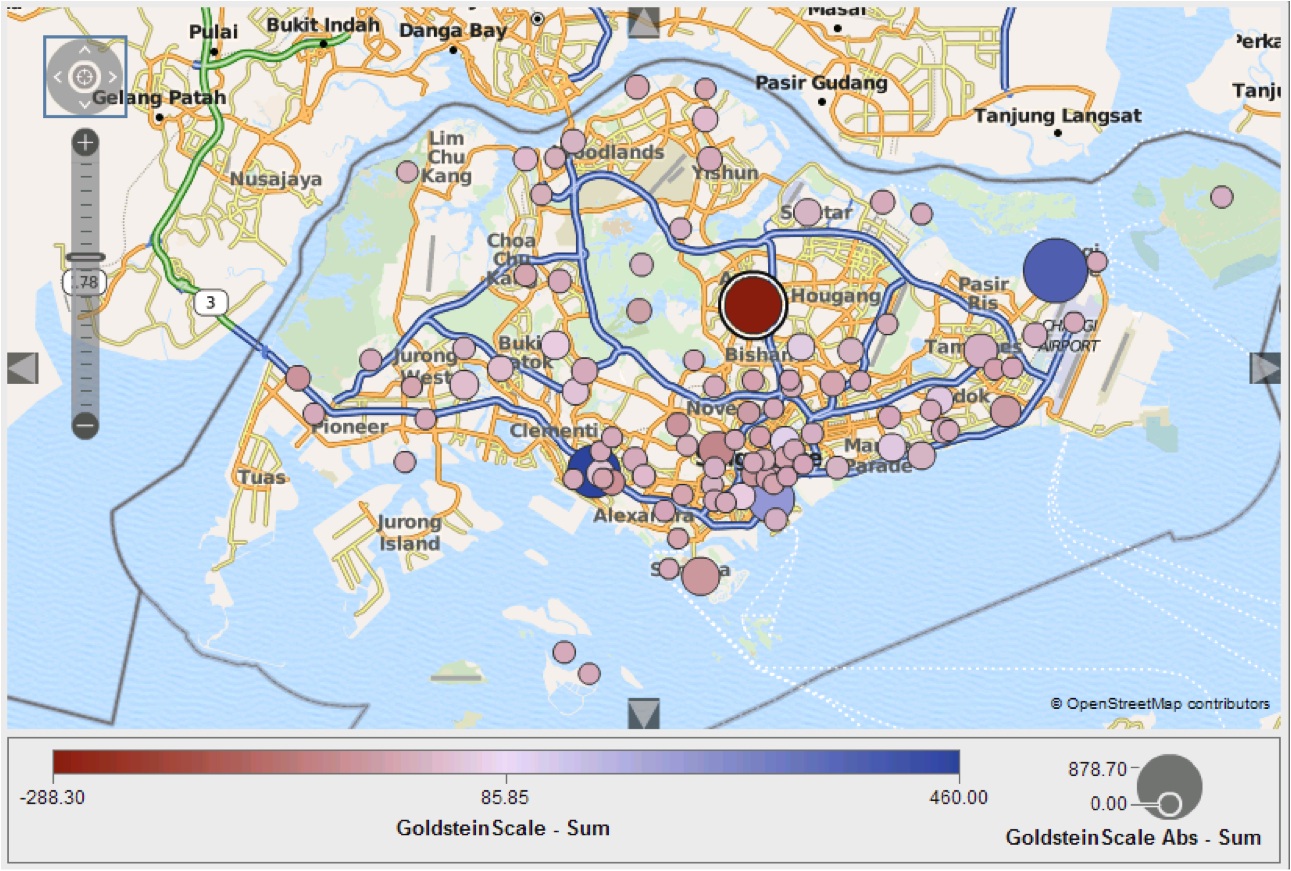
2.2 Geomap Analysis
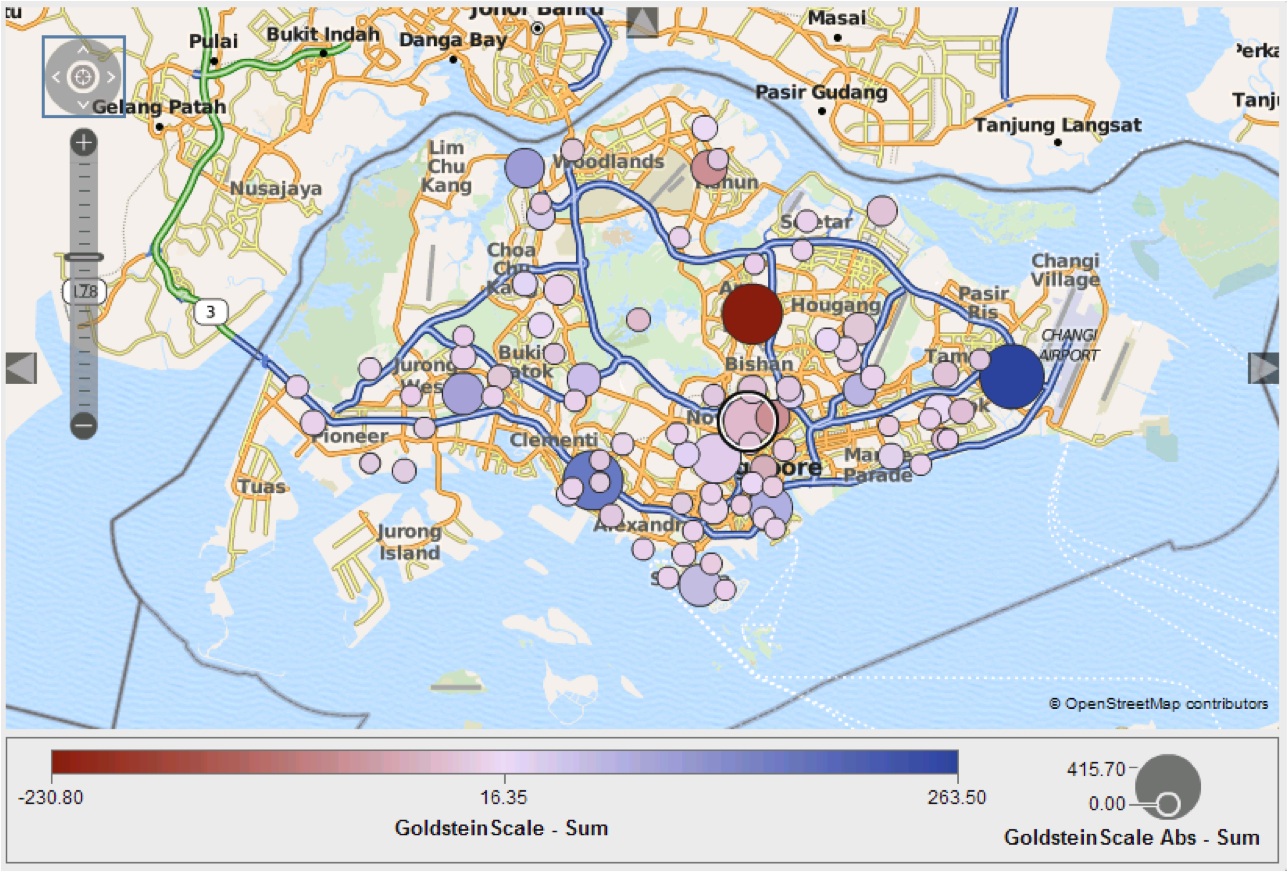
Figure 3 is the geomap of Singapore GDELT articles from December 2013 (1 month only). The highlighted circle corresponds to GDELT articles about the Little India riot which happened on 8 December 2013 - it was the first Singapore riot in over 40 years. This circle does not stand out very much from among others. This shows that not all significant events in Singapore can be clearly discovered using GDELT.
3 Accuracy of Term Extraction
Although TABARI provides effective machine coding using lead sentences, one of its weakness is the dependence on details available in the actor dictionaries [4]. We propose the following use of natural language processing to complement machine coding.
From sourceURL column in our Singapore GDELT dataset, we are able to retrieve a set of news articles’ text from April 2013 to December 2013. We perform two text analytics tasks on this set of articles, namely concept link exploration and topic analysis.
3.1 Concept Link Exploration
Using the concept link exploration feature, we are able to visually analyze which terms co-occur with a given term most frequently in the same document. The terms are visualized using nodes and the thickness of the links represent the degree of co-occurrence.
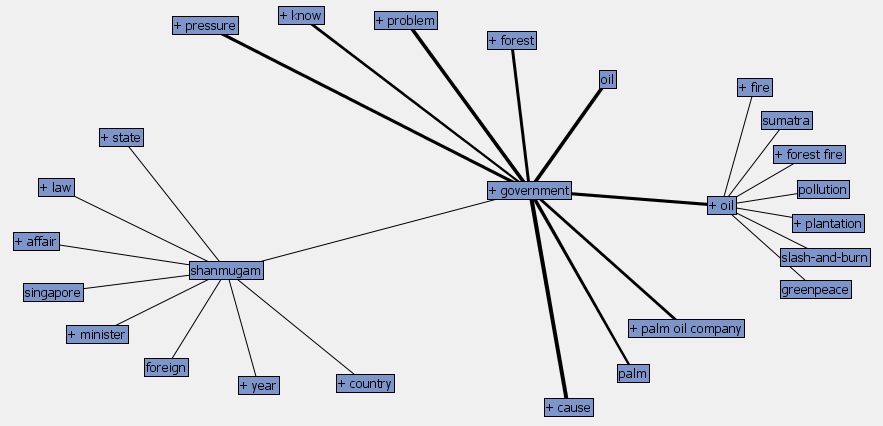
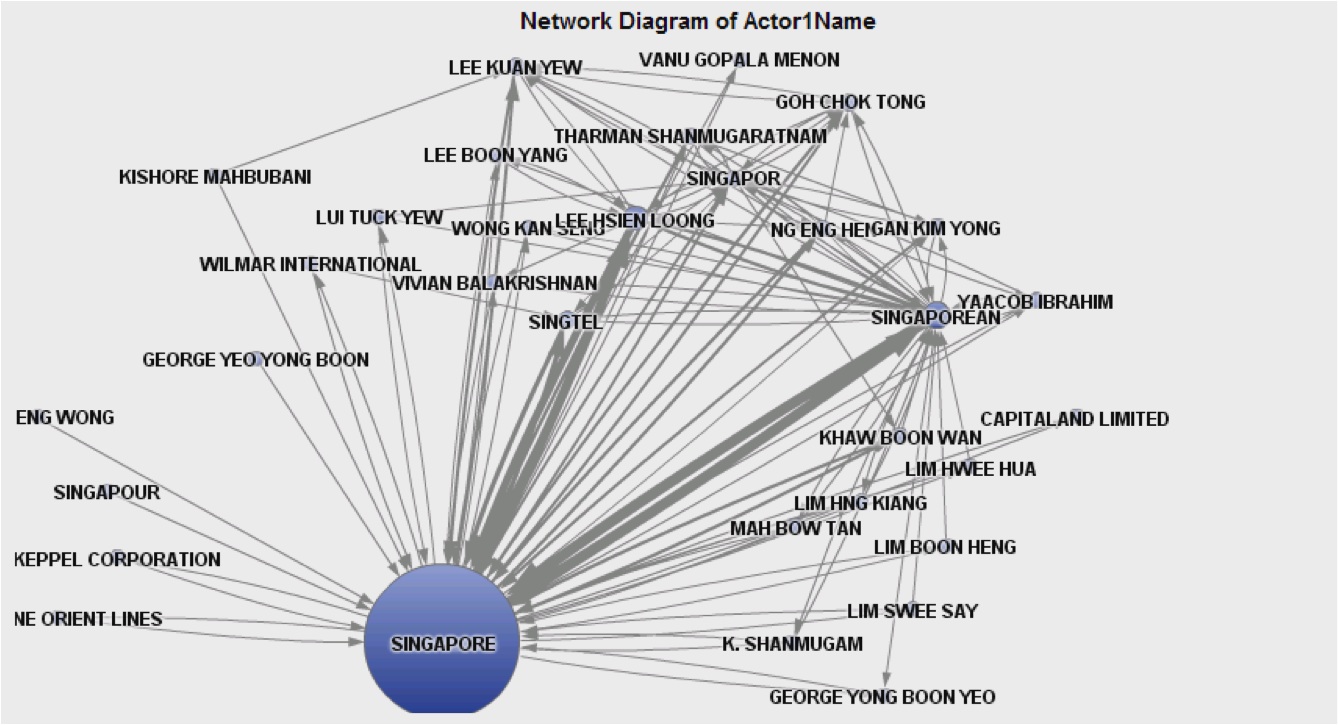
The term “Shanmugam” is one of the most frequent terms in our set of articles. A politician and lawyer, K. Shanmugam is Singapore’s Minister for Foreign Affairs and Minister for Law who frequently gives public speeches and interviews. We study the term “Shanmugam” in more detail using concept link exploration.
Figure 4 illustrates the process and the output. We start by visualizing the top 9 terms that are most closely related to the term “Shanmugam”. Among these terms, we are most interested in the “government” and explore further by expanding it in the concept link graph. It is easy to identify that many terms that have strong co-occurrence with the term “government” are closely related to “oil”. If we explore the term “oil” further, we find terms that are related to Indonesian forest fires which resulted in the Southeast Asian haze - it caused record high levels of air pollution in Singapore of which some days were hazardous to health. Putting them together, it makes sense because Shanmugam was the main politician who gave public statements to the Indonesian government, and requested cooperation and collaboration.
3.2 Topic Analysis
Topic analysis provides ways to define, discover and modify sets of topics contained in the collection of texts. A topic is defined by a set of terms that are strongly associated with a subset of the text collection. Each document can contain zero, one, or many topics. Terms that are used to describe and define one topic can be used in other topics.
To conduct topic analysis, the number of topics has to be provided as an input parameter. Heuristically, we choose to generate 25, 50, 75 and 100 topics for each run. The results of 25-topic analysis is shown in Appendix’s Table 3. Due to space constraints, we show, among many others, 3 key variables for each topic including the top 5 topic terms, the number of topic terms, and the number of documents in the topic. We provided a few key Singapore events in the “Description” column.
We also conducted similar studies for 50, 75 and 100 topics. Due to space constraints, we omit the detailed results. Across the four sets of results, we have other interesting observations. We are able to identify 8 breaking news from the set of articles as shown in Appendix’s Table 3. The topics on Little India riot and Southeast Asian haze exist in all the four result sets. In addition, we discover more topics common to all four sets of results as shown in Appendix’s Table 3. Even with much increase in the number of topics to be identified, the number of common topics does not increase as much.
We have also performed topic analysis on Singapore GDELT articles in quarters 3 and 4 of 2013 separately. Our results show that the haze topic has gone down from 11th place in quarter 3 to 14th in quarter 4 in terms of number of documents on the topic. Over the same period, it can be observed that the topic of Little India riot emerged quickly to 11th in quarter 4. These results are consistent with the chronological order of the two key Singapore events (Southeast Asian haze in June and Little India riot in December 2013).
4 Potential for Prediction
4.1 Feature Engineering using DeriveFeatures Algorithm
In most transactional datasets, there might be multiple records which correspond to a single temporal unit. To roll up the multiple records on the daily level to have exactly one record per day, we need to create a set of new variables to represent the combination of the original variable and its corresponding values. For example, when working with the GDELT dataset, it is often useful to aggregate the records and find out how many events with the value Material Conflict for the Quadclass variable happened on a given day. Such derived information can be used as an important feature for various data analytics/mining tasks such as predictive modeling and clustering. Unfortunately, it is often tedious and error-prone to generate such features manually. Here, we describe a novel and generic feature engineering method.
Algorithm 1 assumes that the input dataset contains variables of which is a date/time variable which has distinct values, and are either nominal or numeric variables. The output dataset contains observations, one for each distinct value of . The variables of include and another sets of variables , one set for each of such that each set contains a set of feature variables derived from their corresponding original variable.
The output dataset is constructed as follows. For each nominal variable (lines 3 to 11), we find out the number of distinct values () for the variable in the input dataset (line 4) and create new variables for the output dataset (line 5). Then the value of the variable for the time/date unit in the output dataset is the number of records with that particular value for the variable for the time/date unit in the input dataset (line 11). We need one extra variable to keep track of the number of records with a missing value for the variable for the time/date unit in the input dataset (line 9). We perform the similar procedures for numeric variables (lines 12 to 20), except that for each of the variables we create bins by using either equal-interval binning or equal-frequency binning method on the all the values of the variable. Similarly we create new variables for the output dataset, one for each bin and the extra one for those records with a missing value. For consistency, we have illustrated the algorithm using the same selection function as the one we used for nominal variables: more specifically, counting the number of records in the corresponding bin for the given date/time unit in the input file. To create other possibly useful features, summation and averaging can also be used as alternative ways for aggregation.
4.2 Prediction using Decision Tree Algorithm
Due to space constraints, Figure 16 is available in the Appendix.
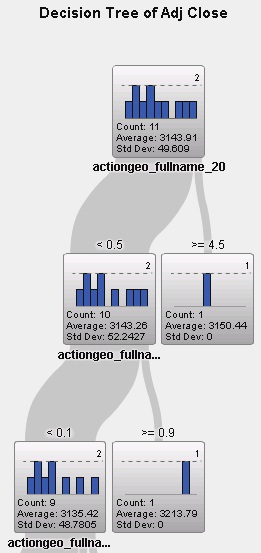
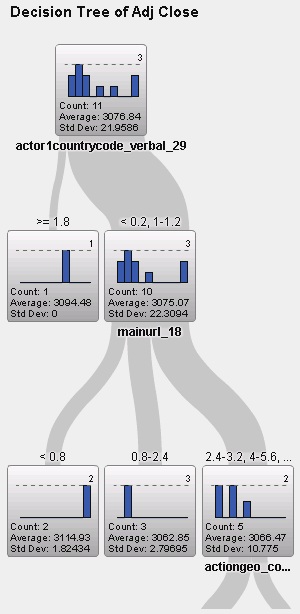
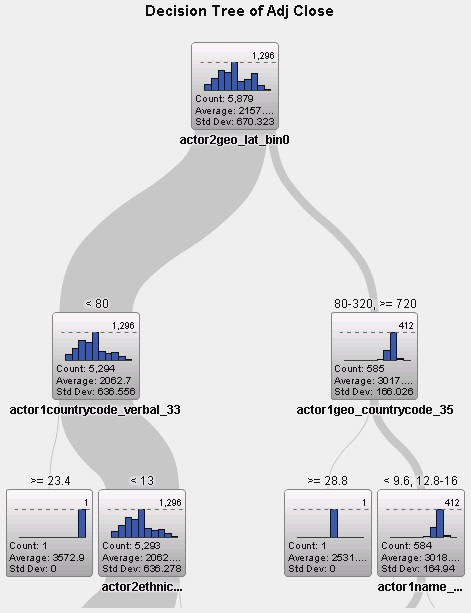
Figure 6 shows the top-3 variables (out of 1,100), during the haze period, to predict ^STI adjusted close price are ActionGeo_Fullname = Toa Payoh, ActionGeo_Fullname = Singapore, and ActionGeo_Fullname = Geylang. Toa Payoh and Geylang are in central parts of Singapore. The former had good news coverage on a facial mask distribution drive for its aged population, and the latter had a number of reports of haze over its skyline and negative impact on outdoor businesses.
Figure 6 shows the top-3 variables (out of 1,100), during the riot period, to predict ^STI adjusted close price are Actor1CountryCode = Pakistan, mainURL = zeenews.india.com, and ActionGeo_CountryCode = Singapore. It shows there was extensive news coverage of the Little India riots by Pakistani, Indian, and Singaporean media.
5 Conclusion
From this initial work on Singapore GDELT articles, we now have a better understanding of the GDELT’s data quality, content, and potential applications. We will track GDELT’s developments through its blog444Blogging about GDELT (gdelt.utdallas.edu), http://blog.gdelt.org/, and future work could include forecasting using GDELT [9].
References
- [1] Arva, B., Beieler, J., Fisher, B., Lara, G., Schrodt, P., Song, W., Sowell, M., Stehle, S.: Improving Forecasts of International Events of Interest. In: EPSA 2013 Annual General Conference, vol. 78 (2013)
- [2] Leetaru, K., Schrodt, P.: GDELT: Global Data on Events, Location, and Tone, 1979–2012. In: ISA Annual Convention, vol. 2 (2013)
- [3] Gerner, D., Schrodt, P., Yilmaz, O, Abu-Jabr, R.: Conflict and Mediation Event Observations (CAMEO): A New Event Data Framework for the Analysis of Foreign Policy Interactions. International Studies Association. (2002)
- [4] Best, R., Carpino, C., Crescenzi, M.: An Analysis of the TABARI Coding System. Conflict Management and Peace Science. 30(4), 335–348 (2013)
- [5] Perry, C.: Machine Learning and Conflict Prediction: A Use Case. Stability: International Journal of Security and Development. 2(3): 56, 1–18 (2013)
- [6] Kohlschütter, C., Fankhauser, P., Nejdl, W.: Boilerplate Detection using Shallow Text Features. In: Proceedings of WSDM10, 441–450 (2010)
- [7] SAS Institute Inc.: SAS Visual Analytics 6.3: User’s Guide. Cary, NC: SAS Institute Inc. (2013)
- [8] SAS Institute Inc.: SAS Text Miner 12.1. Cary, NC: SAS Institute Inc. (2012)
- [9] Brandt, P., Freeman, J., Lin, T., Schrodt, P.: Forecasting Conflict in the Cross-Straits: Long Term and Short Term Predictions. In: Annual Meeting of the American Political Science Association (2013)
- [10] Yonamine, J.: Working with Event Data: A Guide to Aggregation Choices, http://eventdata.psu.edu/papers.dir/Yonamine_domestic_interstate.pdf (2011)
- [11] Goldstein, J.: A Conflict-Cooperation Scale for WEIS Events Data. Journal of Conflict Resolution. 36(2), 369–385 (1992)
Appendix
| Topic | #Terms | #Docs | Description |
|---|---|---|---|
| +school,+student,+woman,+child,+man | 6980 | 10558 | |
| +company,+business,+technology,+industry,asia | 5586 | 10389 | |
| percent,+bank,+market,+company,+billion | 4607 | 9502 | |
| +minister,+cooperation,lee,prime,asean | 4578 | 9486 | |
| +ship,+navy,+defense,+region,military | 5828 | 8309 | |
| +government,political,+policy,+party,+election | 5613 | 8200 | |
| malaysia,datuk,pontian,najib,seri | 5907 | 8187 | |
| tpp,+trade,+agreement,japan,+negotiation | 7638 | ||
| +medium,websites,website,internet,+hack | 5520 | 7591 | |
| +airline,+carrier,+flight,airlines,+passenger | 4098 | 7163 | |
| +worker,+riot,+police,india,little | 4948 | 7016 | Little India riot |
| +court,delhi,+accuse,+victim,+bus | 3124 | 5183 | |
| +haze,+fire,indonesia,sumatra,pollution | 4054 | 4651 | Southeast Asia haze |
| todd,shane,+suicide,+coroner,+death | 3307 | 3903 | |
| sullivan,clinton,iran,obama,+iranian | 2239 | 3099 | |
| +oil,palm,+palm,rspo,palm oil | 893 | 2484 | |
| francis,+navy,misiewicz,beliveau,+ship | 2082 | 1856 | |
| tpp,intellectual,wikileaks,+proposal,+property | 574 | 1135 | |
| bernama,jalan,wisma,65a,603-2693 | 358 | 893 | |
| uruzgan,tarin,kot,afghan,afghanistan | 515 | 787 | |
| hasina,jan 12 2014,sheikh,+swear,+poll | 1102 | 487 | |
| menafn,khaleej,jan 11 2014,+arab time,arab | 470 | 478 | |
| cadets,evesham,petty,dofe,littleton | 347 | 290 | |
| div,+class,li,div class,ul | 49 | 263 | |
| camaro,a8,zl1,chevy,+engine | 714 | 253 |
| Topic Terms | Description |
|---|---|
| +spy,snowden,intelligence,australia,+allegation | |
| philippines,+typhoon,haiyan,relief,philippine | |
| +police,+murder,kovan,+suspect,iskandar | Kovan double murder |
| gay,377a,+man,+dot,+cookie | |
| +riot,+worker,little,+police,india | Little India riot |
| +haze,+fire,indonesia,pollution,sumatra | Southeast Asian haze |
| todd,shane,+suicide,+coroner,+death | |
| tpp,intellectual,wikileaks,+proposal,+property |
| Total | 100 | 75 | 50 | 25 |
| #Unique Common Topics | 20 | 18 | 15 | 9 |