X and -ray pulsations of the nearby radio-faint PSR J17412054
Abstract
We report the results of a deep XMM-Newton observation of the radio-faint -ray pulsar J17412054 and its nebula together with the analysis of five years of Fermi Large Area Telescope (LAT) data. The X-ray spectrum of the pulsar is consistent with an absorbed power law plus a blackbody, originating at least partly from the neutron star cooling. The nebular emission is consistent with that of a synchrotron pulsar wind nebula, with hints of spatial spectral variation. We extended the available Fermi LAT ephemeris and folded the -ray and X-ray data. We detected X-ray pulsations from the neutron star: both the thermal and non-thermal components are 35-40% pulsed, with phase-aligned maxima. A sinusoid fits the thermal folded profile well. A 10-bin phase-resolved analysis of the X-ray emission shows softening of the non-thermal spectrum during the on-pulse phases. The radio, X-ray and -ray light curves are single-peaked, not phase-aligned, with the X-ray peak trailing the -ray peak by over half a rotation. Spectral considerations suggest that the most probable pulsar distance is in the 0.3-1.0 kpc range, in agreement with the radio dispersion measure.
2Istituto Nazionale di Fisica Nucleare, Sezione di Pavia, Via Bassi 6, I-27100 Pavia (Italy)
3Università degli Studi di Pavia, Strada Nuova 65, 27100 Pavia, Italy
4Santa Cruz Institute for Particle Physics, University of California, Santa Cruz, CA 95064
5Department of Astronomy, University of Virginia, P.O. Box 400325, Charlottesville, VA 22904-4325, USA
6Department of Physics, University of Alberta, CCIS 4-183 Edmonton, AB T6G 2E1, Canada
7Department of Physics, The University of Hong Kong, Pokfulam Road, Hong Kong
8Columbia Astrophysics Laboratory, Columbia University, New York, NY 10027, USA
9Arecibo Observatory, HC3 Box 53995, Arecibo, PR 00612, USA
1 Introduction
The launch of the Fermi -ray Space Telescope offered the first opportunity to study a sizeable population of -ray pulsars. The Fermi Large Area Telescope (LAT, Atwood et al., 2009) has discovered pulsed -ray signals from more than 150 objects (Abdo et al., 2013), revolutionizing our view of them and giving birth to new high-energy pulsar sub-families, such as millisecond (see e.g. Abdo et al., 2009b; Ransom et al., 2011; Keith et al., 2011; Espinoza et al., 2013) and radio-quiet -ray pulsars (see e.g. Abdo et al., 2009a; Saz Parkinson et al., 2010; Pletsch et al., 2013), as numerous as the classic family of young, radio-loud pulsars (Caraveo, 2013). The wealth of detections confirms the importance of the -ray channel in the overall energy budget of rotation-powered pulsars and paves the way to understanding the three-dimensional structure and electrodynamics of neutron star magnetospheres. Indeed, radio and -ray light curves contain a great deal of useful information about pulsar emission processes (see e.g. Watters & Romani, 2011; Pierbattista et al., 2012, 2014), confirming that models with emission originating at high altitudes in the magnetosphere (e.g. outer and slot-gap, Cheng et al., 1986; Harding & Muslimov, 2004) are favored over models with near-surface emission (e.g. polar cap, Harding, 2013).
Fitting -ray and radio light curves simultaneously is a promising way to constrain pulsar geometric parameters (e.g., Pierbattista et al., 2014).
Using the information in the (magnetospheric) non-thermal pulsar X-ray light curves
could further improve the approach, adding another piece to the pulsar
emission puzzle. This approach could localize the emitting region(s)
responsible for the non-thermal pulsed X-ray emission with respect to the
high altitude gamma-ray emitting region.
Few X-ray light curves have been exploited for modeling magnetospheric emission, compared to -ray profiles.
This is largely due to the lack of high-quality X-ray light curves, primarily due to the occasional
and non-targeted observational efforts.
At this time, 60 out of 77 young pulsars in the second Fermi LAT pulsar catalog (2PC, Abdo et al., 2013)
have been detected in X-rays (Becker, 2009; Marelli et al., 2011; Marelli, 2012; Abdo et al., 2013), but X-ray pulsations have been detected from fewer than half of them.
Only nine Fermi pulsars have both the high X-ray fluxes and the
long dedicated X-ray observations needed to disentangle the thermal and the non-thermal pulsations.
Only five of these (Crab, Vela, Geminga, PSR J0659+1414 and PSR J10575226) have been
characterized by a multi-bin phase-resolved X-ray spectral analysis (De Luca et al., 2005; Manzali et al., 2007; Weisskopf et al., 2011).
Of these only the Crab (and possibly Geminga, Jackson & Halpern, 2005) yielded a non-thermal light curve with a
photon index varying with phase, a behavior that is still puzzling (Harding et al., 2008; Tang et al., 2008; Hirotani, 2008).
With the notable exception of the Crab among young pulsars, the multiwavelength behavior of isolated neutron stars is complex, with radio, optical, X-ray and -ray light curves usually unaligned, pointing to different emitting regions in the pulsar magnetosphere. The rich phenomenology, in particular including the X-ray information, has not yet been fully exploited for modeling the radiation processes of pulsars, leaving a number of questions unsolved.
Here we report the results of a deep XMM-Newton observation intended for phase-resolved X-ray spectral analysis of the Fermi pulsar J17412054 (hereafter, J1741). The middle-aged J1741 ( = 390 kyr) was discovered in a blind pulsation search of a Fermi LAT point source (Abdo et al., 2009a). For a moment of inertia g cm2, its period = 413 ms and period derivative = s s-1 give a spin-down energy loss rate = 9 erg s-1, clearly on the low side of the -ray pulsar distribution (see Figure 1 in Abdo et al., 2013). The pulsar was then detected in archival Parkes radio observations, showing a remarkably low dispersion measure, DM = 4.7 pc cm-3 (Camilo et al., 2009). The Galactic electron density model of Cordes & Lazio (2002) yields a distance of 0.38 kpc, making J1741 one of the closest -ray pulsars known. At this distance, the low observed 1400 MHz radio flux density, S1.4 160 Jy, makes it the faintest radio pulsar known.
At the position obtained from LAT timing analysis (Ray et al., 2011), Abdo et al. (2009a), Romani et al. (2010) and Marelli et al. (2011) found the X-ray counterpart using both Swift and Chandra data. The Chandra observation also revealed diffuse, faint X-ray emission due to a pulsar wind nebula (PWN) trail extending some 2′ at position angle P.A. = 45∘ 5∘ (north through east). This extended structure was also associated with a 20′′ long H bow shock. Accurate bow shock modelling by Romani et al. (2010) suggests a pulsar velocity vp 150 km s-1 directed 15∘ 10∘ out of the plane of the sky.
2 X-ray Observations
Our deep XMM-Newton observation of J1741 started on 2013 February 28 at 19:50:39 UT and lasted 70.9 ks. The PN camera (Struder et al., 2001) of the European Photon Imaging Camera (EPIC) was operating in Small Window mode (time resolution of 5.6 ms over a 4′ 4′ field of view, FOV), while the Metal Oxide Semi-conductor (MOS) detectors (Turner et al., 2001) were set in Full Frame mode (2.6 s time resolution and a 15′ radius FOV). The thin optical filters were used for the PN and MOS cameras. For our analysis, we used the XMM-Newton Science Analysis Software (SAS) v13.0. To fully characterize both the pulsar and the nebula, we also used the available Chandra Advanced CCD Imaging Spectrometer (ACIS) (Garmire et al., 2003) observation of the field, performed on 2010 May 21 and lasting 48.8 ks (these data were included in Romani et al., 2010). To better characterize the pulsar, we also took advantage of the 300 ks of data collected as part of the Cycle 14 Chandra Visionary Project A Legacy Study of the Relativistic Shocks of PWNe by R. Romani. We retrieved level 1 data from the Chandra Science Archive and used the Chandra Interactive Analysis of Observation (CIAO) software v.4.3. For all the datasets, we followed the standard data processing approach, using the same procedures reported in Marelli et al. (2013).
3 -ray analysis
The Fermi LAT dataset we used to extend -ray ephemeris of J1741 spans five years from 2008 August 4 to 2013 August 4. P7REP Source class events were selected with reconstructed energies from 0.1 to 100 GeV from an area within 20∘ of the source position. We excluded rays collected when the LAT was not in nominal science operations mode, when the spacecraft rocking angle exceeded 52∘, when the Sun was within 5∘ of the pulsar position, and those with measured zenith angles , to reduce contamination by residual rays from the bright limb of the Earth. We performed a binned maximum likelihood analysis, as reported in Abdo et al. (2013). We used the Fermi Science tools v09r32p04, instrument response functions P7REP_SOURCE_V15, the Galactic and isotropic models obtained by the LAT collaboration from the analysis of four years of data. The analysis tools, instrument response functions, and diffuse emission models are available from the Fermi Science Support Center, http://fermi.gsfc.nasa.gov/ssc. The source models were taken from the two-year catalog (Nolan et al., 2012) and 2PC. Post-fit spatial residuals did not reveal the need for any additional sources, beyond those in the two-year catalog, in our model of the region. The pulsar -ray spectrum is consistent with a power law with an exponential cutoff with a photon index = 1.100.10 and cutoff energy Ec = 0.920.06 GeV. These results are in full agreement with those in 2PC.
The Fermi Science Tool gtsrcprob combines the spectral results with
the LAT’s energy-dependent point-spread function (PSF) to assign each event its probability of
coming from the pulsar (Kerr, 2011).
We used only barycentered events with a probability higher than for the following timing analysis.
The rotation ephemeris used in 2PC spans only three years:
we extended it, using a weighted Markov chain Monte Carlo algorithm (MCMC, see e.g. Wang et al., 2013).
Adding six months of data in each iteration, we re-evaluated the timing solution using the weighted H-test (see e.g. De Jager & Busching, 2010).
The highest H-value of 4782.59 (20 harmonics) for five years of data was found for =2.41720384698 Hz, =-9.93133e-14,
=-5.924e-25 and =5.75e-32, with epoch zero at MJD 55631.0002. 222The rotation ephemeris is available at
http://fermi.gsfc.nasa.gov/ssc/data/access/lat/ephems/
With this ephemeris we assigned a rotational phase to each -ray event and filled a 100-bin 0.1 GeV phase histogram,
with bin uncertainties using the photon weights, following Abdo et al. (2013) (see Section 6).
We performed a -ray phase-resolved spectral analysis on the five-year dataset. For 20 phase bins we re-ran the binned spectral analysis, leaving only one or more of the pulsar parameters (normalization, photon index and energy cutoff) free to vary. The Test Statistic value (see e.g. Mattox at al., 1996) does not vary significanlty by freeing one or two of the parameters so that the addition of the additional degrees of freedom are not justified. Moreover, with both the photon index and the cutoff energy free, their fit with a constant is acceptable (null hypothesis probability =6 and 6 for the photon index and cutoff respectively). Thus, we found no indication of spectral variation as a function of the pulsar phase.
4 X-ray Imaging and Source Detection
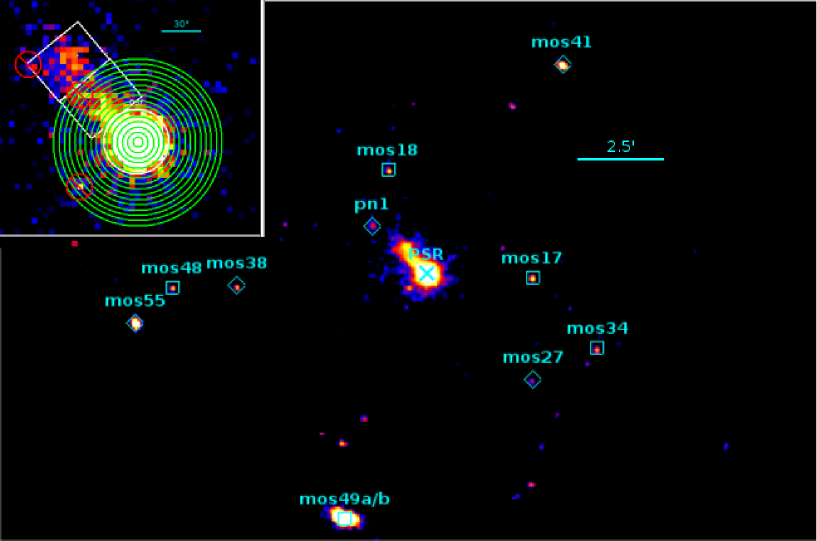
Following the method reported in Marelli et al. (2013), we detected and selected the AGN-like serendipitous sources in the XMM-Newton and Chandra FOVs (see Figure LABEL:fig1). The spectra of these sources were fitted together, linking their hydrogen column densities NH to assess the average Galactic absorption column. The resulting value, N = (4.540.36) 1021 cm-2 (90% confidence error), is slightly greater than the value of 31021 cm-2 obtained from the 21 cm HI sky survey of Kalberla et al. (2005). This points to the absence of thick molecular clouds in the XMM-Newton FOV. Since N obtained from X-ray absorption probes all types of nuclei along the line of sight, whereas the latter value samples only atomic hydrogen, this observed value of NH is to be expected (Dickey & Lockman, 1990).
Apart from the pulsar itself, the main feature apparent in the PN FOV is the PWN emission. To find the best extraction regions for the pulsar and the nebula, as well as to better evaluate the PWN shape, we created exposure-corrected radial (around the pulsar) and linear (parallel and orthogonal to the main axis of the nebula) brightness profiles in the 0.3-10 keV energy range. The radial profile is consistent ( = 0.14) with the nominal instrument PSF (Read, 2004) only up to 40′′ from the pulsar due to the relative faintness of the nebula. The linear profile, with 1′ width centered on the pulsar and orthogonal to the main axis of the nebula, is also consistent ( = 0.009) with the PSF, proving the absence of a detectable nebular component in the orthogonal region. The presence of the nebula in the profile parallel to the main axis is apparent, extending up to from the pulsar and with flux decreasing with distance (apparent in Figure LABEL:fig1, see also Romani et al., 2010). From the deep Chandra observations the unusual, shattered shape of the tail-like nebula is apparent, appearing to be divided into three blobs.
5 Phase-integrated spectral analysis
Using a 25′′ radius extraction circle around the pulsar, we obtained 9794, 2983 and 3073 counts in the 0.3-10 keV energy range in the PN and the two MOS detectors, respectively, with a background contribution of less than 4%. We also used 19380 pulsar counts from the Chandra observations. For the spectral analysis, we followed Marelli et al. (2013). To better constrain the column density, we fitted the nebular spectra together with the pulsar spectrum. We obtained 1508, 557 and 533 counts in the 0.3-10 keV energy range in the PN and the two MOS detectors respectively, with a background contribution of 40% and 25%. We obtained 5633 nebular counts, with a 30% background contribution from the Chandra observations.
One-component models are not statistically acceptable for the pulsar spectrum
(=2.2, for an absorbed power law and =11.6, =0 for an absorbed blackbody,
where the has been reduced for 781 degrees of freedom, or dof).
The pulsar spectrum is consistent (=1.18, =, 779 dof)
with a combination of a power law component with a photon
index of = 2.680.04 (90% confidence errors) and a blackbody
with a temperature of T = (7.070.19) K, and an
emitting radius R = (5.39 km
(where is the distance of the pulsar in units of pc, derived from the dispersion measure
of the pulsar using the NE2001 electron model of the Galaxy, Camilo et al. (2009)), absorbed by a column
density of NH = (1.210.01) 1021 cm-2, about one fourth of the Galactic value.
The PWN spectrum is consistent with an absorbed power law with = 1.740.07.
The unabsorbed fluxes of the non-thermal and thermal components of the pulsar spectrum are
5.470.13 and 7.630.19 erg cm-2 s-1, respectively. The unabsorbed nebular flux is
1.400.09 erg cm-2 s-1.
We note that a three component model is not statistically compelling (for a power law plus double
blackbody we obtain =1.18, =, 777 dof).
We also note that a composite non-thermal plus a magnetized neutron star atmosphere model
(nsa in XSpec; assuming a NS with a radius of 12 km, mass of 1.4 M⊙, and a surface
magnetic field of 1013 G) gives a very poor fit.
We obtain a =1.22, =, 779 dof, with a lower emitting
temperature of (3.020.12) K.
To study the possible spectral variation of the nebula with angular distance from the pulsar, we divided the nebula into three different regions on the basis of their angular separation from the pulsar. We chose to equally divide the main axis of the ellipsoidal nebular region, in order to consider the three blobs. The different PSFs, as well as different exposure maps, of the two X-ray instruments have been taken into account. All the parameters of the spectra from the corresponding regions in Chandra and XMM-Newton observations were linked, also freezing the absorption column to the previously fitted value. We see marginal evidence for a spectral variation (in fact, linking the photon index for the three spectra we obtain =1.45, =6.4,184 dof), with =1.720.09 (90% confidence errors), =1.900.10 and =1.690.09.
6 Pulsar timing analysis
For the timing analysis, PATTERN selection was performed as by Marelli et al. (2013) and the X-ray photon arrival times were barycentered to the Chandra source position (R.A,decl.(J2000) 17:41:57.28, -20:54:11.8) from Romani et al. (2010), which is consistent with the -ray timing position. We then phase-folded the X-ray photons using our Fermi LAT timing solution, contemporaneous with our XMM-Newton data set. We extracted 11507 PN events in the 0.15-10 keV energy range from the 25′′ circle centered on the pulsar. We repeated the exercise for photons in different energy ranges.
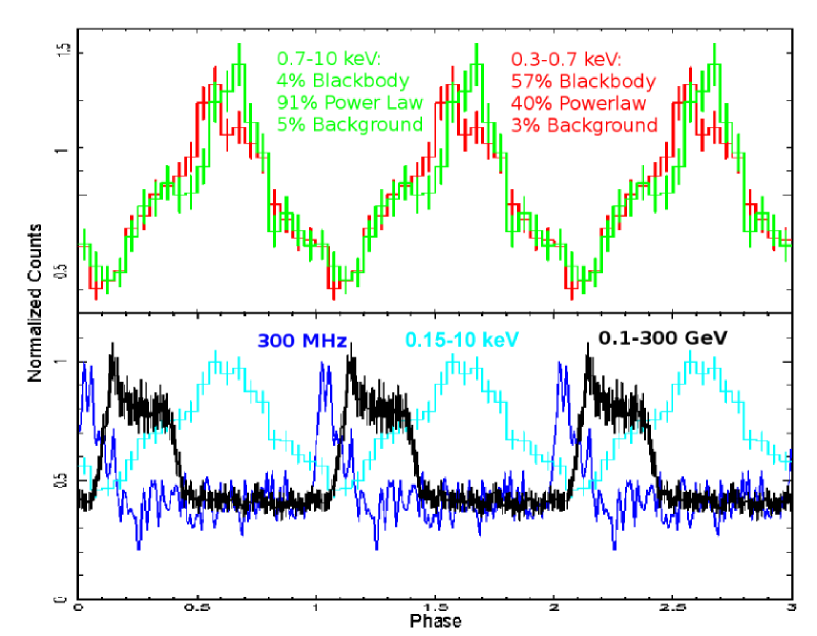
Pulsations with significance appear in the 0.15-10 keV energy range (H-test=585; tail probability = 0, and =29, 19 dof, according to a test on the folded curve testing a constant model). The profile has a single peak, lagging the radio peak by 0.6 in phase. Light curves for different energy ranges are shown in Figure LABEL:fig4, phase-aligned with the -ray and radio profiles. Using the phase-averaged composite spectrum, we evaluated the background contribution, the pulsar blackbody, and the power law components in different energy ranges, as in Caraveo et al. (2010). We obtained a background-subtracted pulsed fraction of 36.11.5% in the 0.3-10 keV energy range. Dividing the energy range into low energy (0.3-0.7 keV, where the blackbody accounts for 60% of the counts) and high-energy bands (0.7-10 keV, where the power law accounts for 90% of the counts) we obtained pulsed fractions of 35.81.5% and 36.41.5%, respectively. We know the pulsed fraction in each band and the percentage of blackbody, power-law and background contributions, so that we can get the net pulsed fraction of the two spectral components. The pulsar’s power law is pulsed at 38% and the blackbody component at 36%. While at lower energies the curve is quasi-sinusoidal (a fit with a sinusoid gives =1.31 , 17 dof, =0.17) due to the blackbody contribution, the profile at higher energies is not compatible with a sinusoid (=2.70 , 17 dof, =10-4). The correlation of the power-law photon index with its normalization (see e.g. Figure LABEL:fig6) somewhat biases the normalization profile in Figure LABEL:fig5, while the counts profiles in Figure LABEL:fig4 are better suited for comparing their shapes. The peak positions at low (0.3-0.7 keV) and high (0.7-10 keV) X-ray energies are separated by less than in phase, but they are offset by about a half-rotation from the main -ray pulse and the radio pulse (following Abdo et al. (2013), the radio pulse leads the -ray pulse by 0.0740.006 in phase).
7 Phase-resolved pulsar analysis
To search for possible variation of the X-ray spectral parameters with rotational phase,
we first fitted the on- and off-pulse spectra.
We define the on-pulse interval to be between phase 0.3 and 0.8 (values obtained from a fit with a double-step model),
and the remaining phase bins as off-pulse.
Fitting only the power-law counts (E0.7 keV), we fixed the column density and the photon
index to the phase-averaged values, obtaining an acceptable =0.047 (=1.21, 143 dof).
Freeing both the normalization and photon indices we obtain an improved fit (=0.22, =1.09, 141 dof).
An f-test (Bevington, 1969) shows that the probability for a chance improvement is 2.6,
pointing to a significant effect when both the power law normalization and photon index are free to vary.
Next we fixed the power law values obtained in the previous fit and we evaluated the blackbody component in the 0.3-0.7 keV energy band.
Thawing only the blackbody normalization, we obtain a =0.74 (=0.93, 128 dof).
A variation of the blackbody temperature with pulsar phase is not statistically compelling;
however, the high pulsed fraction at low energies implies significant pulsation of the blackbody normalization.
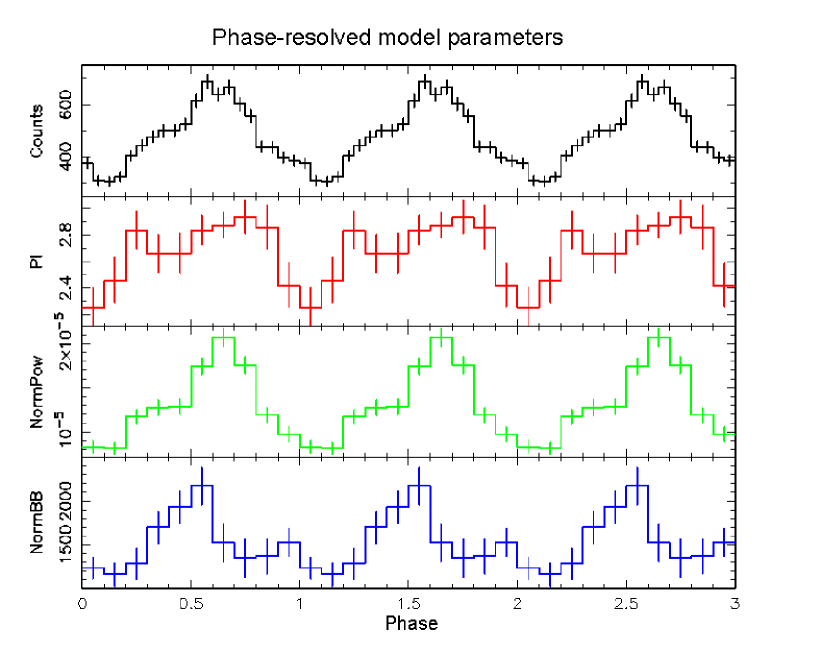
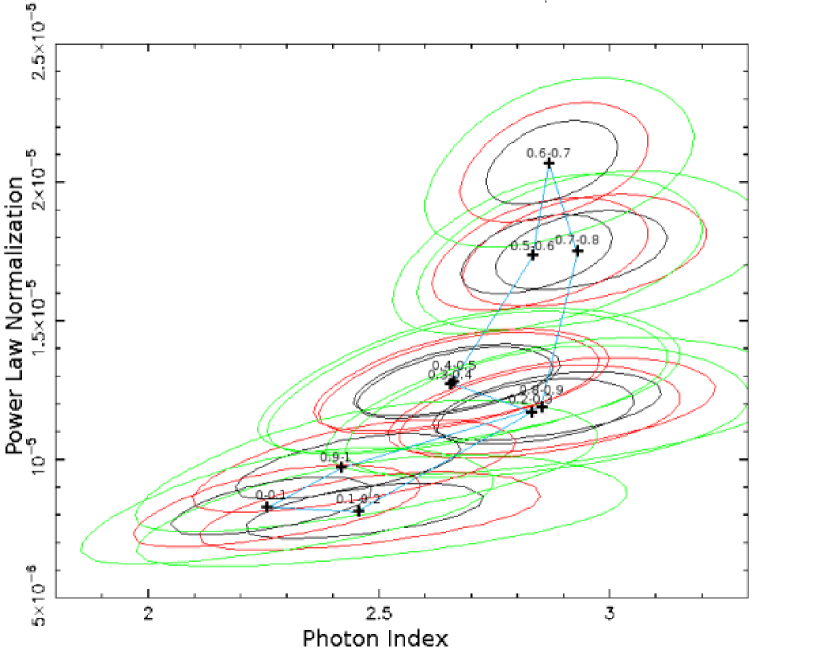
The blackbody normalization and power-law normalization and photon index vary with pulsar phase. We divided our dataset into 10 phase bins, each with width 0.1 and containing 1000 counts, and fitted the obtained spectra fixing the column density and linking blackbody temperatures. We obtained the curves reported in Figure LABEL:fig5, with the photon index gradually increasing with phase and the normalizations following the lightcurve, with no statistically significant differences between blackbody and powerlaw peaks. The variation in photon index is also shown by the confidence contours for the 10 phase bins, plotted in Figure LABEL:fig6 for the plane of the index and the power law normalization. The variation with blackbody normalization is similar.
8 Discussion and Conclusions
By analyzing the new XMM-Newton observation of PSR J17412054, we fully characterized the
high-energy emission of this nearby middle-aged radio-faint pulsar.
Its nebular emission is typical of pulsar wind nebulae, both for its non-thermal spectrum,
and for the flux decrease with distance along the tail emanating from the pulsar.
A hint of nebular spectral variation with distance from the pulsar is detected.
The shattered shape of the nebula is peculiar and a deeper analysis of the new Chandra data is needed to better understand
this unusual behavior. These observations could also provide a measurement of the pulsar proper motion.
Such an analysis is beyond the scope of this work.
Modeling the X-ray spectrum of the pulsar requires a composite model, summing thermal and non-thermal components. Both components are 35-40% pulsed, with single-peaked light curves and maxima phase-aligned to within in phase. While the thermal light curve is compatible with a sinusoid, the non-thermal profile has a sharper peak. The best-fitting thermal spectrum yields a temperature ( K), compatible with the theoretical expectations for the cooling of a 390 kyr-old pulsar (Pons et al., 2009). We note that the best fit temperature of the nsa model ( K) is below the theoretical expectations, further disfavoring such a model. A pulsed component from thermal cooling has already been noted for several pulsars (Caraveo et al., 2004; De Luca et al., 2005; Manzali et al., 2007), and that of PSR J10575226 has a similar pulsed component. Such pulsations can be ascribed to a dependence of the observed emitting area on the line of sight. Halpern & Ruderman (1993) describe a magnetospheric blanket caused by cyclotron resonance scattering off the plasma in the magnetosphere that could screen the thermally emitting surface during specific phase intervals, depending on the magnetic field configuration and viewing geometry. Anisotropic heat transfer from the pulsar interior can also explain flux variation across the neutron star surface (Greenstein & Hartke, 1983). If the thermal component is due to the cooling of the entire neutron star surface (12 km radius), from the thermal normalization in the best fit spectrum (that depends only on the pulsar distance and the emitting radius) we can derive the pulsar distance to be 850 pc, with 3 limits of 650 and 1100 pc (e.g., Halpern et al., 2007). On the other hand, thermal emission from polar caps heated due to downstreaming of (Harding & Muslimov, 2002), as seen in the case of PSR J0007+7303 in the CTA 1 supernova remnant, is expected to be generated from much smaller regions (100 m, based on a simple centered dipole magnetic field geometry, De Luca et al. (2005); Marelli et al. (2013)), which would imply an unrealistic pulsar distance smaller than 10 pc. Distances lower than a few hundred parsecs are greatly disfavored due to the non-negligible value of the column density (about one fourth of the total Galactic column density in this direction). We note that a distance of 850 pc would result in a 110% -ray efficiency, defined as , with the luminosity above 100 MeV. The distance range cited above implies an efficiency range of 60 to 180%. Similarly, the X-ray efficiency would be 1.2% (0.7 to 2.1%). Such an unrealistic -ray efficiency could be explained by a beaming factor fΩ less than 1 (as defined in 2PC), or by a moment of inertia larger than 1045 g cm2.
A 10-bin phase-resolved X-ray spectral analysis reveals variations in the X-ray photon index, in addition to the phase-varying normalizations of the two spectral components, with a softer spectrum during the on-pulse phases (Figure LABEL:fig5). It is difficult to compare the behavior of J1741 with that of other Fermi pulsars, since the Crab is the only one for which such variation was detected, and the Crab’s non-thermal spectrum becomes softer in the primary-pulse maximum and harder during the bridge between the two maxima (Weisskopf et al., 2011). Although some models have been developed to explain the Crab’s optical-to--ray behavior (see e.g. Harding et al., 2008; Tang et al., 2008; Hirotani, 2008), the physics behind the pulsar’s X-ray photon index variations is still unclear.
Moreover, unlike the Crab, the -ray, X-ray and radio peaks of PSR J17412054 are not aligned, pointing to a clear difference in the geometry and/or altitude above the neutron star surface of the different emitting regions. Indeed, the -ray and X-ray peaks are phase-offset by roughly a half rotation, as is also seen in PSRs J0007+7303, J10575226 and J0659+1414 (De Luca et al., 2005; Caraveo et al., 2010). Although these differences are expected from different models for the radio and -ray bands (Abdo et al., 2013), no model is able to account for the offset between -ray and X-ray peaks. The alignment between the thermal and non-thermal X-rays (seen also in other pulsars, e.g. J0659+1414 and J10575226), as well as the phase lag with the -ray emission coming from the outer magnetosphere, can suggest that the non-thermal emission is generated in a region near the pulsar poles (e.g. in a polar cap emission model). Also, the low X-ray luminosity of radio-quiet pulsars in the X-ray band (Marelli et al., 2011) suggests that the radio and X-ray emission regions may be in close proximity. The origin of the phase lag between the radio and X-ray light curves is unclear. A comprehensive study of pulsar high-energy light curves and phase-resolved spectra will be crucial to understanding the X-ray emission mechanisms and geometry.
The Fermi LAT Collaboration acknowledges generous ongoing support from a number of agencies and institutes that have supported both the development and the operation of the LAT as well as scientific data analysis. These include the National Aeronautics and Space Administration and the Department of Energy in the United States, the Commissariat à l’Energie Atomique and the Centre National de la Recherche Scientifique / Institut National de Physique Nucléaire et de Physique des Particules in France, the Agenzia Spaziale Italiana and the Istituto Nazionale di Fisica Nucleare in Italy, the Ministry of Education, Culture, Sports, Science and Technology (MEXT), High Energy Accelerator Research Organization (KEK) and Japan Aerospace Exploration Agency (JAXA) in Japan, and the K. A. Wallenberg Foundation, the Swedish Research Council and the Swedish National Space Board in Sweden. Additional support for science analysis during the operations phase is gratefully acknowledged from the Istituto Nazionale di Astrofisica in Italy and the Centre National d’Études Spatiales in France.
A special thanks to David A. Smith and Tyrel Johnson for reviewing the paper. Facilities: CXO (ACIS), XMM (EPIC), Fermi (LAT).
References
- Abdo et al. (2009a) Abdo, A.A., Ackermann, M, Ajello, M. et al. 2009, Science, 325, 840
- Abdo et al. (2009b) Abdo, A.A., Ackermann, M, Ajello, M. et al. 2009, Science, 325, 848
- Abdo et al. (2013) Abdo, A.A., Ajello, M., Allafort, A. et al. 2013, ApJS, 208, 17
- Atwood et al. (2009) Atwood, W.B., Abdo, A. A., Ackermann, M. et al. 2009, ApJ, 697, 1071
- Becker (2009) Becker, W. 2009, ASSL, 357, 91
- Bevington (1969) Bevington P.R. 1969, Data Reduction and Error Analysis for the Physical Sciences (New York: McGraw-Hill)
- Camilo et al. (2009) Camilo, F., Ray, P. S., Ransom, S. M. et al. 2009, ApJ, 705, 1
- Caraveo et al. (2004) Caraveo, P.A., De Luca, A., Mereghetti, S., Pellizzoni, A., Bignami, G. F. 2004, Sci, 305, 376
- Caraveo et al. (2010) Caraveo, P.A., De Luca, A., Marelli, M. et al. 2010, ApJ, 725, 6
- Caraveo (2013) Caraveo, P.A 2013, arXiv:1312.2913
- Cheng et al. (1986) Cheng, K.S., Ho, C., Ruderman, M. 1986, ApJ, 300, 500
- Cordes & Lazio (2002) Cordes, J.M. & Lazio, T.J.W. 2002, arXiv:astro-ph/0207156
- De Jager & Busching (2010) De Jager, O. & Busching, I., 2010, A&A, 517, 9
- De Luca et al. (2005) De Luca, A., Caraveo, P.A., Mereghetti, S., Negroni, M., Bignami, G.F. 2005, ApJ, 623, 1051
- Dickey & Lockman (1990) Dickey, J.M. & Lockman F.J. 1990, ARA&A, 28, 215
- Espinoza et al. (2013) Espinoza, C.M., Guillemot, L., Celik, O., Weltevrede, P., Stappers, B.W. et al., 2013, MNRAS, 430, 571
- Garmire et al. (2003) Garmire, G.G., Bautz, M.W., Ford, P.G. et al. 2003, SPIE 4851, 28
- Greenstein & Hartke (1983) Greenstein, G. & Hartke, G.J. 1983, ApJ, 271, 283
- Halpern & Ruderman (1993) Halpern, J.P. & Ruderman, M. 1993, ApJ, 415, 286
- Halpern et al. (2007) Halpern, J.P., Camilo, F., Gotthelf, E. V. 2007, ApJ, 668, 1154
- Harding et al. (2008) Harding, A.K., Stern, J.V., Dyks, J., Frackowiak, M. 2008, ApJ, 680, 1378
- Harding & Muslimov (2002) Harding, A.K. & Muslimov, A.G., 2002, ApJ, 568, 862
- Harding & Muslimov (2004) Harding, A.K. & Muslimov, A.G., 2004, 35th COSPAR Scientific Assembly, 35, 562
- Harding (2013) Harding, A.K., 2013, JASS, 30, 145
- Hirotani (2008) Hirotani, K. 2008, ApJ, 688, 25
- Jackson & Halpern (2005) Jackson, M. S.& Halpern, J. P. 2005, ApJ, 633, 1114
- Kalberla et al. (2005) Kalberla, P.M. Burton, W.B., Hartmann, D. 2005, A&A, 440, 775
- Keith et al. (2011) Keith, M.J., Johnston, S., Ray, P.S., Ferrara, E.C., Saz Parkinson, P.M. et al., 2011, MNRAS, 414, 1292
- Kerr (2011) Kerr, M. 2011, ApJ, 732, 38
- Manzali et al. (2007) Manzali, A., De Luca, A., Caraveo, P.A. 2007, ApJ, 669, 570
- Marelli et al. (2011) Marelli, M., De Luca, A., Caraveo, P.A. 2011, ApJ, 733, 82
- Marelli et al. (2013) Marelli, M., De Luca, A., Salvetti, D. et al. 2013, ApJ, 765, 36
- Marelli (2012) Marelli, M. 2012, arXiv:1205.1748
- Mattox at al. (1996) Mattox, J.R., Bertsch, D.L., Chiang, J. et al. 1996, ApJ, 461, 396
- Nolan et al. (2012) Nolan, P.L., Abdo, A. A., Ackermann, M. et al. 2012, ApJ, 199, 31
- Pierbattista et al. (2012) Pierbattista, M. Grenier, I.A., Harding, A.K., Gonthier, P.L. 2012, A&A, 545, 42
- Pierbattista et al. (2014) Pierbattista, M., Harding, A.K., Grenier, I.A. 2014, arXiv:1403.3849, submitted to A&A
- Pletsch et al. (2013) Pletsch, H.J., Guillemot, L., Allen, B., Anderson, D., Aulbert, C. et al., 2013, ApJ, 779, 11
- Pons et al. (2009) Pons, J.A., Miralles, J.A., Geppert, U. 2009, A&A, 496, 207
- Protassov et al. (2002) Protassov, R., Van Dyk, D.A., Connors, A. et al. 2002, ApJ, 571, 545
- Ransom et al. (2011) Ransom, S.M., Ray, P.S., Camilo, F., Roberts, M.S.E., Celik, O. et al., 2011, ApJ, 727, 16
- Ray et al. (2011) Ray, P.S., Kerr, M., Parent, D. et al. 2011, ApJ, 194, 17
- Read (2004) Read, A.M. 2004, XMM-CCF-REL-167
- Romani et al. (2010) Romani, R.W., Shaw, M.S., Camilo, F., Cotter, G., Sivakoff, G.R. 2010, ApJ, 724, 908
- Saz Parkinson et al. (2010) Saz Parkinson, P.M., Dormody, M., Ziegler, M., Ray, P.S., Abdo, A.A. et al., 2010, ApJ, 725, 571
- Struder et al. (2001) Struder, L., Briel, U., Dennerl, K. et al. 2001, A&A, 365, L18
- Tang et al. (2008) Tang, A.P.S., Takata, J., Jia, J.J., Cheng, K.S. 2009, ApJ, 676, 562
- Turner et al. (2001) Turner, M.J.L., Abbey, A., Arnaud, M. et al. 2001, A&A, 365, 27
- Wang et al. (2013) Wang, Z., Breton, R.P., Heinke, C.O., Deloye, C.J., Zhong, J. 2013, ApJ, 765, 151
- Watters & Romani (2011) Watters, K.P. & Romani, R.W. 2011, ApJ, 727, 123
- Weisskopf et al. (2011) Weisskopf, M.C., Tennant, A.F., Yakovlev, D.G. et al. 2011, ApJ, 743, 139