Rejection of randomly coinciding events in ZnMoO4 scintillating bolometers
Abstract
Random coincidence of events (particularly from two neutrino double beta decay) could be one of the main sources of background in the search for neutrinoless double beta decay with cryogenic bolometers due to their poor time resolution. Pulse-shape discrimination by using front edge analysis, mean-time and methods was applied to discriminate randomly coinciding events in ZnMoO4 cryogenic scintillating bolometers. These events can be effectively rejected at the level of 99% by the analysis of the heat signals with rise-time of about 14 ms and signal-to-noise ratio of 900, and at the level of 92% by the analysis of the light signals with rise-time of about 3 ms and signal-to-noise ratio of 30, under the requirement to detect 95% of single events. These rejection efficiencies are compatible with extremely low background levels in the region of interest of neutrinoless double beta decay of 100Mo for enriched ZnMoO4 detectors, of the order of counts/(y keV kg). Pulse-shape parameters have been chosen on the basis of the performance of a real massive ZnMoO4 scintillating bolometer. Importance of the signal-to-noise ratio, correct finding of the signal start and choice of an appropriate sampling frequency are discussed.
1 Introduction
Observation of neutrinoless double beta () decay would imply the violation of lepton number conservation and definitely new physics beyond the Standard Model, establishing the Majorana nature of neutrino Avignone:2008 ; Rodejohann:2011 ; Elliott:2012 ; Vergados:2012 ; Giuliani:2012a . Cryogenic scintillating bolometers look the most promising detectors to search for this extremely rare process in a few theoretically favourable nuclei Pirro:2006 ; Arnaboldi:2010 ; Lee:2011 ; Giuliani:2012b ; Beeman:2012a ; Beeman:2012b ; Beeman:2013 . Zinc molybdate (ZnMoO4) is one of the most promising materials to search for decay thanks to the absence of long-lived radioactive isotopes of constituting elements, the comparatively high percentage of molybdenum and the recently developed technique of growing large high quality radiopure ZnMoO4 crystal scintillators Beeman:2012a ; Beeman:2012b ; Gironi:2010 ; Beeman:2012c ; Beeman:2012d ; Chernyak:2013 .
However, a disadvantage of the low temperature bolometers is their poor time resolution, which can lead to a significant background at the energy due to random coincidences of signals, especially of the unavoidable two-neutrino decay events Chernyak:2012 . This issue is particularly relevant for the experiments aiming at searching for decay of 100Mo, because of the short half-life of 100Mo in comparison to the two neutrino double beta () decay yr Arnold:2005 . Counting rate of two randomly coincident events in cryogenic Zn100MoO4 detectors is expected to be on the level of counts / (keVkgyr) at the energy (for 100 cm3 crystals, under a condition that two events shifted in time in 1 ms can be resolved), meaning that randomly coincident decays can be even a main source of background in a future large scale high radiopurity experiment Chernyak:2012 .
This work describes the development of pulse shape discrimination techniques to reject randomly coinciding events in ZnMoO4 cryogenic scintillating bolometers.
2 Randomly coinciding events in cryogenic bolometers
The energy distribution of the randomly coinciding (rc) events was built using the approach described in Chernyak:2012 , under the assumption that two events are not resolved in the time interval 45 ms.111This time interval is related to typical rise-times observed in large mass bolometers, like those operated in the Cuoricino experiment Andreotti:2011 . The energy spectra of Monte Carlo generated events of 100Mo decay and of two randomly coinciding events are presented in Fig. 1. The rate for the rc events is calculated as , where , is the number of decaying nuclei in Zn100MoO4 crystal (with 100% enrichment by 100Mo) of typical size of cm (), ms, yr.
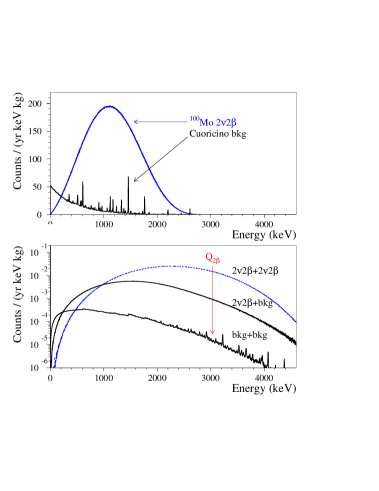
In addition to the decay, there could be other background sources contributing to the background in the region of interest due to random coincidence. We have estimated a possible contribution of the external gamma background using the level of background already achieved in the Cuoricino detector Andreotti:2011 . A simplified model of the Cuoricino background (taken from Andreotti:2011 in the energy interval 300 – 2620 keV, while exponentially extrapolated below 300 keV and equated to 0 above 2620 keV) and a Monte Carlo simulated energy spectrum of two randomly coincident background events are presented in Fig. 1.
We have also simulated coincidences of the Cuoricino background with the decay of 100Mo. One can see that the main contribution to background (assuming radiopure Zn100MoO4 crystal scintillators and a cryostat with a level of radioactive contamination similar to that of the Cuoricino set-up) is expected from the decay of 100Mo. The total counting rate due to the random coincidences of decay events and external gamma events in the region of interest is estimated as counts/(year keV kg) for a detector time resolution of 45 ms.
3 Generation of randomly coinciding signals
Sets of single and randomly coincident signals were generated by using pulse profiles and noise baselines accumulated with a real 0.3 kg ZnMoO4 crystal scintillator operated as a cryogenic scintillating bolometer with a Ge light detector LD-tenconi in Centre de Sciences Nucléaires et de Sciences de la Matière (Orsay, France). Two measurements have been taken into account, the first one with a sampling rate of 5 kSPS (kilosamples per second) both for the light and heat channels, and the second one with the sampling rate 1.9841 kSPS for the both channels. Ten thousand of base-line samples were selected in all the cases.
The pulse profiles of heat and light signals of the detectors (sum of a few hundred pulse samples produced mainly by cosmic rays with energy of a few MeV) were obtained by fit with the following phenomenological function:
| (1) |
where is the amplitude, , , and are the time constants.
To generate randomly coinciding signals in the region of the value of 100Mo, the amplitude of the first pulse was obtained by sampling the distribution for 100Mo, while the amplitude of the second pulse was chosen as , where is a random component in the energy interval keV (which is a typical energy resolution of a bolometer).
Ten thousand coinciding signals were randomly generated in the time interval from to , see Section 4.2), where is the rise-time of the signals (defined here as the time to increase the pulse amplitude from 10% to 90% of its maximum). As it will be demonstrated in the section 4.1, the rejection efficiency of randomly coinciding signals (RE, defined as the part of the pile-up events rejected by pulse-shape discrimination) reaches almost its maximal value when the time interval of consideration exceeds . Ten thousand of single signals were also generated.
A signal-to-noise ratio (defined as the ratio of the maximum signal amplitude to the standard deviation of the noise baseline) was taken 30 for light signals and 900 for heat signals. These values are typical for ZnMoO4 scintillating bolometers. Examples of the generated heat and light single pulses are presented in Fig. 2.

4 Methods of pulse-shape discrimination
We have applied three techniques to discriminate randomly coincident events: mean-time method, approach, and front edge analysis. We demanded a 95% efficiency in accepting single signals. For an efficient discrimination, it is very important to develop a method for a good determination of the pulse start position.
4.1 Reconstruction of the time origin of the events
The following procedure was used to reconstruct the time origin of each signal:
-
1.
Preliminary search for the presence of a signal by a very simple algorithm, which searches for a channel where the signal amplitude exceeds a certain level (typically about one third of the signal maximum value);
-
2.
Summation of the data over a certain number of channels (typically over 2-6 channels for the light signals, depending on the time structure of signal and noise data; this procedure was not used for the heat signals);
-
3.
Calculation of the standard deviation of the baseline fluctuations;
-
4.
Search for the pulse start under the request that the signal exceeds a certain number of standard deviations of the baseline and – in a case of heat signals – the amplitude in the next several channels increases channel by channel.
The algorithm was optimized for each data set, taking into account the sampling rate, the time properties of the signals and noise, and the signal-to-noise ratio.
4.2 Mean-time method
The following formula was applied to calculate the parameter (mean-time) for each pulse :
| (2) |
where the sum is over time channels , starting from the origin of a pulse and up to a certain time.
As a first step we have chosen the time interval to analyze efficiency of the pulse-shape discrimination. Six sets of single and randomly coinciding light (with ms) and heat signals (with ms) were generated in the time intervals ranging from 0 to a maximum value, varying from 1 to about 6 pulse rise-times. The results of this analysis are presented in Fig. 3. The uncertainties of the rejection efficiency were estimated by analysis of three sets of data generated using three sets of different noise baseline profiles (about 3300 profiles in the each set). One can see that the rejection efficiency of randomly coinciding signals reaches its maximal value when the time interval is larger than . All the further analysis was done by using data generated in the time interval .

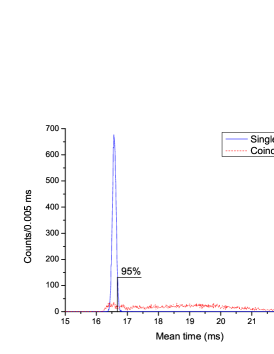
A typical distributions of the mean time parameters for single and pile-up events are presented in Fig. 4. The rejection efficiency of randomly coinciding pulses, under the requirement to detect 95% of single events, is 92.2%.
One could expect that the rejection efficiency of pulse-shape discrimination depends on the choice of the time interval used to calculate a discrimination parameter. For instance, in Fig. 5 the results of the mean-time method optimization are presented. The rejection efficiency has a maximum when the mean-time parameter is calculated from the signal origin to the 30th channel which approximately corresponds to . All the discrimination methods were optimized in a similar way.
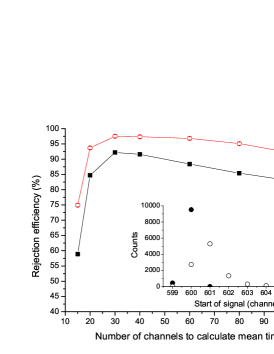
The dependences presented in Fig. 5 demonstrate also the importance to optimize an algorithm to find the start of the signals (see Section 4.1), particularly for the light pulses with comparatively low signal-to-noise ratio. Rejection efficiency is substantially higher when the start position of each pulse is known from the generation algorithm. The distributions of start positions for the sets of single and randomly coinciding events shown in Inset of Fig. 5 demonstrate that it is more problematic to correctly find the start position of randomly coinciding signals than that of single events.
4.3 method
The approach is based on the calculation of the parameter defined as
| (3) |
where the sum is over time channels , starting from the origin of pulse and up to a certain time, and is defined by Eq. (1). The number of channels to calculate the has been optimized to reach a maximal rejection efficiency.
4.4 Front edge analysis
The front edge parameter can be defined as the time between two points on the pulse front edge with amplitudes % and % of the pulse amplitude. The parameters and should be optimized to provide maximal rejection efficiency. For instance, the highest rejection efficiency for heat pulses with ms was reached with the front edge parameter determined as time between the signal origin and the time where the signal amplitude is of its maximum (RE = 98.4%).
However, the rejection efficiency of the front edge method is limited due to the fraction of randomly coinciding events with a small first (with the amplitude below ) or second pulse (with a low amplitude, and appearing well after the first signal maximum).
5 Results and discussion
The methods of pulse-shape discrimination are compared in Table 1. The data were obtained with start positions of the signals found by our algorithms, and using a priori known signal start positions from the generation procedure (to estimate a maximum achievable efficiency). All the methods give a rejection efficiency by using the light signals with a rise-time of 3 ms and for the much slower heat signals with a rise-time of 13.6 ms. One can conclude that the signal-to-noise ratio (set to 30 for the light and to 900 for the heat signals at the energy , as observed in real bolometers) plays a crucial role in the pulse-shape discrimination of randomly coinciding events in cryogenic bolometers. Analysis of signals with lower level of noise allows to reach much higher rejection efficiency even with slower heat signals. Dependence of the rejection efficiency (by using the mean-time method) on the signal-to-noise ratio for heat signals confirms the assumption (see Fig. 6).
| Channel, | Start | Mean-time | Front edge | method, |
|---|---|---|---|---|
| rise-time | position | method, % | analysis, % | % |
| Light, | Known | |||
| 3 ms | Found | |||
| Heat, | Known | |||
| 13.6 ms | Found |

We tried also to analyse a dependence of the rejection efficiency on the rise-time of light pulses (see Fig. 7). We have assumed that the pulse amplitude does not change by shortening the rise-time. One could expect that for faster signal any methods should give a higher efficiency of pulse-shape discrimination. However, the trend of the rejection efficiency improvement for faster signals is rather weak. Furthermore, the rejection efficiency for pulses with a rise-time of 2 ms is even worse in comparison to slower signals with rise-times of 3 ms and 4.5 ms. This feature can be explained by a rather low sampling rate (1.9841 kSPS) used for the data acquisition. Indeed, the pulse profiles acquired with this sampling rate are too discrete: for instance, the front edge of the signals with the rise-time 2 ms is represented by only 4 points. Such a low discretization even provides difficulties to set the acceptance factor of single events at a certain level (95% in our case), particularly in the front edge analysis.
The importance of the data acquisition sampling rate for the pulse-shape analysis was proved by taking the noise baselines data with 2 times lower sampling rate (we have transformed the data by simply averaging two adjacent channels to one). The rejection efficiency decreases in this case, as one can see in Fig. 7.

Following the previous discussion, we will calculate now how our pile-up rejection procedure would improve the background figure estimated at the end of Section 2, and corresponding to in an enriched Zn100MoO4 detector based on a crystal size of cm. We remind that this value was obtained assuming that pulses separated by an interval longer than 45 ms would be far enough to be analysed independently and on the contrary all the concomitant pulses within this time interval would give rise to a single amplitude equal to the sum of the individual ones. We are authorised to abate the resulting background level by 99.3% in the heat channel and 92.3% in the light channel, as these are our best pile-up rejection efficiencies with unknown pulse start position (see Table 1).222We safely assume that the rejection efficiency in the 45 ms time interval is the same as in the shorter time interval since the rejection efficiency starts to saturate, as it can be appreciated in Fig. 3. The final estimated background level after pile-up rejection is counts/(year keV kg) using pulse-shape discrimination in the heat channel. A higher value is obtained using the light channel because of the worse rejection efficiency. An improvement of the speed and of the signal-to-noise ratio in cryogenic bolometers – both in the heat and light channel – is an important experimental goal to further enhance the rejection of RC-generated background.
6 Conclusions
Random coincidence of events (especially but not only from decay) could be one of the main sources of background in cryogenic bolometers to search for decay because of their poor time resolution, particularly for 100Mo due to the short half-life in comparison to that of the two-neutrino mode. However, this background can be effectively suppressed with the help of pulse-shape discrimination.
The randomly coinciding decay signals were discriminated with an efficiency at the level of 99% by applying the mean-time approach to the heat signals from ZnMoO4 cryogenic bolometer with a rise-time of about 14 ms and a signal-to-noise ratio of 900, and at the level of 97% for the light signals with 3 ms rise-time and signal-to-noise ratio of 30 (however, the last estimation was obtained for the signals with a priory known start position). approach provides comparable rejection efficiencies, while the results of the front edge analysis are slightly worse due to problems in discriminating pile-up events when one of the randomly coinciding signals is too small to be detected by this method.
The signal-to-noise ratio looks the most important feature to reject randomly coinciding events, particularly in ZnMoO4 due to the comparatively low light yield, which leads to a rather low signal-to-noise ratio in the light channel.
Development of algorithms to find the origin of a signal with as high as possible accuracy is requested to improve the rejection capability of any pulse-shape discrimination technique. The sampling rate of the data acquisition should be high enough to provide effective pulse-shape discrimination of randomly coinciding events. Finally, any pulse-shape discrimination methods should be optimized taking into account certain detector performance to reduce the background effectively.
The analysis performed in this work proves further that the counting rate due to the random coincidence of events can be reduced to a level counts/(year keV kg), which makes ZnMoO4 cryogenic scintillating bolometers very promising to search for neutrinoless double beta decay at a level of sensitivity high enough to probe the inverted hierarchy region of the neutrino mass pattern Beeman:2012a .
7 Acknowledgements
This work was supported in part by the project “Cryogenic detector to search for neutrinoless double beta decay of molybdenum” in the framework of the Programme “Dnipro” based on the Ukraine-France Agreement on Cultural, Scientific and Technological Cooperation. The study of ZnMoO4 scintillating bolometers is part of the program of ISOTTA, a project receiving funds from the ASPERA 2nd Common Call dedicated to R&D activities.
References
- (1) F.T. Avignone III, S.R. Elliott, and J. Engel, Rev. Mod. Phys. 80, 481 (2008).
- (2) W. Rodejohann, Int. J. Mod. Phys. E 20, 1833 (2011).
- (3) S.R. Elliott, Mod. Phys. Lett. A 27, 1230009 (2012).
- (4) J.D. Vergados, H. Ejiri, F. Simkovic, Rep. Prog. Phys. 75, 106301 (2012).
- (5) A. Giuliani and A. Poves, Adv. High En. Phys. 2012, 857016 (2012).
- (6) S. Pirro et al., Phys. At. Nucl. 69, 2109 (2006).
- (7) C. Arnaboldi et al., Astropart. Phys. 34, 143 (2010).
- (8) J. Lee et al., Astropart. Phys. 34, 732 (2011).
- (9) A. Giuliani, J. Low Temp. Phys. 167, 991 (2012).
- (10) J.W. Beeman et al., Phys. Lett. B 710, 318 (2012).
- (11) J.W. Beeman et al., Astropart. Phys. 35, 813 (2012).
- (12) J.W. Beeman et al., JINST 8, P05021 (2013).
- (13) L. Gironi et al., JINST 5, P11007 (2010).
- (14) J.W. Beeman et al., J. Low Temp. Phys. 167, 1021 (2012).
- (15) J.W. Beeman et al., Eur. Phys. J. C 72, 2142 (2012).
- (16) D.M. Chernyak et al., Nucl. Instr. Meth. A 729, 856 (2013).
- (17) D.M. Chernyak et al., Eur. Phys. J. C 72, 1989 (2012).
- (18) R. Arnold et al., Phys. Rev. Lett. 95, 182302 (2005).
- (19) E. Andreotti et al., Astropart. Phys. 34, 822 (2011).
- (20) M. Tenconi et al., PoS(PhotoDet 2012)072