Adventures of a tidally induced bar
Abstract
Using -body simulations, we study the properties of a bar induced in a disky dwarf galaxy as a result of tidal interaction with the Milky Way. The bar forms at the first pericentre passage and survives until the end of the evolution at 10 Gyr. Fourier decomposition of the bar reveals that only even modes are significant and preserve a hierarchy so that the bar mode is always the strongest. They show a characteristic profile with a maximum, similar to simulated bars forming in isolated galaxies and observed bars in real galaxies. We adopt the maximum of the bar mode as a measure of the bar strength and we estimate the bar length by comparing the density profiles along the bar and perpendicular to it. The bar strength and the bar length decrease with time, mainly at pericentres, as a result of tidal torques acting at those times and not to secular evolution. The pattern speed of the bar varies significantly on a time scale of 1 Gyr and is controlled by the orientation of the tidal torque from the Milky Way. The bar is never tidally locked, but we discover a hint of a 5/2 orbital resonance between the third and fourth pericentre passage. The speed of the bar decreases in the long run so that the bar changes from initially rather fast to slow in the later stages. The boxy/peanut shape is present for some time and its occurrence is preceded by a short period of buckling instability.
keywords:
galaxies: dwarf – galaxies: Local Group – galaxies: kinematics and dynamics – galaxies: evolution – galaxies: interactions1 Introduction
Observations indicate that a significant fraction of spiral galaxies are barred (e.g. Cheung et al. 2013 and references therein). While precise measurements of the bar fraction vary (between 20 and 70 percent, depending on the sample) there is no doubt that the phenomenon is a rather common feature in galaxies. In addition, comparisons of the frequency of bar presence in nearby galaxies to the one in high-redshift objects lead to the conclusion that bars occur relatively late in the evolution of galaxies (Sheth et al. 2008).
The essence of bar formation is the transformation of circular orbits in the stellar disk into elongated ones (for reviews on dynamics of bars see e.g. Sellwood & Wilkinson 1993; Athanassoula 2013). While a simplified analytic description of the phenomenon is possible (Binney & Tremaine 2008), the problem can be fully tackled only using -body simulations. This approach was pioneered by Miller and Smith (1979) who studied the bar evolution and discussed the bar pattern speed, the particle orbits and the predicted observational properties of bars. Sparke & Sellwood (1987) studied the bar formation via disk instability, performed detailed classification of stellar orbits in the bar and found the bar to be stable and robust. While such instability is indeed generally believed to be responsible for bar formation, we still do not have a full grasp of all the intricacies of bar formation and evolution and alternative ways to form a bar have been considered.
Combes et al. (1990) were among the first to discuss the box and peanut shapes generated by stellar bars and Raha et al. (1991) discovered a mechanism that may be responsible for these shapes in the form of the buckling instability. The instability drives the stars out of the galactic plane and may significantly weaken the bar (for more recent developments see e.g. Athanassoula 2005; Martinez-Valpuesta, Shlosman & Heller 2006; Saha, Pfenniger & Taam 2013). Insight into its nature can be obtained via studies of vertical orbital instabilities (e.g. Binney 1978; Pfenniger 1984; Skokos, Patsis & Athanassoula 2002a,b).
Additional complication in the study of bar dynamics is introduced by the presence of extended dark matter haloes surrounding the disks (Debattista & Sellwood 2000; Athanassoula 2002, 2003; Dubinski, Berentzen & Shlosman 2009; Saha & Naab 2013). Overall, the evolution of the bar’s major properties, such as its strength or pattern speed depends on a plethora of parameters and has been only partially explored in simulations (Athanassoula & Misiriotis 2002; Klypin et al. 2009; Athanassoula, Machado & Rodionov 2013).
One factor that has been relatively underexplored is the effect of galaxy interactions. Previous studies of the influence of interactions on the properties of the bars discussed mainly the effect of a satellite on the bar in the normal-size galaxy (Gerin, Combes & Athanassoula 1990; Sundin, Donner & Sundelius 1993; Miwa & Noguchi 1998; Mayer & Wadsley 2004; Romano-Díaz et al. 2008). In this paper we are interested in a different phenomenon, that of a tidally induced bar in a dwarf galaxy interacting with a bigger host. Important hints that such a process may be important in shaping the properties of present-day dwarfs are provided by observations that bars form later in fainter galaxies (Sheth et al. 2008) and that bar fraction is higher in fainter objects in dense environments such as galaxy clusters (Lansbury, Lucey & Smith 2014). A possible interpretation of these results is that dwarf galaxies are born with dynamically hotter disks which delays bar formation (Athanassoula & Sellwood 1986; Sheth et al. 2012) until they are accreted by a more massive galaxy or become a member of a group or cluster where they are affected by tidal forces. An example of such a tidally induced bar could be the one in M82, resulting from an interaction with M81 (Wills et al. 2000).
The formation of tidally induced bars in dwarf galaxies has been studied mainly in the context of the tidal stirring scenario for the formation of dwarf spheroidal (dSph) galaxies in the Local Group (Mayer et al. 2001; Klimentowski et al. 2009; Kazantzidis et al. 2011; Łokas, Kazantzidis & Mayer 2011). The simulations of this process revealed that the formation of a bar is a natural intermediate stage of a dwarf galaxy in its morphological evolution from a disk toward a spheroid that occurs for a variety of dwarf’s orbits around the host and for different initial structural parameters. Łokas et al. (2012) measured the shapes of simulated dSph galaxies and compared them to the shapes of classical dSph satellites of the Milky Way quantified in the same way. Bar-like surface density distributions were found in the Sagittarius, Ursa Minor and possibly Carina dwarfs. Elongated shapes, suggestive of the presence of the bar are also seen in the recently discovered ultra-faint dwarfs like Hercules (Coleman et al. 2007) and Ursa Major II (Muñoz, Geha & Willman 2010). Note that although the Large Magellanic Cloud (LMC) is also known to possess a bar, this structure is probably not of tidal origin. Indeed, according to the most probable scenario the LMC is at its first pericentre around the Milky Way (Besla et al. 2007) and its pericentric distance is too large (50 kpc) for the tidal forces to be effective.
The Sagittarius dwarf seems to be the most obvious candidate for a barred galaxy among the Local Group dSphs. Łokas et al. (2010) proposed an evolutionary model of this dwarf starting from a disk embedded in a dark matter halo. After the first pericentre passage the stellar component of the dwarf transforms into a bar that survives until the next pericentre which was identified as the present stage of the dwarf we observe. The shape of the dwarf at this time matches very well the actual elongated shape determined from observations by Majewski et al. (2003). The model also explains the lack of rotation signal in the data (Frinchaboy et al. 2012).
In this work we look in more detail into the properties of a tidally induced bar on a typical orbit around the Milky Way. In section 2 we present the simulation used for this study. In section 3 we describe the evolution of the dwarf galaxy using global measurements of its properties. Sections 4 and 5 focus on the strength and length of the bar, while section 6 is devoted to the pattern speed of the bar and its interpretation. The discussion follows in section 7.
2 The simulation
Our simulation setup consisted of live models of two galaxies: the Milky Way-like host and the dwarf galaxy. The -body realizations of both galaxies were generated via procedures described in Widrow & Dubinski (2005) and Widrow, Pym & Dubinski (2008). The procedures allow us to generate near-equilibrium models of galaxies composed of a disk, a bulge and a halo with required properties. Both our galaxies contained exponential disks embedded in NFW (Navarro, Frenk & White 1997) dark matter haloes. The dark haloes were smoothly truncated at the radius close to the virial radius in order to make their masses finite. Each component of each galaxy contained particles ( particles total).
The dwarf galaxy model was similar to the default model used in recent simulations of tidal stirring (Kazantzidis et al. 2011; Łokas et al. 2011). The dark halo of the dwarf had a mass M⊙ and concentration . The disk had a mass M⊙, exponential scale-length kpc and thickness . The coldness of the disk is controlled by the central radial velocity dispersion which we assume to be km s-1. This translates to the Toomre parameter at and guarantees that our dwarf is stable against formation of the bar in isolation for the time scales of interest here. We verified this by evolving the dwarf galaxy in isolation for 10 Gyr.
The host galaxy was chosen to resemble the model MWb of Widrow & Dubinski (2005). It had a dark matter halo of mass M⊙ and concentration . The disk of the host had a mass M⊙, the scale-length kpc and thickness kpc. The central radial velocity dispersion of the disk was km s-1 which corresponds to the Toomre parameter again making the disk stable against bar formation for time scales of interest.
Although there is evidence that the Milky Way has a bar (e.g. Blitz & Spergel 1991; Dwek et al. 1995; Martinez-Valpuesta & Gerhard 2011; Romero-Gómez et al. 2011), we specifically chose a model for the host galaxy that does not form a bar since this makes the host potential constant in time. The main reason for this choice is that we are most interested here in modeling the effect of the tidal forces on the growth and evolution of the bar in the dwarf. The presence of a time dependent bar in the Milky Way-like host would induce a second time dependence whose influence would be difficult to disentangle from the tidal effects. Furthermore, both observational (e.g. Stanek et al. 1997) and theoretical (e.g. Shen et al. 2010) studies indicate that the bar in the Milky Way is not very strong. Moreover, its half-length is of the order of 4 kpc, i.e. much smaller than our adopted pericentre distance. It is thus unlikely to significantly influence the evolution of the tidal bar in the dwarf. For simplicity we also neglect other components of the Milky Way structure such as the bulge, the stellar halo, the distinction into thin/thick disk etc. The mass of these components is at least a few times smaller than the disk mass we assume and probably of the order of the uncertainty of the mass distribution in the two main components (Widrow & Dubinski 2005).
We placed the dwarf galaxy initially at an apocentre of a typical, eccentric orbit around the Milky Way with apo- to pericentre distance ratio of kpc. Due to a rather small mass of the dwarf the orbit decays only a little in time as a result of dynamical friction. The dwarf’s disk, the disk of the Milky Way and the orbit were initially all coplanar and the dwarf’s disk was in prograde rotation with respect to the orbit. This configuration, together with the stability of the Milky Way’s disk, makes sure that the tidal forces experienced by the dwarf during the evolution are only controlled by the dwarf’s distance from the host galaxy and not by other subtle changes of the potential.
The evolution of the dwarf was followed for 10 Gyr using the GADGET-2 -body code (Springel, Yoshida & White 2001; Springel 2005) and we saved 201 simulation outputs, one every 0.05 Gyr (which is significantly smaller than the dynamical time of stars in the dwarf’s disk). The code configuration was that of Newtonian space with vacuum boundary conditions and the gravity calculations were done with a tree option. We adopted the softening scales of kpc and kpc for the disk and halo of the dwarf and kpc and kpc for the disk and halo of the Milky Way, respectively. These choices were informed by the study of Power et al. (2003) and allow to avoid strong discreteness and two-body effects in the case of systems of given characteristic scales and particle numbers.
3 Overview of the evolution
The repeated action of the tidal force from the Milky Way made the dwarf galaxy evolve as envisioned by the tidal stirring scenario originally proposed by Mayer et al. (2001) and studied in more detail by Klimentowski et al. (2009), Kazantzidis et al. (2011) and Łokas et al. (2011, 2012). The main signatures of such evolution involve the mass loss, the morphological transformation of the stellar component and the changes in the kinematics of the stars. Since we are interested here in the formation and evolution of the bar we focus on the latter two. In order to give an idea of the overall evolution of the dwarf we first perform rough measurements of the main, global features.
Inspection of the final state of the dwarf reveals that, in spite of the strong mass loss, it still possesses a well visible bound stellar component of radius of the order of 1 kpc. Therefore we may measure the properties of the dwarf at all times using stars within some fixed radius comparable to this value, or smaller. One could choose to measure the dwarf’s properties at some characteristic scale such as the radius where maximum circular velocity occurs (as was done in Klimentowski et al. 2009 and Kazantzidis et al. 2011), the half-light radius (Łokas et al. 2011, 2012) or the break radius (where the transition to the tidal tails occurs, see e.g. Łokas, Gajda & Kazantzidis 2013). However, the caveat of such measurements is that such radii also evolve in time and the interpretation of the results may not be straightforward.
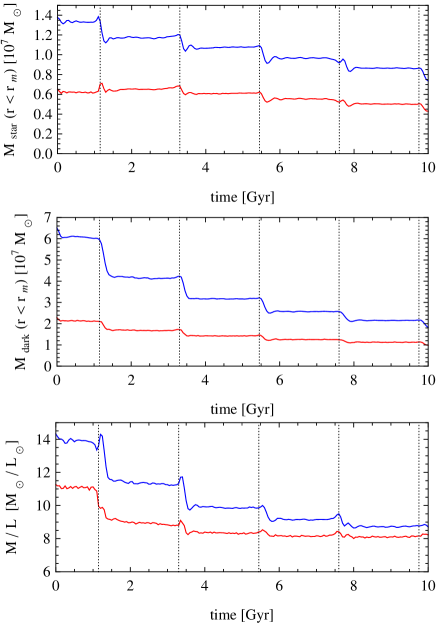
For each simulation output we determine the centre of the dwarf galaxy by calculating the centre of mass of the stars iteratively in decreasing radii until convergence is reached. We start the analysis of the properties of the dwarf galaxy by measuring the mass of stars and dark matter within a fixed radius from the centre of the dwarf equal to 1 and 0.5 kpc. The results are shown in the upper (stars) and middle (dark matter) panel of Figure 1 with the red curve corresponding to measurements within kpc and the blue one within kpc. In the lower panel of the Figure we also plot the mass-to-light ratio within these radii assuming M⊙/L⊙ for the stars. The results show that mass in both components is systematically lost from within both limiting radii, except for the period after the first pericentre passage where the stellar content within 0.5 kpc is not diminished. The mass-to-light ratio systematically decreases to converge to about M⊙/L⊙ at the end of the evolution. This means that dark matter is stripped more efficiently than stars and that the stripping affects even the inner part of the dwarf where the measurements were done.
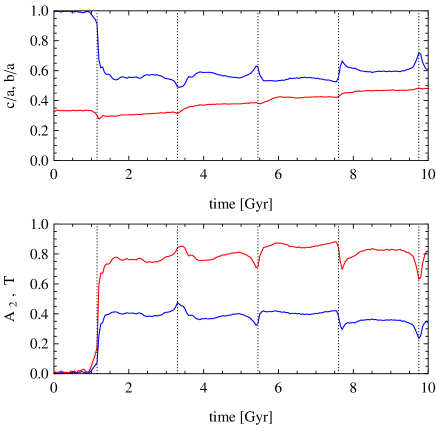
To make sure we include a sufficient number of stars from the main body of the dwarf and at the same time avoid the contamination from the tidal tails for all the following measurements discussed in this section we fix the maximum radius at kpc. We note that the results of the measurements do not depend strongly on this choice. Thus, for each output we select stars within , find the principal axes of the stellar component from the tensor of inertia and rotate the stellar positions and velocities to align them with the principal axes. In the following we will always refer to the major, intermediate and minor axis of the stellar component as , and respectively and the corresponding axis lengths as , and . Having aligned the stellar distribution in this way we estimated the axis ratios as a function of time. The results in terms of and are shown in the upper panel of Figure 2 as the red and blue line, respectively. At the first pericentre passage the value drops significantly from the initial characteristic of the disk, while stays roughly at the same level. This means that the initial disk transforms into a triaxial stellar component. This triaxial shape is maintained until the end of the simulation, although both and increase.


The properties of the shape are further illustrated in the lower panel of Figure 2 where the red line shows the triaxiality parameter . The values of the parameter indicate the oblate shape, the values a triaxial shape and a prolate shape. With almost at all outputs after the first pericentre we conclude that the shape of the stellar component is decidedly prolate. This strongly suggests that at the first pericentre passage the stellar component of the dwarf formed a bar. To confirm this statement we also measured the bar mode from the positions of the stars projected onto the plane (along the shortest axis). In general, the amplitude of the th Fourier mode of the discrete distribution of stars in the simulated galaxy is calculated as where are the particle phases in cylindrical coordinates and is the total number of stars (Sellwood & Athanassoula 1986; Debattista & Sellwood 2000). The value of the bar mode is shown with the second (blue) line in the lower panel of Figure 2. As values of are above 0.2 at all times after the first pericentre we conclude that indeed a bar is formed at this time and this shape persists until the end of the simulation.
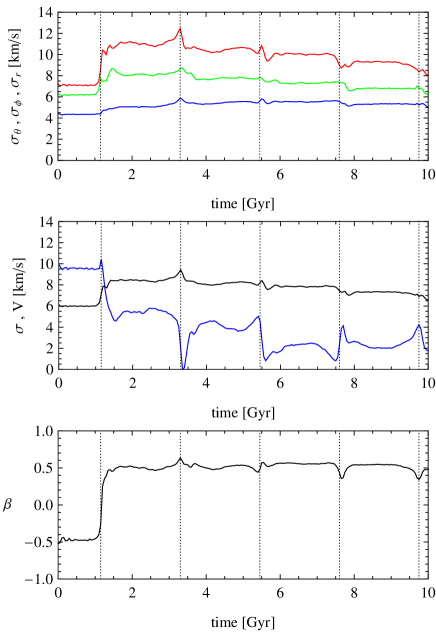
This conclusion is further supported by the measurements of the kinematic properties of the stellar component. The kinematic measurements were performed using a system of spherical coordinates such that at every simulation output the angle measures the angular distance from the shortest axis () of the stellar component, while is measured in the plane. In the upper panel of Figure 3 we plot the velocity dispersions of the stars in the three coordinates. The three lines from the top to the bottom correspond to (red), (green) and (blue) respectively. At the first pericentre passage all dispersions increase, signifying the transition from the overall streaming motion of the stars (rotation) to the random motions manifesting themselves via the velocity dispersion. However, the radial dispersion increases most as expected in the case of the formation of a bar which is supported by more radial orbits. Later on the dispersions decrease due to mass loss, except for which remains roughly constant as a result of the thickening of the stellar component in time.
The middle panel of Figure 3 shows the overall contribution of random versus ordered motion in terms of a 1D velocity dispersion (black line) and the mean velocity (blue line) around the shortest axis (along the coordinate of the spherical system, ) i.e. the rotation velocity. The overall trend is for the rotation to decrease (especially at the first pericentre passage) and the dispersion to remain roughly constant in time or slightly decrease due to mass loss. The transition from mostly circular orbits of the stars (in the initial disk) to more radial orbits in the bar is also very well visible in the evolution of the anisotropy parameter of the stars where the second velocity moment includes rotation. The dependence of on time is shown in the lowest panel of Figure 3. Clearly, the circular orbits of stars () in the initial disk are replaced after the first pericentre by more radial orbits () which survive until the end of the simulation.
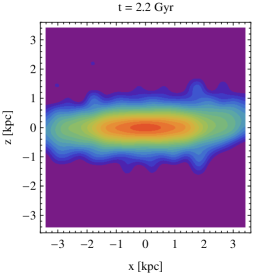
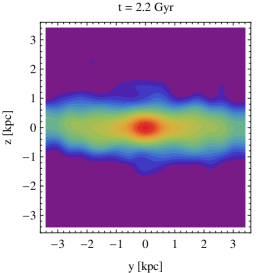
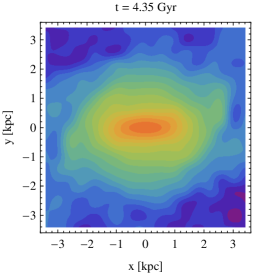
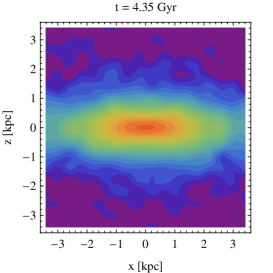
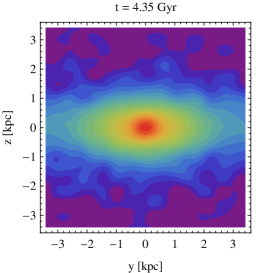
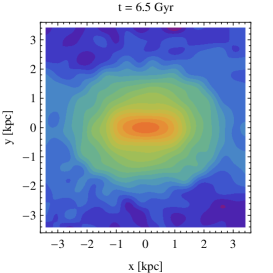
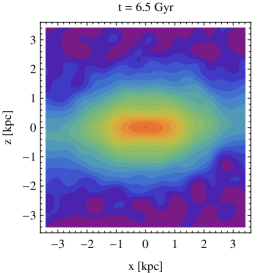
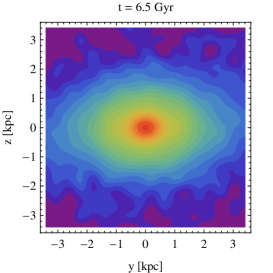
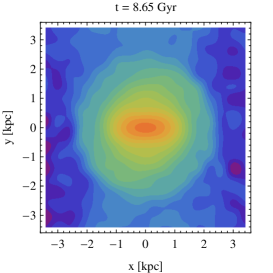
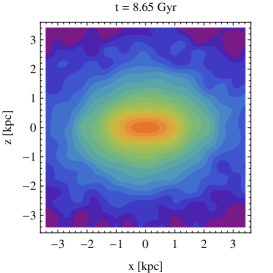
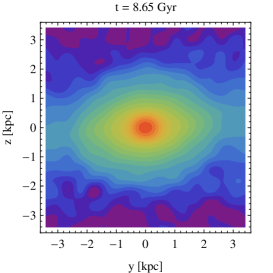
Figure 4 shows the surface density distributions of the stars in the dwarf at subsequent apocentres of the orbit (from the second at Gyr to the fifth at Gyr). The rows of the Figure correspond to the different times of the simulation, while the columns to different lines of sight: along the shortest (face-on), intermediate (side-on) and longest (end-on) axis of the stellar distribution (as determined from stars within 0.5 kpc). In the left and middle column the line of sight is perpendicular to the bar and the bar is clearly visible. At the second apocentre (at Gyr) the stellar component of the dwarf is still restricted to the initial plane of the disk. At later times the stellar component becomes thicker and at the final apocentre the outer density contours are almost spherical while the bar-like shape is only preserved in the central part of the dwarf.
4 The strength of the bar
In the previous section we measured the global properties of the dwarf galaxy as a function of time, finding convincing evidence for the formation of a bar after the first pericentre. The strength of the bar can be quantified in more detail by measuring the profile of the bar mode as a function of a cylindrical radius . The coordinate system for these measurements was chosen so that is in the disk equatorial plane () as determined previously from the principal axes of the stellar component within 0.5 kpc.
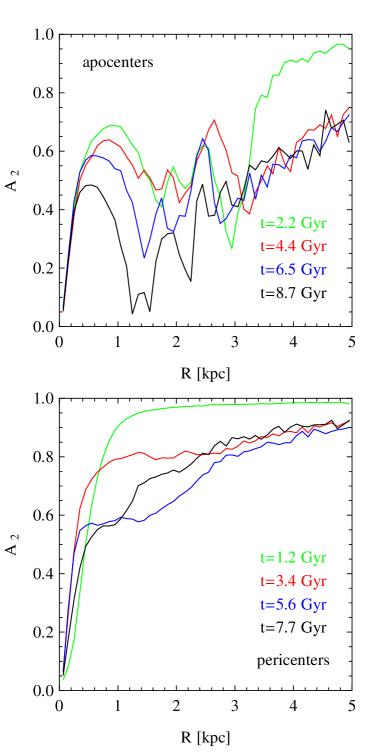
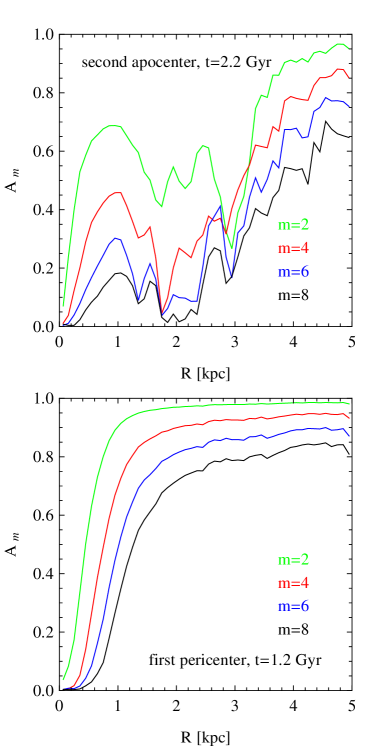
The measurements of the values of the bar mode as a function of are shown in Figure 5 at subsequent apocentres (upper panel) and pericentres (lower panel). At pericentres the dwarf is stretched by tidal forces from the Milky Way so that the bar mode increases monotonically with radius. At apocentres, when the dwarf recovers its equilibrium, the bar mode displays a characteristic shape, growing with radius up to a maximum value and then decreasing. After reaching a minimum value, increases again as we transit from the bound component of the dwarf to the tidal tails. The tidal tails are symmetrical elongated features on both sides of the dwarf (see e.g. Łokas et al. 2013) which obviously results in the approaching unity at large radii. The maximum value of the mode decreases with time which means that the bar becomes weaker as the evolution proceeds, a feature that was not obvious from the global single-value measurement of shown in the lower panel of Figure 2.
It is also instructive to look at the higher order Fourier modes of the distribution of the stars. Figure 6 compares the profiles of the non-zero even modes with at the second apocentre (upper panel) and the first pericentre (lower panel). We note that the odd modes (not shown) all have very low amplitudes within the main body of the dwarf which means that the distribution of the stars is symmetrical. The measurements of even modes show that while the even modes are systematically lower than the most significant bar mode and preserve the hierarchy at all times, they nevertheless assume values decidedly different from zero. This means that the density distribution in the tidally induced bar in our simulation cannot be described by the alone but higher even order components are not negligible. Interestingly, the same behaviour was seen in simulated galaxies forming bars in isolation by Athanassoula & Misiriotis (2002, their figure 7) and by Ohta, Hamabe & Wakamatsu (1990) who studied surface photometry of six real barred spirals (see their figure 4). Such a hierarchy of modes thus seems to be a general feature of barred galaxies, independent of their size and of the way they formed.
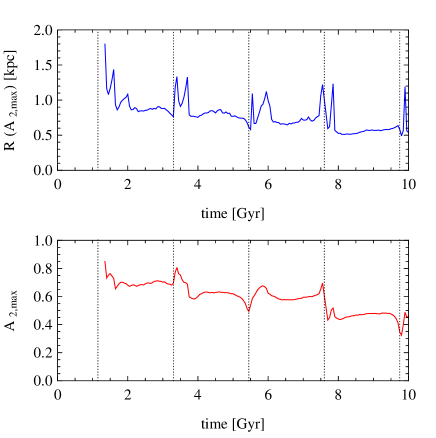
We adopt the maximum value of the bar mode as the measure of the strength of the bar. Figure 7 shows in the upper panel the cylindrical radius at which the first maximum of the bar mode occurs as a function of time. The measurements are only significant between pericentres since near pericentres the profile of is increasing and there is no well defined maximum (see Figure 5). The lower panel of the Figure plots the value of the maximum bar mode as a function of time. These detailed measurements confirm the impression from Figure 5: in the long run the maximum of the bar mode decreases from about 0.7 after the first pericentre to about 0.45 after the fourth one. Thus we conclude that the bar becomes weaker in time and the changes in the bar strength are most significant at pericentres while between them remains roughly constant.
5 The length of the bar
Athanassoula & Misiriotis (2002) discussed different ways to measure the bar length. In priciple, the profiles of such as those shown in Figure 5 could be used to determine the length of the bar. Such a procedure works in general for simulated bars forming in isolated disk galaxies as in such cases the profile of declines smoothly after reaching the maximum value. One can then find e.g. the radius where drops to some fraction (e.g. ) of the maximum value and use this scale as the measure of the bar length. In our case however, the profile does not always drop sufficiently before it starts to increase again due to the transition to the tidal tails. One solution would be to find a minimum of and adopt the corresponding scale as the length of the bar. However, even after smoothing our profiles are rather noisy and such measurements result in very imprecise estimates of the bar length.
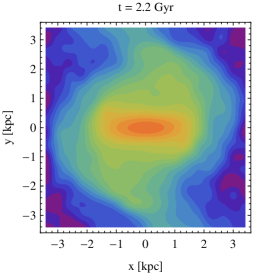
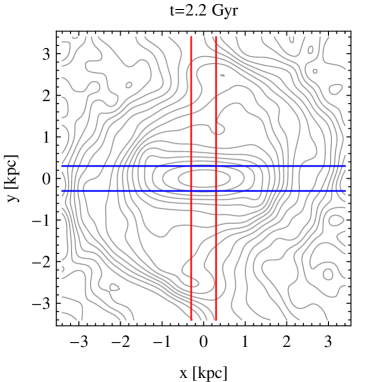
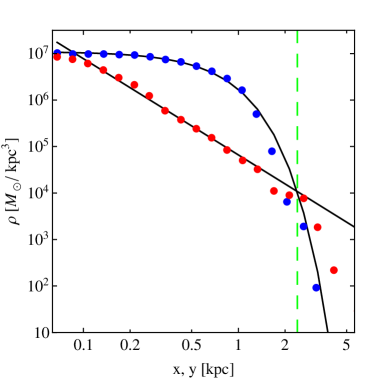
We therefore measured the length of the bar using a different approach, similar to method (v) discussed by Athanassoula & Misiriotis (2002, section 8). Namely, we calculated the density of stars along the bar major axis (i.e. along the axis of the stellar component) and perpendicular to it (along the axis) in cylinders of radius 0.3 kpc and logarithmic bins in and . An example of such measurements after Gyr from the start of the simulation (second apocentre) is shown in the upper panel of Figure 8. The contours indicate equal levels of surface density of stars similar to those plotted in Figure 4 with the bar well visible along the axis in the inner part of the picture. The cylinders of stars selected for the measurements are indicated with blue (along the bar) and red (perpendicular to the bar) lines. The measured density profiles are plotted as dots of the corresponding colours in the lower panel of Figure 8. As expected, the measurement along the bar (blue points) is rather flat in the centre, reflecting the approximately constant density distribution of the stars in the bar. The difference between the densities measured in the two directions first grows with radius and then the two converge. We will adopt the scale where the two densities converge as the measurement of the length of the bar.
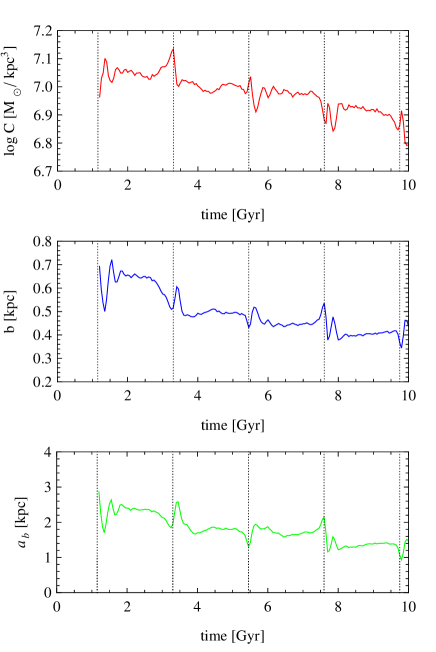
In order to avoid the noise due to the limited number of stars in the outer bins we fitted the profiles with analytic functions. We find that the density along the bar is well approximated at all times by an exponential where is the normalization constant and is the characteristic scale-length. The density distribution perpendicular to the bar is well approximated by a simple power law . For every simulation output we measured the density profiles in this way and fitted the formulae to the measurements. The fitted values of the and parameters of the density distribution along the bar are especially interesting and their evolution is shown as a function of time in the upper and middle panel of Figure 9. We see that the values of both parameters decrease in time reflecting the stripping of the stars (decrease of normalization) and shortening of the bar (decrease of scale-length). The parameters of the power-law fit do not show any clear trend in time. Both the normalization and the power-law index stay roughly constant in time with in the range of 2-2.5. We note that the particular choice of the fitting formulae does not have to apply to other kinds of bars. We used them mainly as a tool to smooth the results of bar length measurements and because the formulae were general enough to accommodate the density profiles of our bar at all times.
Solving with the fitted parameters we find for each simulation output the scale at which both density profiles converge. The scale, which we identify with the length of the bar, , is plotted as a function of time in the lower panel of Figure 9. The length of the bar thus decreases during the evolution from kpc after the first pericentre to kpc after the fourth. Note that the decrease of the bar length occurs mainly at pericentre passages so it is due to tidal shocking and not to secular evolution since between pericentres the length remains approximately constant in time.
6 The pattern speed of the bar
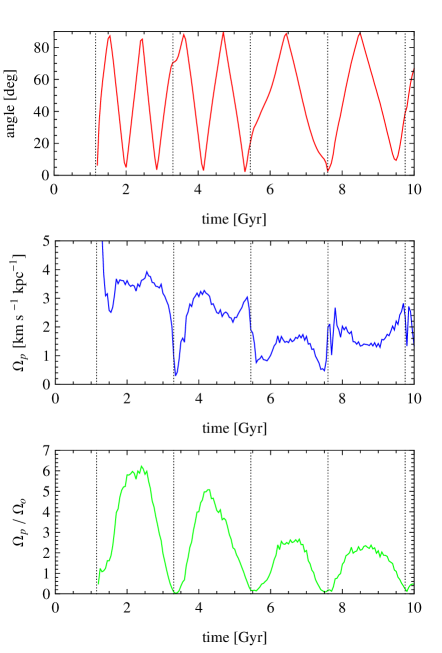
We finally also look at the pattern speed of the bar. The simplest way to visualize its variability is to measure the angle between the major axis of the stellar component and a fixed axis of the simulation box. For this measurement we use the orientation of the major axis determined as before using stars within a constant radius of 0.5 kpc. The angle between the major axis of the bar and a fixed axis in the initial orbital plane of the dwarf is shown as a function of time in the upper panel of Figure 10. At each output we calculated the angle between the fixed axis and the nearest part of the bar, which is why the angle is always in the range between 0 and 90 degrees. The measurements start after the first pericentre when the bar is formed. The bar lies almost exactly in the orbital plane of the dwarf at all times as indicated by the values of the angle covering the whole range of 0-90 degrees. The tumbling of the bar seems much slower in the second half of the evolution (after the third pericentre passage), as shown by the much slower changes of the angle.
The actual pattern speed calculated as a change between the directions of the bar’s major axis in subsequent simulation outputs is plotted in the middle panel of Figure 10. The pattern speed decreases in the long run but shows a rather strong variability, mostly at the pericentre passages, but not only. We note that the variability of the pattern speed mirrors closely our measurements of the mean rotation velocity of the stars discussed in section 3 (see the blue line in the middle panel of Figure 3). This means that after the first pericentre the rotation is mostly due to the tumbling of the bar.
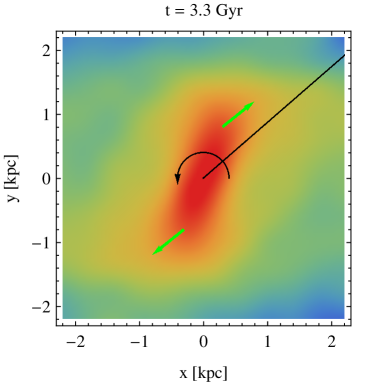
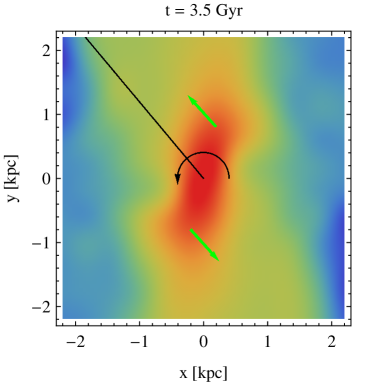
A particularly interesting behaviour occurs at the second pericentre passage when the pattern speed drops almost to zero, i.e. the bar almost stops rotating but then speeds up again. The variation of the pattern speed at this moment (and its general evolution) can be understood by referring to Figure 11 where we show the orientation of the bar with respect to the direction towards the centre of the Milky Way. The upper and lower panel show respectively the projections of the stellar component onto the orbital plane at and Gyr, that is just before and just after the second pericentre. The circular arrow in the centres marks the anti-clockwise direction of the bar’s rotation. In each panel the solid black line indicates the direction towards the Milky Way and the two green arrows show the direction of tidal forces acting on the two sides of the bar. At the earlier time depicted in the Figure (upper panel) the torque due to the tidal forces is directed so that it slows the bar. At the later time (lower panel) the orientation of the bar with respect to the direction to the Milky Way changes and the torque now speeds up the bar. The result is for the bar to regain the pattern speed up to almost the same level as before the pericentre.
The subsequent changes of the pattern speed, the more violent ones at pericentres, as well as the milder ones between pericentres can all be traced to a particular orientation of the bar with respect to the tidal force acting at a given time. In particular, at the third pericentre passage the bar is systematically slowed down (the orientation is similar as in the upper panel of Figure 11), while at the fourth pericentre the bar is continuously accelerated (the orientation is similar as in the lower panel of Figure 11).
It is also interesting to compare the pattern speed of the bar to the angular velocity of the dwarf galaxy on its orbit . The ratio of the two quantities is plotted in the lower panel of Figure 10. At pericentres the dwarf obviously moves very fast on its rather eccentric orbit so the ratio is close to zero. Between pericentres the ratio increases up to a factor of a few and at apocentres is never below two. Note that would mean that the bar is tidally locked as the Moon is locked to the Earth and only one and always the same side of the bar would be directed towards the Milky Way. This is clearly not the case. However, an interesting evolutionary stage takes place near the fourth apocentre of the orbit ( Gyr) when and the angle between the bar and the direction to the Milky Way stays in the range of degrees. This points to a possibility of a 5/2 resonance between the rotational and orbital motion of the bar, similar to the 3/2 resonance of Mercury around the Sun (Correia & Laskar 2004).
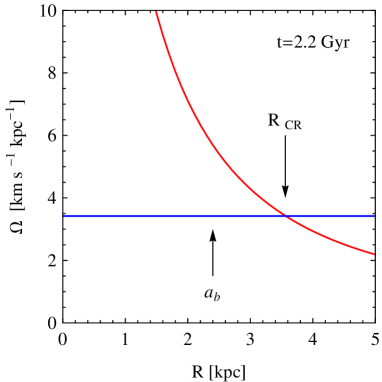
Finally, we estimate the speed of the bar in terms of the quantity where is the corotation radius (where the circular frequency of the dwarf galaxy equals the pattern speed ) and is the length of the bar estimated in the previous section. According to theory of bars (Binney & Tremaine 2008) they can only exist at radii so all bars have and are classified as fast if or slow when . We calculated the corotation radii for a number of outputs and compared them with corresponding bar lengths. An example of such a comparison for the second apocentre ( Gyr) is shown in Figure 12. The red line is the circular frequency of the dwarf galaxy as a function of radius (calculated with radial step of 0.1 kpc) and the blue line is the pattern speed from the middle panel of Figure 10. The two are equal at kpc while the bar length at this time is kpc (see the lower panel of Figure 9). This gives us , a value not very different from unity, thus the bar at this stage may be classified as fast.
| apocentre | time | |||
|---|---|---|---|---|
| [Gyr] | [kpc] | [kpc] | ||
| 2 | 2.2 | 3.6 | 2.4 | 1.5 |
| 3 | 4.35 | 3.4 | 1.8 | 1.9 |
| 4 | 6.5 | 4.7 | 1.6 | 3.0 |
| 5 | 8.65 | 4.4 | 1.3 | 3.3 |
Similar calculations at all apocentres give the results listed in Table LABEL:tablespeed. We restricted ourselves to the measurements at apocentres because near pericentres the pattern speed varies strongly and in particular can be very low which leads to high and thus meaningless estimates of the corotation radius. We see that at subsequent apocentres the values of systematically increase, up to at the last apocentre, so the bar becomes slower with time. This result is not obvious at first sight because and behave differently in time. While the bar length decreases monotonically between apocentres (see Table LABEL:tablespeed), the increases or decreases with time. The latter is itself a combination of the circular frequency, which decreases monotonically with time as a result of mass loss, and the pattern speed, which does not have an obvious monotonic behaviour. The overall measure of the bar speed in terms of confirms however the general impression from the behaviour of the much simpler quantity such as the mean rotation velocity (see the middle panel of Figure 3) or the mean angular momentum which behaves in a way very similar to the rotation velocity.
The main physical reason for the slow-down of the bar over large time scales can be traced to the effect of tidal stripping of the stars which happens preferentially to stars on prograde orbits (as is the case in our simulation) due to resonances between the orbital and intrinsic motion of the stars (D’Onghia et al. 2010). The stripped stars feed the tidal tails of the dwarf galaxy and move on their own orbits around the Milky Way. Thus the angular momentum of the stars is taken by the stripped stars and not transferred to the dark matter particles of the dwarf’s halo as the angular momentum of the halo does not significantly change during the evolution.
7 Discussion
We studied the formation and evolution of a stellar bar induced in a disky dwarf galaxy orbiting the Milky Way by tidal forces from the host. We measured the main properties of the bar such as its strength, length and pattern speed as a function of time and related the pattern speed to the dwarf’s circular frequency. The comparison between the two quantities led us to conclude that while the bar is quite fast at its birth after the first pericentre passage, it becomes slower with time. This has important consequences for understanding the process of formation of dwarf spheroidal galaxies of the Local Group.
As the tidal evolution proceeds, the bar becomes shorter and thicker and the stellar component changes its shape towards spherical. One could attempt to explain the shortening of the bar as due to the mass loss that results in decreasing the circular frequency of the dwarf. If the pattern speed of the bar remained constant in time, the corotation radius would also decrease. Since the bar cannot extend beyond the corotation radius, this would explain why it becomes shorter and thus relate the mass loss to the morphological transformation. The actual behaviour, however, turns out to be more complicated. As we demonstrated in the previous sections, the pattern speed of the bar is not constant but subject to abrupt changes near pericentres and more benign ones in the other parts of the orbit, depending on the orientation of the bar major axis with respect to the direction of the tidal force. This causes the corotation radius to vary non-monotonically with time. There is thus no simple relation between the length of the bar and the corotation radius. The bar seems to become shorter just due to randomization of stellar orbits resulting from tidal shocking.
It seems to be generally believed that a common intermediate stage of the evolution of disky dwarfs towards a more spherical shape is that of bar buckling. Buckling seemed to occur in a large fraction of the cases of tidally induced bars studied by Mayer et al. (2001). They claimed that buckling contributes to the heating of the disk even more than the tidal heating itself. The occurrence of buckling is usually accompanied by an increase of the ratio of velocity dispersions along the shortest axis and in the bar plane and by non-zero amplitude of the odd Fourier mode in the edge-on view (e.g. Martinez-Valpuesta et al. 2006). We have looked for signatures of bending instabilities in our bar by measuring the ratio as a function of time (for stars within radius of 1 kpc). This ratio is close to 0.4 after the first pericentre when the bar forms and increases steadily with time to about 0.6 at the end of the evolution. There is no abrupt increase of that would signify the presence of buckling. We have also measured the mode for the stars seen along the intermediate axis (as in the middle column of Figure 4) and did not find it significantly different from zero.
The actual presence of buckling was only detected by visual inspection of surface density maps such as those in Figure 4. Slight asymmetries in the distribution of stars with respect to the bar plane in the edge-on view were observed for a brief period between 3.5 and 3.8 Gyr from the start of the simulation, that is soon after the second pericentre passage. As expected, the occurrence of buckling was accompanied by the decrease in the bar strength ( and ) seen in the lower panels of Figures 2 and 7 at these times. This brief period of buckling instability was followed by the formation of the boxy/peanut shape visible in the edge-on view of the surface distribution of stars at Gyr in Figure 4.
In this paper, we explored the properties of the tidally induced bar only in one initial and rather special configuration, that of coplanar disks of the dwarf and the host galaxy and the dwarf’s disk rotation exactly prograde with respect to the orbital motion. While the orientation of the Milky Way disk with respect to the orbital plane of the dwarf seems of little consequence, the angle between the dwarf disk’s angular momentum and the orbital angular momentum has dramatic consequences. Preliminary simulations show that if the dwarf disk orientation is exactly retrograde the bar does not form at all and the dwarf’s stellar component remains disky. For intermediate orientations the bar does form but it is typically weaker than in the case studied here. The dependence of the properties of tidally induced bars on this and other parameters will be discussed in follow-up papers.
Acknowledgements
This research was supported in part by PL-Grid Infrastructure, by the Polish National Science Centre under grants NN203580940, 2013/10/A/ST9/00023 and the Polish-French HECOLS collaboration including grant 2013/08/M/ST9/00664. EA acknowledges financial support to the DAGAL network from the People Programme (Marie Curie Actions) of the European Union’s Seventh Framework Programme FP7/2007-2013/ under REA grant agreement number PITN-GA-2011-289313. She also acknowledges financial support from the CNES (Centre National d’Etudes Spatiales - France). We are grateful to the organizers and participants of the conference “The Role of Bars in Galaxy Evolution” in Granada in May 2013 for inspiration and discussions. We would like to thank L. Widrow for providing procedures to generate -body models of galaxies for initial conditions. ELŁ is grateful for the hospitality of Laboratoire d’Astrophysique de Marseille at the time of her visit and AdP for the hospitality of the Copernicus Center in Warsaw during his visit. MS, GG and KK acknowledge the summer student program of the Copernicus Center.
References
- [Athanassoula(2002)] Athanassoula E., 2002, ApJ, 569, L83
- [Athanassoula(2003)] Athanassoula E., 2003, MNRAS, 341, 1179
- [Athanassoula(2005)] Athanassoula E., 2005, MNRAS, 358, 1477
- [Athanassoula(2013)] Athanassoula E., 2013, in Falcón-Barroso J., Knapen J. H., eds, Secular Evolution of Galaxies. Cambridge Univ. Press, Cambridge, UK, p. 305
- [Athanassoula & Misiriotis(2002)] Athanassoula E., Misiriotis A., 2002, MNRAS, 330, 35
- [Athanassoula & Sellwood(1986)] Athanassoula E., Sellwood J. A., 1986, MNRAS, 221, 213
- [Athanassoula et al.(2013)] Athanassoula E., Machado R. E. G., Rodionov S. A., 2013, MNRAS, 429, 1949
- [Besla et al.(2007)] Besla G., Kallivayalil N., Hernquist L., Robertson B., Cox T. J., van der Marel R. P., Alcock C., 2007, ApJ, 668, 949
- [Binney(1978)] Binney J., 1978, MNRAS, 183, 779
- [Binney & Tremaine(2008)] Binney J., Tremaine S., 2008, Galactic Dynamics: Second Edition. Princeton Univ. Press, Princeton, NJ
- [Blitz & Spergel(1991)] Blitz L., Spergel D. N., 1991, ApJ, 379, 631
- [Cheung et al.(2013)] Cheung E. et al., 2013, ApJ, 779, 162
- [Coleman et al.(2007)] Coleman M. G. et al., 2007, ApJ, 668, L43
- [Combes et al.(1990)] Combes F., Debbasch F., Friedli D., Pfenniger D., 1990, A&A, 233, 82
- [Correia & Laskar(2004)] Correia A. C. M., Laskar J., 2004, Nature, 429, 848
- [Debattista & Sellwood(2000)] Debattista V. P., Sellwood J. A., 2000, ApJ, 543, 704
- [D’Onghia et al.(2010)] D’Onghia E., Vogelsberger M., Faucher-Giguere C.-A., Hernquist L., 2010, ApJ, 725, 353
- [Dubinski et al.(2009)] Dubinski J., Berentzen I., Shlosman I., 2009, ApJ, 697, 293
- [Dwek et al.(1995)] Dwek E. et al., 1995, ApJ, 445, 716
- [Frinchaboy et al.(2012)] Frinchaboy P. M., Majewski S. R., Muñoz R. R., Law D. R., Łokas E. L., Kunkel W. E., Patterson R. J., Johnston K. V., 2012, ApJ, 756, 74
- [Gerin et al.(1990)] Gerin M., Combes F., Athanassoula E., 1990, A&A, 230, 37
- [Kazantzidis et al.(2011)] Kazantzidis S., Łokas E. L., Callegari S., Mayer L., Moustakas L. A., 2011, ApJ, 726, 98
- [Klimentowski et al.(2009)] Klimentowski J., Łokas E. L., Kazantzidis S., Mayer L., Mamon G. A., 2009, MNRAS, 397, 2015
- [Klypin et al.(2009)] Klypin A., Valenzuela O., Colín P., Quinn T., 2009, MNRAS, 398, 1027
- [Lansbury et al.(2014)] Lansbury G. B., Lucey J. R., Smith R., 2014, MNRAS, 439, 1749
- [Lokas et al.(2010)] Łokas E. L., Kazantzidis S., Majewski S. R., Law D. R., Mayer L., Frinchaboy P. M., 2010, ApJ, 725, 1516
- [Lokas et al.(2011)] Łokas E. L., Kazantzidis S., Mayer L., 2011, ApJ, 739, 46
- [Lokas et al.(2012)] Łokas E. L., Majewski S. R., Kazantzidis S., Mayer L., Carlin J. L., Nidever D. L., Moustakas L. A., 2012, ApJ, 751, 61
- [Lokas et al.(2013)] Łokas E. L., Gajda G., Kazantzidis S., 2013, MNRAS, 433, 878
- [Majewski et al.(2003)] Majewski S. R., Skrutskie M. F., Weinberg M. D., Ostheimer J. C., 2003, ApJ, 599, 1082
- [Martinez-Valpuesta & Gerhard(2011)] Martinez-Valpuesta I., Gerhard O., 2011, ApJ, 734, L20
- [Martinez-Valpuesta et al.(2006)] Martinez-Valpuesta I., Shlosman I., Heller C., 2006, ApJ, 637, 214
- [Mayer & Wadsley(2004)] Mayer L., Wadsley J., 2004, MNRAS, 347, 277
- [Mayer et al.(2001)] Mayer L., Governato F., Colpi M., Moore B., Quinn T., Wadsley J., Stadel J., Lake G., 2001, ApJ, 559, 754
- [Miller & Smith(1979)] Miller R. H., Smith B. F., 1979, ApJ, 227, 785
- [Miwa & Noguchi(1998)] Miwa T., Noguchi M., 1998, ApJ, 499, 149
- [Munoz et al.(2010)] Muñoz R. R., Geha M., Willman B., 2010, AJ, 140, 138
- [Navarro et al.(1997)] Navarro J. F., Frenk C. S., White S. D. M., 1997, ApJ, 490, 493 (NFW)
- [Ohta et al.(1990)] Ohta K., Hamabe M., Wakamatsu K.-I., 1990, ApJ, 357, 71
- [Pfenniger(1984)] Pfenniger D., 1984, A&A, 134, 373
- [Power et al.(2003)] Power C., Navarro J. F., Jenkins A., Frenk C. S., White S. D. M., Springel V., Stadel J., Quinn T., 2003, MNRAS, 338, 14
- [Raha et al.(1991)] Raha N., Sellwood J. A., James R. A., Kahn F. D., 1991, Nature, 352, 411
- [Romano-Diaz et al.(2008)] Romano-Díaz E., Shlosman I., Heller C., Hoffman Y., 2008, ApJ, 687, L13
- [Romero-Gomez et al.(2011)] Romero-Gómez M., Athanassoula E., Antoja T., Figueras F., 2011, MNRAS, 418, 1176
- [Saha & Naab(2013)] Saha K., Naab T., 2013, MNRAS, 434, 1287
- [Saha et al.(2013)] Saha K., Pfenniger D., Taam R. E., 2013, ApJ, 764, 123
- [Sellwood & Athanassoula(1986)] Sellwood J. A., Athanassoula E., 1986, MNRAS, 221, 195
- [Sellwood & Wilkinson(1993)] Sellwood J. A., Wilkinson A., 1993, Reports on Progress in Physics, 56, 173
- [Shen et al.(2010)] Shen J., Rich R. M., Kormendy J., Howard C. D., De Propris R., Kunder A., 2010, ApJ, 720, L72
- [Sheth et al.(2008)] Sheth K. et al., 2008, ApJ, 675, 1141
- [Sheth et al.(2012)] Sheth K. et al., 2012, ApJ, 758, 136
- [Skokos et al.(2002a)] Skokos Ch., Patsis P. A., Athanassoula E., 2002a, MNRAS,333, 847
- [Skokos et al.(2002b)] Skokos Ch., Patsis P. A., Athanassoula E., 2002b, MNRAS,333, 861
- [Sparke & Sellwood(1987)] Sparke L. S., Sellwood J. A., 1987, MNRAS, 225, 653
- [Springel(2005)] Springel V., 2005, MNRAS, 364, 1105
- [Springel et al.(2001)] Springel V., Yoshida N., White S. D. M., 2001, New Astronomy, 6, 79
- [Stanek et al.(1997)] Stanek K. Z., Udalski A., Szymański M., Kałużny J., Kubiak Z. M., Mateo M., Krzemiński W., 1997, ApJ, 477, 163
- [Sundin et al.(1993)] Sundin M., Donner K. J., Sundelius B., 1993, A&A, 280, 105
- [Widrow & Dubinski(2005)] Widrow L. M., Dubinski J., 2005, ApJ, 631, 838
- [Widrow et al.(2008)] Widrow L. M., Pym B., Dubinski J., 2008, ApJ, 679, 1239
- [Wills et al.(2000)] Wills K. A., Das M., Pedlar A., Muxlow T. W. B., Robinson T. G., 2000, MNRAS, 316, 33