Permanent address: ]Institute of Laser Physics of SB RAS, Pr. Lavrentyeva 13/3, Novosibirsk, 630090 Russia
A widely tunable 10-m quantum cascade laser phase-locked to a state-of-the-art mid-infrared reference for precision molecular spectroscopy
Abstract
We report the coherent phase-locking of a quantum cascade laser (QCL) at 10-m to the secondary frequency standard of this spectral region, a CO2 laser stabilized on a saturated absorption line of OsO4. The stability and accuracy of the standard are transferred to the QCL resulting in a line width of the order of 10 Hz, and leading to our knowledge to the narrowest QCL to date. The locked QCL is then used to perform absorption spectroscopy spanning 6 GHz of NH3 and methyltrioxorhenium, two species of interest for applications in precision measurements.
With their rich internal structure, molecules can play a decisive role in precision tests of fundamental physics. They are being used to test fundamental symmetries such as parity Daussy et al. (1999); DeMille et al. (2008); Darquié et al. (2010) or parity and time reversal Baron et al. (2014), to measure absolute values of fundamental constants Koelemeij et al. (2007); Lemarchand et al. (2013); Moretti et al. (2013) and their possible temporal variation Hudson et al. (2006); Shelkovnikov et al. (2008); Truppe et al. (2013). Many of these experiments can be cast as measurements of resonance frequencies of molecular transitions, for which ultra-stable and accurate sources in the mid-infrared (mid-IR) are highly desirable, since most rovibrational transitions are to be found in that region.
Our group has a long-standing interest in performing spectroscopic precision measurements on molecules at extreme resolutions around m Daussy et al. (1999); Ziskind et al. (2002); Shelkovnikov et al. (2008). We are currently working on two such measurements: the determination of the Boltzmann constant, , by Doppler spectroscopy of ammonia Lemarchand et al. (2011, 2013) and the first observation of parity violation by Ramsey interferometry of a beam of chiral molecules Darquié et al. (2010); Tokunaga et al. (2013). For these experiments, we currently use spectrometers based on custom built ultra-stable CO2 lasers. We obtain the required metrological frequency stability and accuracy — 10 Hz line width, 1 Hz stability at 1 s, accuracy of a few tens of hertz Bernard et al. (1997); Acef, Michaud, and Rovera (1999) — by stabilizing these lasers to saturated absorption lines of molecules such as OsO4. CO2 lasers have a major shortcoming: a lack of tunability. They emit at CO2 molecular resonances. An emission line is found every 30 to 50 GHz in the 9-11 m wavelength range, and each line is tunable over about 100 MHz. Although, as in our spectrometers, this range can be extended a few gigahertz using electro-optical modulators (EOMs), this is done at the expense of power (EOMs at these wavelengths have an efficiency of 10-4) and necessitates subsequent spectral filtering. Overcoming these difficulties without the loss of stability is key to enabling precision measurements in the mid-IR.
One solution would be to use frequency comb-referenced continuous-wave (cw) Galli et al. (2011); Bressel, Ernsting, and Schiller (2012); Ricciardi et al. (2012) or femtosecond Schliesser, Picqué, and Hänsch (2012) mid-IR sources. These are based on frequency mixing in nonlinear crystals and provide absolute-frequency referencing, reasonable line widths and tunability, but are very complex and often exhibit limited power. By comparison, cw quantum cascade lasers (QCLs) are a new mature and robust technology that offer broad and continuous tuning over several hundred gigahertz at 100 mW-level powers. Several can be combined giving access to the whole mid-IR region. Recent studies of the emission spectrum of cw free-running distributed-feedback (DFB) QCLs Myers et al. (2002); Bartalini et al. (2010); Tombez et al. (2011); Bartalini et al. (2011); Mills et al. (2012) confirm their suitability for high resolution spectroscopy and frequency metrology. Furthermore, narrow-emission, absolutely referenced mid-IR QCLs have been demonstrated, either by phase-locking to a CO2 laser Bielsa et al. (2007, 2008), frequency locking to a sub-Doppler molecular transition Cappelli et al. (2012), optical injection locking Borri et al. (2012) or phase-locking Mills et al. (2012); Hansen et al. (2013); Galli et al. (2013) to narrow optical frequency comb-based sources. Sub-kHz emission line widths, corresponding to relative stabilities in the high , and accuracies of a few have been shown Galli et al. (2013). Note however that most of this work has been done using QCLs emitting around 4-m. Work at longer wavelengths (including most of the molecular fingerprint region) has remained scarce (see refs. Bielsa et al. (2007, 2008); Mills et al. (2012) around m).
We extended this range to 10 m. A 10 m QCL exhibiting remarkably low free-running frequency noise is coherently phase-locked to the OsO4-stabilized CO2 laser. This allows both line width narrowing, by about 4 orders of magnitude down to an unprecedented 10 Hz-level, and absolute frequency referencing at the level. In order to preserve some of its tunability, the QCL is in fact locked to one of two optical sidebands (tunable over 10 GHz) generated by coupling the CO2 laser light through an EOM. Once locked, we use this QCL to demonstrate high-resolution spectroscopy of both NH3 and methyltrioxorhenium (MTO) over a range of over 6 GHz. These species are of interest for the two precision measurements under progress in our group. The former is our molecule of choice for measuring kB, while the latter, MTO is an achiral test organometallic complex whose chiral derivatives are considered for a parity violation test Darquié et al. (2010); Stoeffler et al. (2011); Tokunaga et al. (2013).
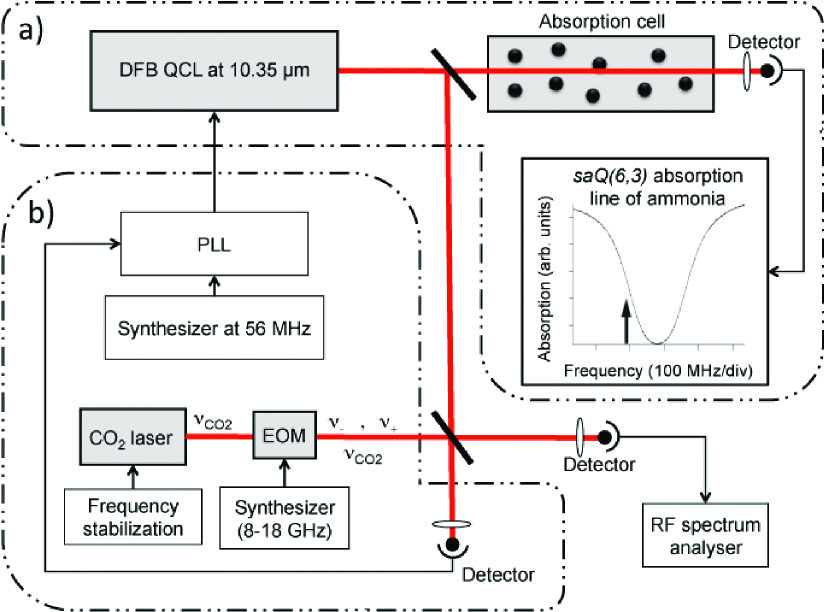
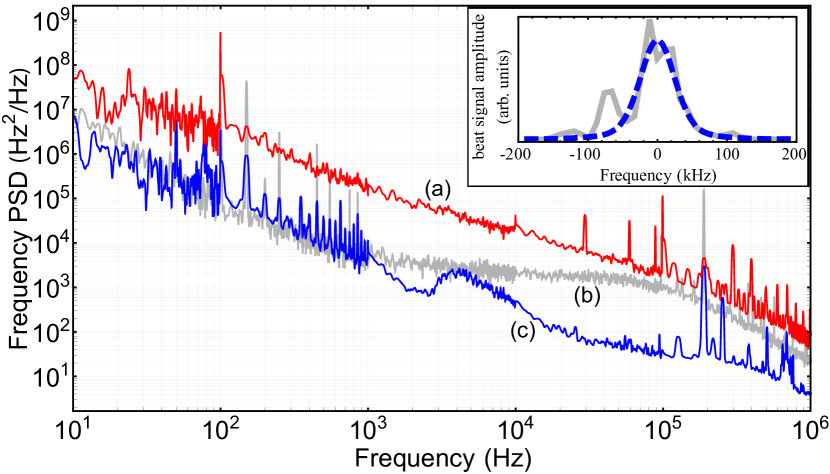
The QCL is a cw-mode near-room-temperature (near-RT) single-mode DFB laser (from Alpes Lasers) tunable between 10.34 and 10.42 m (28.76 to 29.00 THz). For the experiments described in this paper, it is typically operated at a temperature of 243 K (at which the threshold current is 710 mA) and a current ranging from 0.96 to 1.02 A, delivering 40 to 60 mW around 28.95 THz. At the QCL output, the laser beam is collimated with a spherical ZnSe lens ( mm)First, we measure the frequency noise of the free-running QCL. This allows us to estimate the feedback bandwidth required to narrow its line width. As illustrated in Fig. 1(a), we use the side of an ammonia linear absorption line as frequency discriminator. The absorption signal from a 5 cm path length cell containing 250 Pa of NH3 is recorded with a liquid nitrogen-cooled HgCdTe detector (with a bandwidth of a few megahertz) and processed by a Fast Fourier Transform (FFT) spectrum analyzer. The frequency-to-amplitude conversion coefficient is measured by recording the same rovibrational line using our stabilized CO2 laser spectrometer Lemarchand et al. (2010). Fig. 2 shows the resulting frequency noise power spectral density (PSD) of the QCL. It has a trend at low frequency, followed by a steeper slope above kHz, as observed in Bartalini et al. (2010); Tombez et al. (2011). Note however that the measured frequency noise PSD is roughly one order of magnitude lower than previously published characterizations of free-running cw-mode near-RT DFB QCLs Myers et al. (2002); Bartalini et al. (2010); Tombez et al. (2011); Bartalini et al. (2011); Mills et al. (2012). Fig. 2 also shows the contribution from the laser intensity noise, obtained with the laser tuned far off resonance, as well as the contribution from a home-made low-noise current source. The latter is obtained by multiplying the driver’s current noise spectrum ( above 10 kHz) by the laser DC current-to-frequency response (230 MHz/mA). The driver s current noise was accurately measured by balancing two identical home-made sources of opposite polarity and detecting the residual AC-currents.
Fig. 2 also shows that the expected white noise level corresponding to the Schawlow-Townes limit does not seem to be reached at 1 MHz. Thus, only an upper limit of Hz2/Hz (and an upper limit of the corresponding intrinsic laser line width of Hz) can be inferred. This is 1.7 times lower than measured for a cw mode near-RT DFB QCL at 4.3 m Bartalini et al. (2011).
The real laser line width is broadened by flicker noise and depends on the observation time. The inset in Fig. 2 shows a beat signal between the free-running QCL and a free-running CO2 laser which exhibits a record kHz full width at half maximum after 1 ms of integration time (i.e. 1 kHz resolution bandwidth). The line width of the free-running CO2 laser was measured to be kHz Bernard et al. (1995), making its contribution negligible in the observed width. The measured beat signal agrees well with a theoretical estimation of the QCL emission line shape based on the measured frequency noise PSD (following Elliott, Roy, and Smith (1982) and accounting for the 1 ms observation time Bishof et al. (2013)) as indicated by the dashed line in the inset of Fig. 2.
The experimental setup used to coherently phase-lock the QCL to a CO2 laser stabilized on a saturated absorption line of OsO4 is shown on Fig. 1(b). In this work, the CO2 laser carrier is frequency-locked to the line of 192OsO4. Once stabilized, light from the CO2 laser is coupled to an EOM which generates two sidebands of frequencies on either side of the fixed laser frequency . The frequency is tunable from 8 to 18 GHz. The QCL (W) and the CO2 laser beams are overlapped and the beat signal is detected by a liquid nitrogen-cooled HgCdTe detector with a bandwidth of about 100 MHz. With a EOM efficiency, W (mW) is available for the beat signal in each of the CO2 laser sidebands (in the carrier).
The phase-error signal is generated by comparing the phase of the amplified (60 dB) beat signal with a synthesized reference signal typically at 56 MHz using a frequency mixer. A phase-lock servo loop is used to apply a correction signal directly to the QCL’s current.
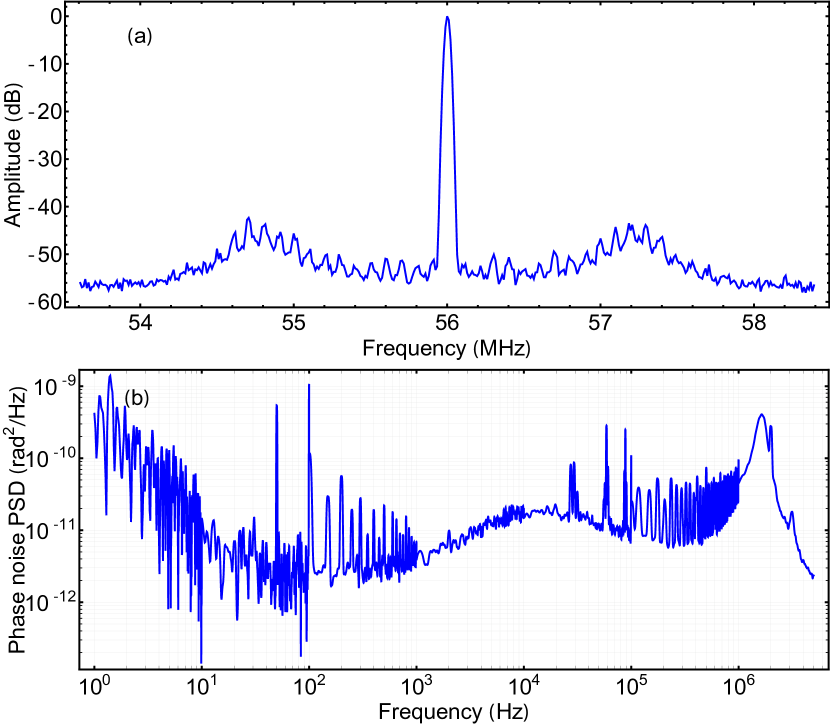
The beat spectrum between a CO2 laser sideband and the QCL phase-locked to this sideband, processed by a radio-frequency (RF) spectrum analyzer, is shown in Fig. 3(a). It is recorded with a second out-of-loop photodetector (see Fig. 1), similar to the one in-loop, in order to avoid errors brought by the detection setup and associated electronics. It represents the relative phase noise spectral density between the QCL and the CO2 laser. With a typical signal-to-noise ratio of 60 dB in a 30 kHz resolution bandwidth we achieve a feedback bandwidth between 1 and 3 MHz (as indicated by the servo-loop unity gain frequency bump in the spectrum wings). As expected for a proper phase-lock, the beat signal of Fig. 3(a) exhibits an extremely narrow central peak. Its width was observed to be limited by the 10-Hz resolution of our RF spectrum analyzer. Fig. 3(b) shows the phase-noise power spectral density of the beat-signal between the CO2 laser carrier and the phase-locked QCL (the beat signal of the out-of-loop photodetector is down-mixed to DC and processed with a FFT spectrum analyzer). The phase-lock performance can be characterized by the residual rms phase error, . Integration of the phase-noise data in Fig. 3(b) from 1 Hz up to 5 MHz leads to a very small rad, corresponding to having of the beat signal RF power concentrated in the coherent part (i.e. in the central peak) Zhu and Hall (1993).
This is a signature of a highly coherent phase-lock and of the excellent transfer of the locked CO2 laser’s spectral features to the QCL. This results in a record QCL line width of the order of 10 Hz, 3 to 4 orders of magnitude lower than a free-running QCL, and a relative stability at 1 s of about 1 Hz. Our particular choice of OsO4 line for absolute frequency referencing leads to a 90 Hz accuracy of the frequency scale Chardonnet (1989); Acef, Michaud, and Rovera (1999). To our knowledge, this is the first demonstration that a QCL can reach these metrological spectral properties.
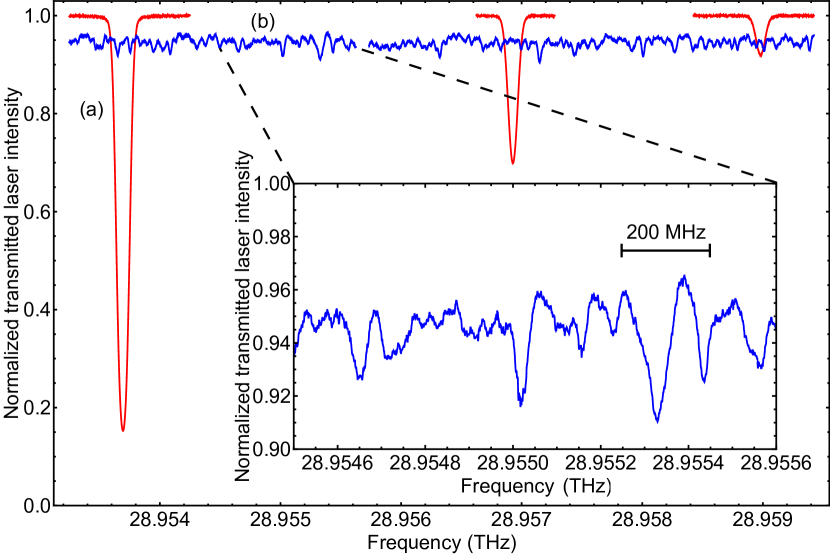
Linear absorption spectra of both NH3 and MTO are shown on Fig. 4. The setup has been described above, and is depicted in Fig. 1. A few-millimeter wide beam of W is sent through a 60-cm long cell filled with either Pa of ammonia or Pa of MTO. A slotted disk, that chops the beam at 2 kHz, and a lock-in detection are used for noise filtering. The QCL is phase-locked to the EOM’s negative sideband (frequency ), red-detuned from the CO2 laser carrier (frequency ). Sweeping the EOM frequency enables us to continuously tune the QCL over GHz, more than times the laser line width. With a few milliwatts available for spectroscopy, this also results in an effective power amplification of compared to using the CO2 laser beam’s negative sideband directly. The ammonia spectrum in Fig. 4 exhibits three isolated rovibrational lines of the vibrational mode of 14NH3. The MTO spectrum looks very different with a mean absorption and MHz wide deviations as expected from the dense antisymmetric Re=O stretching mode of the molecule Darquié et al. (2010); Stoeffler et al. (2011); Tokunaga et al. (2013). Both spectra were normalized by numerically correcting for the baseline.
In conclusion we characterized the frequency noise of a free-running cw near-RT DFB m QCL. The laser is then phase-locked to a frequency-stabilized CO2 laser, and we observe that the spectral properties of the latter are successfully copied to the QCL. This results in a record line width of the order of 10 Hz, a relative stability at 1 s in the range and a relative accuracy of . Spectra of ammonia and MTO over several GHz using our QCL source were presented, thereby demonstrating the potential of QCLs for precision measurements devoted to metrological applications or tests of fundamental laws of nature.
The use of QCLs will eventually allow the study of any species showing absorption between 3 and 25 m, with much broader continuous tuning range and with reasonable powers. It will broaden the scope of our spectroscopic precision measurement experiments using molecules. We eventually plan to reach the accuracy of the Cs fountain Guéna et al. (2012), the stability of the best near-IR oscillators, and take full advantage of the QCL’s tunability by locking it to a frequency comb stabilized via on optical fiber to an ultra-stable near-IR reference monitored against atomic fountain clocks. This was recently demonstrated in our group with a CO2 lasers Chanteau et al. (2013). Stabilizing the laser this way provides the ultimate frequency accuracy and stability, and frees us from having to lock the QCL to any particular reference (another laser or a molecular transition), which would constrain the laser’s operating frequency. Finally, narrow line width light sources such as QCLs would benefit the entire spectroscopy community, beyond our scope of interest. Commercial QCLs are available at wavelengths spanning the entire mid-IR, the molecular fingerprint region, which hosts many spectral signatures of molecules of interest for atmospheric, planetary or interstellar physics, chemistry, biology, medical or industrial diagnostics.
The authors acknowledge financial support from CNRS, Université Paris 13, LNE, LabEx FIRST-TF (ANR-IO-LABX-48-01) and AS GRAM. This work is part of the projects NCPCHEM no 2010 BLAN 724 3 and QUIGARDE no ANR-12-ASTR-0028-03 funded by the Agence Nationale de la Recherche (ANR, France).
References
- Daussy et al. (1999) C. Daussy, T. Marrel, A. Amy-Klein, C. T. Nguyen, C. Bordé, and C. Chardonnet, Phys. Rev. Lett. 83, 1554 (1999).
- DeMille et al. (2008) D. DeMille, S. B. Cahn, D. Murphree, D. A. Rahmlow, and M. G. Kozlov, Phys. Rev. Lett. 100, 23003 (2008).
- Darquié et al. (2010) B. Darquié, C. Stoeffler, A. Shelkovnikov, C. Daussy, A. Amy-Klein, C. Chardonnet, S. Zrig, L. Guy, J. Crassous, P. Soulard, P. Asselin, T. R. Huet, P. Schwerdtfeger, R. Bast, and T. Saue, Chirality 22, 870 (2010).
- Baron et al. (2014) J. Baron, W. C. Campbell, D. DeMille, J. M. Doyle, G. Gabrielse, Y. V. Gurevich, P. W. Hess, N. R. Hutzler, E. Kirilov, I. Kozyryev, B. R. O’Leary, C. D. Panda, M. F. Parsons, E. S. Petrik, B. Spaun, A. C. Vutha, and A. D. West, Science 343, 269 (2014).
- Koelemeij et al. (2007) J. C. J. Koelemeij, B. Roth, A. Wicht, I. Ernsting, and S. Schiller, Phys. Rev. Lett. 98, 173002 (2007).
- Lemarchand et al. (2013) C. Lemarchand, S. Mejri, P. L. T. Sow, M. Triki, S. K. Tokunaga, S. Briaudeau, C. Chardonnet, B. Darquié, and C. Daussy, Metrologia 50, 623 (2013).
- Moretti et al. (2013) L. Moretti, A. Castrillo, E. Fasci, M. D. De Vizia, G. Casa, G. Galzerano, A. Merlone, P. Laporta, and L. Gianfrani, Physical Review Letters 111, 060803 (2013).
- Hudson et al. (2006) E. R. Hudson, H. J. Lewandowski, B. C. Sawyer, and J. Ye, Phys. Rev. Lett. 96, 143004 (2006).
- Shelkovnikov et al. (2008) A. Shelkovnikov, R. J. Butcher, C. Chardonnet, and A. Amy-Klein, Phys. Rev. Lett. 100, 150801 (2008).
- Truppe et al. (2013) S. Truppe, R. J. Hendricks, S. K. Tokunaga, H. J. Lewandowski, M. G. Kozlov, C. Henkel, E. A. Hinds, and M. R. Tarbutt, Nature communications 4, 2600 (2013).
- Ziskind et al. (2002) M. Ziskind, C. Daussy, T. Marrel, and C. Chardonnet, The European Physical Journal D 20, 219 (2002).
- Lemarchand et al. (2011) C. Lemarchand, M. Triki, B. Darquié, C. J. Bordé, C. Chardonnet, and C. Daussy, New Journal of Physics 13, 073028 (2011).
- Tokunaga et al. (2013) S. K. Tokunaga, C. Stoeffler, F. Auguste, A. Shelkovnikov, C. Daussy, A. Amy-Klein, C. Chardonnet, and B. Darquié, Molecular Physics 111, 2363 (2013).
- Bernard et al. (1997) V. Bernard, C. Daussy, G. Nogues, L. Constantin, P. E. Durand, A. Amy-Klein, A. van Lerberghe, and C. Chardonnet, IEEE J. Quant. Elec. QE-33, 1282 (1997).
- Acef, Michaud, and Rovera (1999) O. Acef, F. Michaud, and G. V. Rovera, IEEE Transactions on Instrumentation and Measurement 48, 567 (1999).
- Galli et al. (2011) I. Galli, S. Bartalini, S. Borri, P. Cancio, D. Mazzotti, P. De Natale, and G. Giusfredi, Phys. Rev. Lett. 107, 270802 (2011).
- Bressel, Ernsting, and Schiller (2012) U. Bressel, I. Ernsting, and S. Schiller, Optics letters 37, 918 (2012).
- Ricciardi et al. (2012) I. Ricciardi, E. De Tommasi, P. Maddaloni, S. Mosca, A. Rocco, J.-J. Zondy, M. De Rosa, and P. De Natale, Opt. Express 20, 9178 (2012).
- Schliesser, Picqué, and Hänsch (2012) A. Schliesser, N. Picqué, and T. W. Hänsch, Nat. Phot. 6, 440 (2012).
- Myers et al. (2002) T. L. Myers, R. M. Williams, M. S. Taubman, C. Gmachl, F. Capasso, D. L. Sivco, J. N. Baillargeon, and a. Y. Cho, Optics letters 27, 170 (2002).
- Bartalini et al. (2010) S. Bartalini, S. Borri, P. Cancio, a. Castrillo, I. Galli, G. Giusfredi, D. Mazzotti, L. Gianfrani, and P. De Natale, Physical Review Letters 104, 083904 (2010).
- Tombez et al. (2011) L. Tombez, J. D. Francesco, S. Schilt, G. D. Domenico, J. Faist, P. Thomann, D. Hofstetter, J. Di Francesco, S. Schilt, G. Di Domenico, J. Faist, P. Thomann, and D. Hofstetter, Opt. Lett. 36, 3109 (2011).
- Bartalini et al. (2011) S. Bartalini, S. Borri, I. Galli, G. Giusfredi, D. Mazzotti, T. Edamura, N. Akikusa, M. Yamanishi, and P. De Natale, Opt. Express 19, 17996 (2011).
- Mills et al. (2012) A. A. Mills, D. Gatti, J. Jiang, C. Mohr, W. Mefford, L. Gianfrani, M. Fermann, I. Hartl, and M. Marangoni, Opt. Lett. 37, 4083 (2012).
- Bielsa et al. (2007) F. Bielsa, A. Douillet, T. Valenzuela, J.-P. Karr, and L. Hilico, Opt. Lett. 32, 1641 (2007).
- Bielsa et al. (2008) F. Bielsa, K. Djerroud, A. Goncharov, A. Douillet, T. Valenzuela, C. Daussy, L. Hilico, and A. Amy-Klein, J. Mol. Spec. 247, 41 (2008).
- Cappelli et al. (2012) F. Cappelli, I. Galli, S. Borri, G. Giusfredi, P. Cancio, D. Mazzotti, A. Montori, N. Akikusa, M. Yamanishi, S. Bartalini, and P. De Natale, Opt. Lett. 37, 4811 (2012).
- Borri et al. (2012) S. Borri, I. Galli, F. Cappelli, A. Bismuto, S. Bartalini, P. Cancio, G. Giusfredi, D. Mazzotti, J. Faist, and P. De Natale, Opt. Lett. 37, 1011 (2012).
- Hansen et al. (2013) M. G. Hansen, I. Ernsting, S. V. Vasilyev, A. Grisard, E. Lallier, B. Gérard, and S. Schiller, Optics express 21, 27043 (2013).
- Galli et al. (2013) I. Galli, M. Siciliani de Cumis, F. Cappelli, S. Bartalini, D. Mazzotti, S. Borri, A. Montori, N. Akikusa, M. Yamanishi, G. Giusfredi, P. Cancio, and P. De Natale, Appl. Phys. Lett. 102, 121117 (2013).
- Stoeffler et al. (2011) C. Stoeffler, B. Darquié, A. Shelkovnikov, C. Daussy, A. Amy-Klein, C. Chardonnet, L. Guy, J. Crassous, T. R. Huet, P. Soulard, and P. Asselin, Phys. Chem. Chem. Phys. 13, 854 (2011).
- Lemarchand et al. (2010) C. Lemarchand, K. Djerroud, B. Darquié, O. Lopez, A. Amy-Klein, C. Chardonnet, C. J. Bordé, S. Briaudeau, and C. Daussy, International Journal of Thermophysics 31, 1347 (2010).
- Bernard et al. (1995) V. Bernard, P. E. Durand, T. George, H. W. Nicolaisen, A. Amy-Klein, and C. Chardonnet, IEEE Journal of Quantum Electronics QE-31, 1913 (1995).
- Elliott, Roy, and Smith (1982) D. Elliott, R. Roy, and S. Smith, Phys. Rev. A 26, 12 (1982).
- Bishof et al. (2013) M. Bishof, X. Zhang, M. J. Martin, and J. Ye, Physical Review Letters 111, 093604 (2013).
- Zhu and Hall (1993) M. Zhu and J. L. Hall, J. Opt. Soc. Am. B 10, 802 (1993).
- Chardonnet (1989) C. Chardonnet, Spectroscopie de saturation de hautes précision et sensibilité en champ laser fort. Applications aux molécules OsO4, SF6 et CO2 et à la métrologie des fréquences, Ph.D. thesis, Université Paris 13, Villetaneuse (1989).
- Guéna et al. (2012) J. Guéna, M. Abgrall, D. Rovera, P. Laurent, B. Chupin, M. Lours, G. Santarelli, P. Rosenbusch, M. Tobar, R. Li, K. Gibble, A. Clairon, and S. Bize, IEEE transactions on ultrasonics, ferroelectrics, and frequency control 59, 391 (2012).
- Chanteau et al. (2013) B. Chanteau, O. Lopez, W. Zhang, D. Nicolodi, B. Argence, F. Auguste, M. Abgrall, C. Chardonnet, G. Santarelli, B. Darquié, Y. Le Coq, and A. Amy-Klein, New J. Phys. 15, 073003 (2013).