The RR Lyrae Variable Population in the Phoenix Dwarf Galaxy
Abstract
We present the first detailed study of the RR Lyrae variable population in the Local Group dSph/dIrr transition galaxy, Phoenix, using previously obtained HST/WFPC2 observations of the galaxy. We utilize template light curve fitting routines to obtain best fit light curves for RR Lyrae variables in Phoenix. Our technique has identified 78 highly probable RR Lyrae stars (54 ab-type; 24 c-type) with about 40 additional candidates. We find mean periods for the two populations of days and days. We use the properties of these light curves to extract, among other things, a metallicity distribution function for ab-type RR Lyrae. Our analysis yields a mean metallicity of dex for the RRab stars. From the mean period and metallicity calculated from the ab-type RR Lyrae, we conclude that Phoenix is more likely of intermediate Oosterhoff type; however the morphology of the Bailey diagram for Phoenix RR Lyraes appears similar to that of an Oosterhoff type I system. Using the RRab stars, we also study the chemical enrichment law for Phoenix. We find that our metallicity distribution is reasonably well fitted by a closed-box model. The parameters of this model are compatible with the findings of Hidalgo et al. (2009) further supporting the idea that Phoenix appears to have been chemically enriched as a closed-box-like system during the early stage of its formation and evolution.
1 Introduction
With a distance modulus of mag corresponding to a distance of kpc and a distance from M31 of kpc (Hidalgo et al., 2009), Phoenix presents an opportunity to study the evolution of a dwarf galaxy without significant perturbations exerted by massive galaxies, while still being close enough to obtain good sampling of its stellar population. Since its discovery (Schuster & West, 1976), Phoenix has gone from being classified as a distant globular cluster to its currently accepted state as a dwarf transition (dSph/dIrr) type galaxy, which are characterized by recent star formation but lacking any prominent H II regions (Mateo, 1998). This is supported by observations of an H I region near the galaxy, likely due to gas expelled from supernova winds, that appears to be associated with recent ( 100 Myr) star formation (Young et al., 2007). Previously, Martínez-Delgado et al. (1999) discovered two perpendicular, elliptical components in the structure of Phoenix. The inner ellipse is oriented in the east-west direction and contains the young stars in the galaxy. The outer ellipse is rotated from the inner and contains no young stars. This indicates that either star formation has recently occurred exclusively in the center of this dwarf galaxy, or stars have formed in an envelope that shrinks over the time due to the natural reduction of the pressure due to the gas.
This last hypothesis was recently suggested in a detailed study of the star formation history (SFH) of Phoenix performed by Hidalgo et al. (2009). Its distance from massive galaxies, transition type, associated H I region, and the two perpendicular, elliptical components with distinctly different stellar populations make the SFH of Phoenix particularly interesting. In their work, Hidalgo et al. (2009) compared synthetic color-magnitude diagrams (CMDs) to the observed CMD of Phoenix in order to derive the star formation rate (SFR) as a function of both time and metallicity. The SFH for the entirety of Phoenix was not fit well by any one standard chemical evolution model (e.g. closed-box, infall, or outflow; see Pagel (2009); Peimbert et al. (1994) for model details) indicating a relatively complex star formation history over nearly a Hubble time ( Gyr). However, they suggest that a closed-box model is compatible with the SFH of Phoenix until about 6-7 Gyr ago when it appears to have experienced a sudden burst of chemical enrichment. Thus, an independent measurement of the abundances of stars that formed during this early epoch probing the galaxy’s chemical evolution at that time could test the validity of this analysis.
In this work, we study this early chemical evolution using the RR Lyrae stars present in Phoenix. The RR Lyrae stars are pulsating horizontal branch (HB) stars in the instability strip. They are observed to pulsate in three modes. The ab-types (RRab) pulsate in the fundamental mode; the c-types (RRc) pulsate in the first overtone, while the d-types present both the fundamental and first overtone modes of pulsation. The discovery of RR Lyrae stars in a system indicates the presence of an old stellar population ( Gyr, Smith (1995)) characteristic of their low masses (). Thus, in analyzing their properties one can probe the conditions of the system at these early epochs. Extensive studies of RR Lyrae stars have uncovered many relations between their pulsation properties and useful astrophysical quantities (Sandage, 1993; Fernley, 1998; Sandage & Tammann, 2006; Jurcsik & Kovács, 1996; Alcock et al., 2000; Morgan et al., 2007; Nemec et al., 2013; Guldenschuh et al., 2005). Among these, there is a relation between periods, amplitudes, and metallicities of RRab stars (Alcock et al., 2000). In particular, they define a reduced period, PA , and found that the iron abundances, [Fe/H], of the Galactic globular clusters M3, M5, and M15 correlate with this reduced period. This provides a straightforward method for deriving the metallicity distribution function (MDF) for the RR Lyrae population in a system.
Gallart et al. (2004) previously investigated the variable star population within Phoenix. Specifically, they observed the coexistence of anomalous and short-period classical Cepheid variables, as well as identified a previously undetected population of RR Lyrae candidates within the galaxy. That study is the first and only detection of RR Lyrae stars in Phoenix, but due to observational constraints (relatively high photometric errors compared with RR Lyrae pulsation amplitudes), it could not provide an analysis of this population. In this work, we present the first in-depth study of the RR Lyrae population in Phoenix, increasing the number of highly probable RR Lyrae stars with light curve properties by a factor of . We analyze the properties of this RR Lyrae population with the goal of shedding light on the early evolutionary history of Phoenix.
This paper is organized in the following manner. Section 2 discusses the observations used in this study and how these data were reduced. Section 3 describes how variable star candidates were selected and characterized as well as how the artificial RR Lyrae simulations were performed in order to characterize biases inherent in our analysis. In Section 4, we compare our RR Lyrae sample with candidates identified in Gallart et al. (2004). In Sections 5 and 6, our results are presented and discussed. Finally, Section 7 summarizes the conclusions drawn from this work.
2 Observations & Data Reduction
| Target Field | RA (J2000) | Dec. (J2000) | Filters | Data Set | HJD Range (+2 454 000) | |
|---|---|---|---|---|---|---|
| Inner | 01 51 07.09 | -44 26 40.21 | F555W | 6x1200 | u64j0101-u64j0106 | 919.98345-920.25843 |
| F814W | 8x1200 | u64j0201-u64j0208 | 920.65355-920.86604 | |||
| Outer | 01 51 08.99 | -44 24 03.94 | F555W | 1x100,2x1100, 8x1200 | u64j0301-u64j030b | 925.66641-925.95748 |
| F814W | 1x100,2x1100,10x1200 | u64j0401-u64j040d | 926.61775-927.01229 |
The HST/WFPC2 images of the two target fields around Phoenix used in this study were retrieved from the Mikulski Archive for Space Telescopes (MAST). The original observing campaign (PI: A. Aparicio; GO-8706) was intended to study the spatial structure and the stellar age and metallicity distribution of this dwarf galaxy. Therefore, it provides deep time series photometry with fairly good quality for detecting legitimate RR Lyrae variable candidates. A detailed description of the two data sets is summarized in Table 1. Images were taken in both the F555W and F814W filters. A total of two fields were observed: one centered on Phoenix itself, and the other upon the outskirts of the galaxy from the centered field. The total observed field of view with these observations is equal to 11.4 arcmin2 on the sky. We note that Hidalgo et al. (2009) utilized data from a separate observational campaign (PI: G. Smith; GO-6798) in addition to the data utilized in this work. Crowding led to difficulties matching stars in our data reduction. Consequently, we were unable to add this time-series photometry to the first set, rendering them unusable for our RR Lyrae analysis.
We performed point spread function (PSF) photometry on the data sets using the HSTPhot package (Dolphin 2000). Each science image (), which is preprocessed through the standard STScI pipeline (bias and dark subtracted, and flat fielded), was cleaned by removing bad pixels, cosmic rays and hot pixels using the utility software included in HSTPhot. Pre-constructed PSFs for each WFPC2 passband were obtained from the TinyTim PSF library (Krist, Hook, & Stoehr, 2011) and used for our PSF photometry. Aperture corrections were applied to the output magnitudes via a default setting in HSTPhot which computes the average difference between the PSF photometry and aperture photometry with a 0.5 arcsec radius. The resultant magnitudes were also corrected for a loss of charge transfer efficiency (CTE) for each WFPC2 chip as described in Dolphin (2000). The HSTPhot package produces the output photometry both in the native WFPC2 VEGAmag system as well as the ground-based Johnson-Cousins system using the calibration recipe provided by Holtzman (1995). We constructed the final list of standard VI photometry by selecting well-photometered stars with “object type” equal to 1 (i.e. good star) and high signal-to-noise ratio, S/N 10.
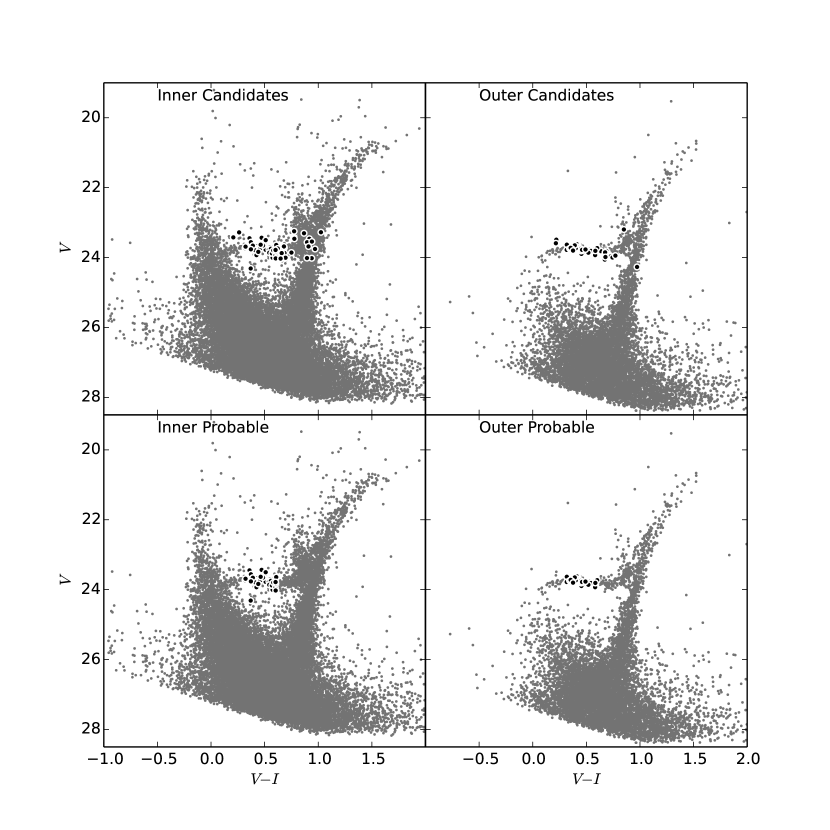
The CMDs for each field observed in Phoenix after our reduction and photometry are illustrated in Figure 1. Hidalgo et al. (2009) present a detailed analysis of the CMD of Phoenix derived from the same data. Consequently, we only discuss aspects relative to our analysis. Namely, while only the inner field displays a bright main-sequence composed of young stars associated with recent star formation, both the inner and outer fields display a clear red giant branch and an extended HB indicative of an old population. The RR Lyrae candidates we detect in our study are marked on these CMDs. Most lie within the intersection of the HB and the instability strip with a few outliers. As we will discuss shortly, most of these outliers are either other types of variable stars or had poorly sampled light curves. In particular, the inner field contains more outlying candidates as a consequence of the fewer observations in this field manifesting in less phase coverage in the light curves.
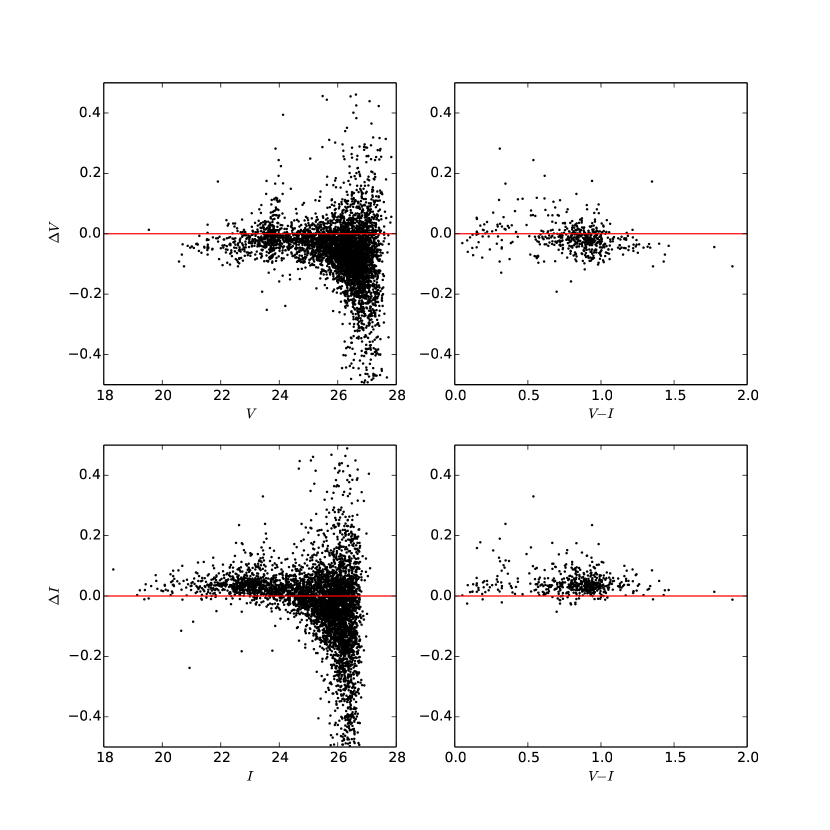
Since Hidalgo et al. (2009) performed photometry on the same data using the DAOPHOT package, we looked for differences in the resulting magnitudes (photometry for comparison kindly provided by S. Hidalgo). Figure 2 illustrates the resulting differences in photometry for stars matched between our two sets. The mean offset in was mag for stars brighter than mag, while in the offset amounted to mag for stars brighter than mag where the reported uncertainties represent the standard error of the mean. We attribute these small offsets to the different photometric calibration methods adopted in these two works in transforming to the Johnson-Cousins system. Considering the small values of these offsets, we chose not to correct for them and left our photometry as is for the following analysis.
3 Variable star characterization and simulations
We employ the methods of Yang et al. (2010), Yang & Sarajedini (2012), and Sarajedini et al. (2012) to characterize the variable stars in the data. Stars in a range of V magnitude ( mag mag) and color ( mag mag) were examined for variability. We ranked them by variability using a reduced defined as follows:
| (1) |
where and are the mean magnitudes for each star in each filter. For each light curve, we ignored data points deviating from the mean magnitude by more than from this calculation in order to filter out otherwise stable stars with anomalous data points. Any star with a value greater than was considered a variable star candidate. For reference the values of typical non-variable stars at the level of HB stars of Phoenix [V(HB)23.6 mag; see section 4] are less than 3.0 in our photometry.
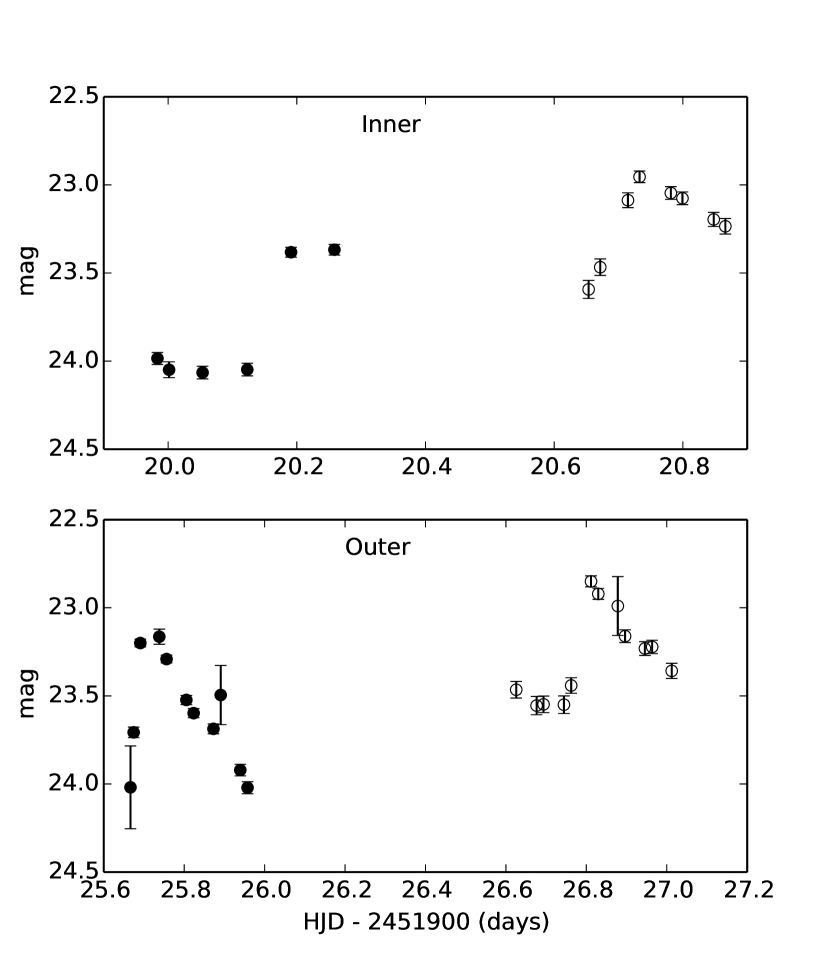
Figure 3 shows the raw, un-phased light curves for two representative RR Lyrae stars in the inner and outer fields, respectively. The raw light curves illustrate qualitatively that our observational window allows for adequate detection of variability consistent with RR Lyrae light curves. Table 4 provides an example time-series photometry set used for our RR Lyrae fitting routine, and the full set of time-series photometry for all RR Lyrae candidates is available in the online version of the journal.
After identifying variable candidates, anomalous data points with high photometric error ( mag) were removed from the time series photometry as these points may act to deform the fitted light curve from its true shape. We then used FITLC (Mancone & Sarajedini, 2008) to extract best fit RR Lyrae light curves from the time series photometry of the candidates. FITLC is a template fitting program that searches in the RR Lyrae pulsation parameter space (period, amplitude, mean magnitude) for the best fitting (minimized ) template. The templates employed in FITLC are those from Layden & Sarajedini (2000). FITLC also provides a GUI that allows the user to visually examine the quality of the fits as well as their position in space.
After this first round of light curve fitting, we implemented a constraint on the fit amplitudes according to Dorfi & Feuchtinger (1999). They find a relation between the -band and -band amplitudes of RR Lyrae stars, given by the following equation:
| (2) |
FITLC allows for a constraint on amplitude ratios without a zero-point offset. For this reason, we use the and amplitude data from Dorfi & Feuchtinger (1999), which consisted of 127 RR Lyrae stars from 3 globular clusters, and performed a linear fit to the data with zero intercept. This yielded a relation of the form , which agrees with the results of Liu & Janes (1990). This ensures that our RRab amplitudes deviate from Equation 2 by only mag. The validity of these fits was then checked by examining positions in the Bailey diagram, the best fit light curves by eye, and adherence to Equation 2. Stars with anomalous fits (e.g. RRab stars with extremely low or high periods due to aliasing) were examined and then manually re-fit using the interactive fitting mode in FITLC. The stars needing human intervention to be properly fit amounted to . A total of 121 RR Lyrae candidates were identified with this method. Figure 1 shows the locations of these candidates in the CMD of Phoenix.
In order to minimize contamination of our RR Lyrae sample from other variables, we performed a color cut excluding stars outside of the instability strip. Utilizing the instability strip bounds from Mackey & Gilmore (2003) ( mag mag) and a reddening of mag from the recalibrated dust maps of Schlegel et al. (1998) (Schlafly & Finkbeiner, 2011), we narrowed our RR
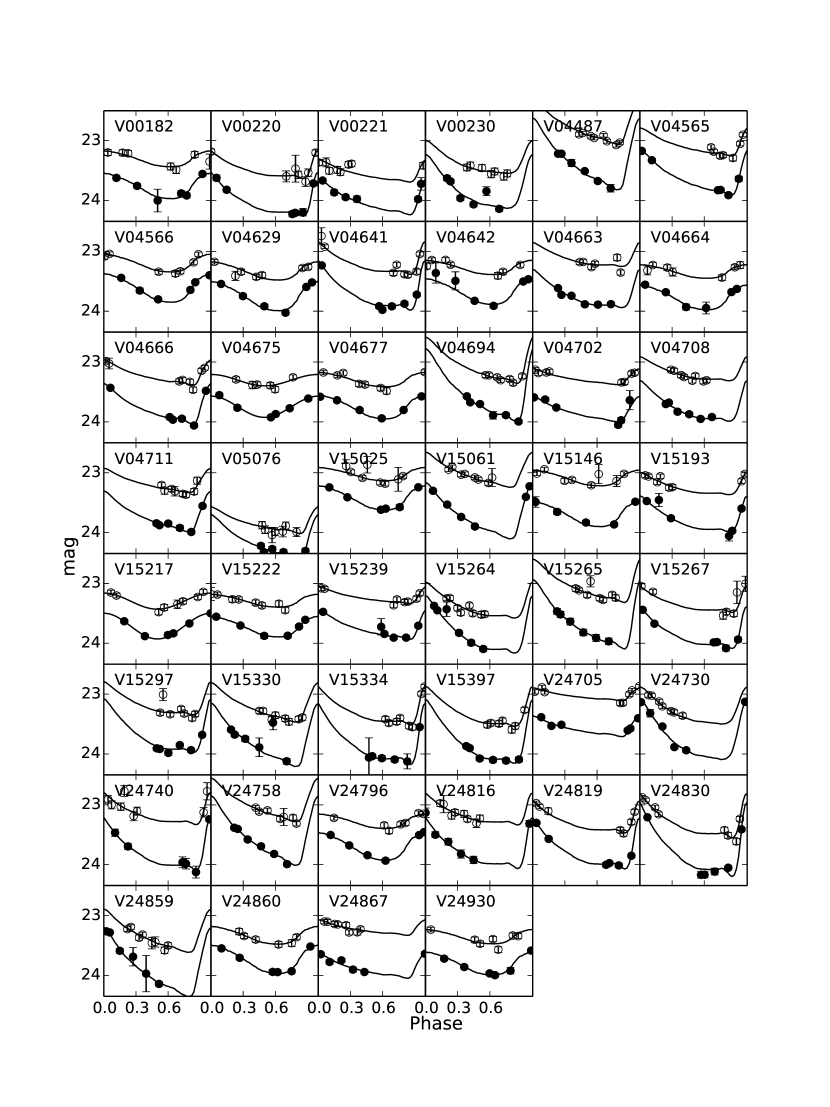
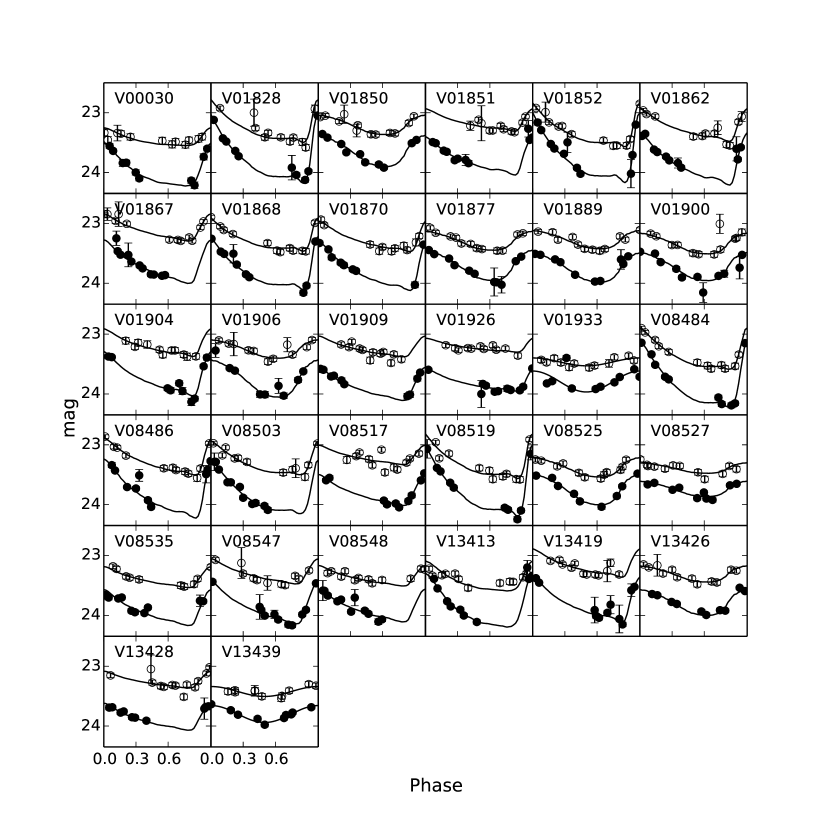
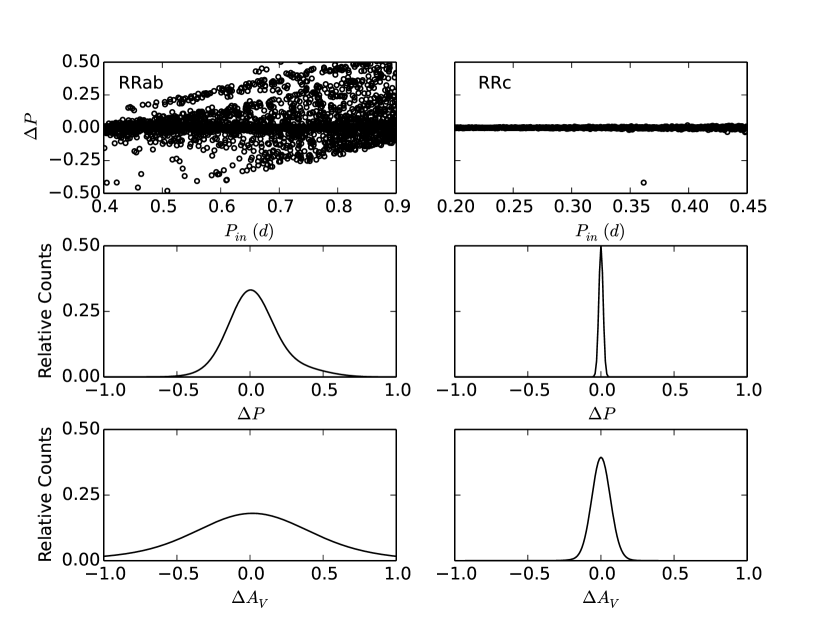
Lyrae list to 78 members within this region of the CMD. Figures 4 and 5 display the fitted light curves for these probable RR Lyrae stars for the inner and outer fields, respectively. This resulted in two sets of RR Lyrae candidates within Phoenix. The first set contains the 121 variables with best fitting periods, amplitudes, and light curves appropriate for RR Lyrae stars which we will refer to as the RR Lyrae candidates in Phoenix, and the second set consists of the 78 members of the first set that are located within the color range of the instability strip, which we will henceforth refer to as the probable RR Lyrae stars in Phoenix. Tables 5 and 6 list the light curve fit parameters for the probable and the candidate RR Lyrae stars, respectively. In Section 5, we analyze and compare the properties of both sets. To characterize and quantify biases inherent in our fitting procedure, we produced artificial RR Lyrae light curves and used FITLC to retrieve the best fit properties of these artificial variables given our observing window. We generated 500 synthetic light curves per RR Lyrae template (6 RRab; 2 RRc) and simulated observations of these variables with the window function of our data set. These simulated observations were used as input to FITLC from which output fit parameters were generated. The deviations of the fit parameters from the true light curve parameters provide a quantitative estimate of the biases resultant from the phase coverage and cadence of the data.
Figures 6 and 7 illustrate the results of these simulations for both of the observed fields in Phoenix. It is evident that while the outer field observations suffer from relatively weak aliasing effects, the inner field shows significant alias bands resulting from the shorter phase coverage of those observations. In order to quantify the uncertainties present in the fitted RR Lyrae properties due to these alias bands, we performed the statistical test used in Yang et al. (2010), Yang & Sarajedini (2012), and Sarajedini et al. (2012) with a modification. This consists of sampling the set of artificial RR Lyrae stars and randomly drawing the appropriate number corresponding to the number of probable RR Lyrae stars observed in each field. For the inner field, 32 RRab and 14 RRc stars were randomly sampled from the artificial RR Lyrae stars with simulated observations corresponding to that of the inner field data set. Likewise, for the outer field, 22 RRab and 10 RRc stars were sampled from the corresponding set of artificial RR Lyrae stars in the outer field. From these samples, the mean deviations of the fitted parameters from the true parameters (, , and ) were calculated for each type in each field. This process was repeated 10,000 times to increase the statistical significance.
| Field | RR Lyrae type | Total period error (days) | Total amplitude error (mag) | Total error (mag) | Total error |
|---|---|---|---|---|---|
| Inner | RRab | ||||
| Inner | RRc | N/A | N/A | ||
| Outer | RRab | ||||
| Outer | RRc | N/A | N/A |
We then estimate the uncertainties in these fit properties from the distributions of the deviations as follows. We first fit a Gaussian to each distribution. The 1- width of this Gaussian approximates the standard deviation, thus the standard error of the mean (sem) () approximates the random error associated with this bias. Meanwhile the peak, , is a measure of the systematic bias resulting from alias bands not symmetric about zero. Herein lies the modification of this error determination technique from the previous studies that employed it, as they did not account for this systematic offset. We then add these distinct components in quadrature to realistically estimate the total error inherent in the fitting process as . This represents the total standard error inherent in the fitting procedure for each quantity (, , ), type (RRab; RRc), and field (inner; outer). The resulting errors are tabulated in Table 2. These errors indicate that our fit parameters are sufficiently accurate and precise for the analysis to follow. We conclude this section by noting that these estimations represent the upper limits on our actual uncertainties since they consider only the automated fitting routine. As was pointed out earlier in this section, approximately one third of RR Lyrae stars in our sample were fit with human intervention which suffers from lower uncertainty.
4 Comparison with previous study
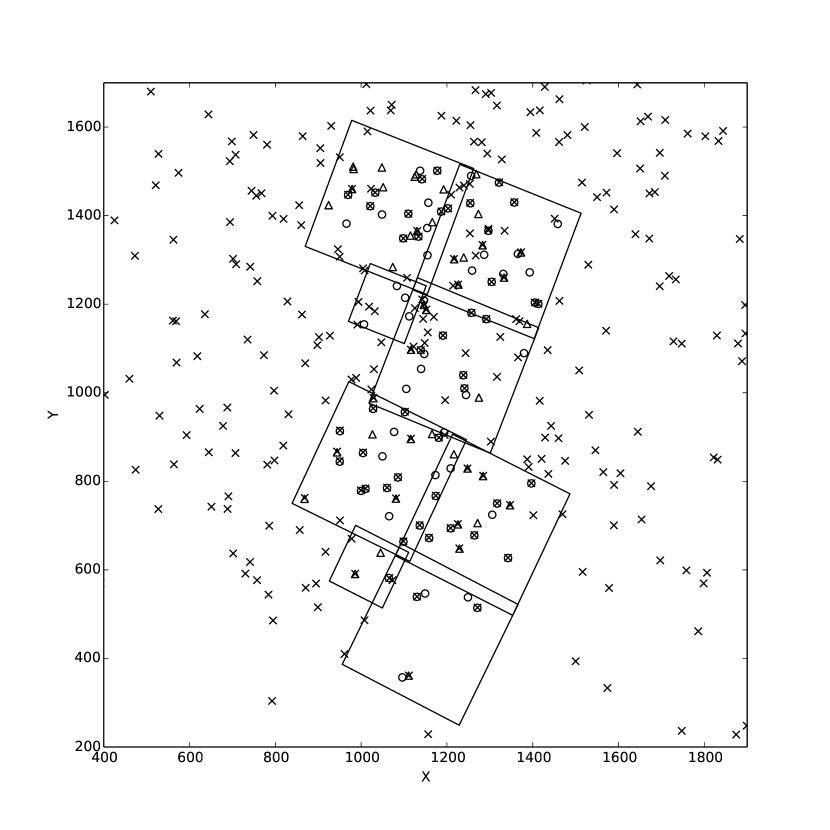
In this section, we compare the properties of the RR Lyrae stars found in this study to those of Gallart et al. (2004). The data for this comparison were kindly provided by C. Gallart (private communication). We first compared the locations on the sky of the RR Lyrae candidates from the two sets. Figure 8 shows the positions of the RR Lyrae candidates detected in this work (open circles) superimposed on the positions of the 400 RR Lyrae candidates from the previous study (crosses). It is clear that we identify many RR Lyrae candidates in common, although the previous study detected many at locations where our analysis does not and vice versa. Since the horizontal branch of Phoenix was near the photometric limit of the Gallart et al. (2004) work, the pulsation properties of their RR Lyrae candidates remain largely uncertain. Consequently, the authors could only confirm a fraction of these RR Lyrae stars. They calculated periods for of these, all of which have high amplitudes ( mag). Thus, it is very likely that some candidates from their sample are false-positives since pulsation amplitudes smaller than mag approach the photometric error of their observations.
Gallart et al. (2004) provide light curve fit properties for four of these RR Lyrae stars, of which three lie in our field of view. We find reasonable matches in our sample for two of them. These two are the RRab candidates (outer field) and (inner field), labeled as and in Gallart et al. (2004). Our fitting routine identified these as RRab stars with periods of d and d, and mean -band magnitudes of mag and mag. In comparison, Gallart et al. (2004), using similar template light curve fitting routines, obtained periods of d and d, and mean magnitudes of mag and mag, respectively. Their periods deviate from our calculated periods by d and d, while our mean magnitudes differ by mag and mag.
Although quantitative comparison is difficult with only two data points, we note that the differences in mean magnitudes are small and within the photometric errors. The period deviation for is small and within the RRab period error for the inner field listed in Table 2. However, the period deviation for is higher than our calculated RRab period error for the outer field by a factor of . Although Gallart et al. (2004) did not provide uncertainties for their RR Lyrae periods, it may be possible that this was simply an erroneous fit due to the high photometric errors involved.
We conclude this comparison by emphasizing that our most conservative set of 78 RR Lyrae stars increases the number of probable RR Lyrae variables with light curve parameters calculated in Phoenix by a factor of . Additionally, the range of RR Lyrae amplitudes we detect span the full range of pulsation amplitudes allowing for a good sampling of period-amplitude space.
5 Results
We now turn to the results of our analysis of the RR Lyrae population in Phoenix. We first examine the Bailey diagram for these RR Lyrae stars and discuss their Oosterhoff classification. We then calculate the line of sight reddening to Phoenix using the minimum light colors of the RRab light curve fits. Finally, we use an empirical relation between the period and amplitude of RRab stars and their metallicities to study the early chemical evolution of Phoenix as manifested in its RR Lyrae stars.
5.1 Bailey Diagram
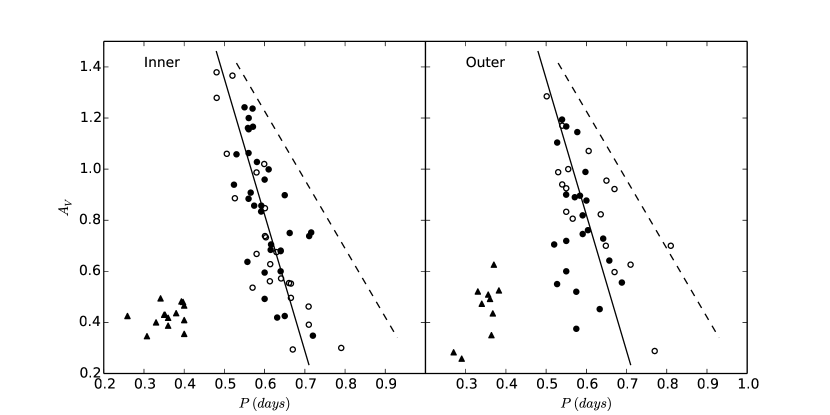
Figure 9 shows the Bailey diagrams from each observed field for the RR Lyrae stars we detected in Phoenix. The appearance of these diagrams does not indicate any significant difference in RR Lyrae properties between the two fields. The average periods for each type in each field are tabulated in Table 3. The difference between the average RRab periods in the two fields, d, is comparable to the period errors for RRab stars derived in Section 3, thus we regard this difference as statistically insignificant. However, the difference between the average RRc periods in the two fields, d, while small, is significantly greater than the derived period errors for RRc stars listed in Table 2. We could not identify any apparent reason for this discrepancy but note that our analysis primarily utilizes the properties of the RRab stars. Thus, we do not anticipate this effect to influence our subsequent analysis.
| Set | (d) | (d) |
|---|---|---|
| Inner Candidates | 0.605 | 0.359 |
| Outer Candidates | 0.598 | 0.343 |
| Inner Probable | 0.603 | 0.359 |
| Outer Probable | 0.582 | 0.343 |
Combining both fields, we find mean periods of d (sem) and d (sem) for the two RR Lyrae types residing within the instability strip in Phoenix. When we include the RR Lyrae candidates outside of the instability strip, the mean period of RRab stars shifts to a slightly higher value of d, while remains unchanged since no c-types were found outside of the instability strip.
The loci of the RRab types in Oosterhoff type I (OoI) and II (OoII) Galactic globular clusters from Clement & Rowe (2000) are also plotted in Figure 9. The ab-types in Phoenix appear to follow the OoI relation quite well, with the exception of one RRab candidate that appears near the OoII locus. This candidate is magnitude brighter than most other RR Lyrae stars in our sample and is likely an anomalous Cepheid contaminating our sample.
According to Catelan (2009), the Oosterhoff dichotomy describes the tendency of Galactic halo globular clusters to be divided into the two Oosterhoff types with mean RRab periods of d for OoI and d for OoII. In contrast, dSph galaxies have been observed to be of intermediate Oosterhoff type, with , referred to as the Oosterhoff gap. The primary factor influencing the Oosterhoff type of a system is thought to be the metallicity of that stellar population, although other factors such as age are believed to be partially responsible for this dichotomy as well (Lee & Carney, 1999). OoI systems are generally of intermediate metallicity while OoII systems tend to be more metal-poor (Lee & Carney, 1999; Catelan, 2009). Clearly, the mean period we calculate for probable RRab stars in Phoenix of d places it well within the Oosterhoff gap, albeit slightly closer to OoI systems. We will show momentarily that the uncertainty in mean period as calculated from Section 3 admits a significant possibility of Phoenix being an OoI system as opposed to OoII.
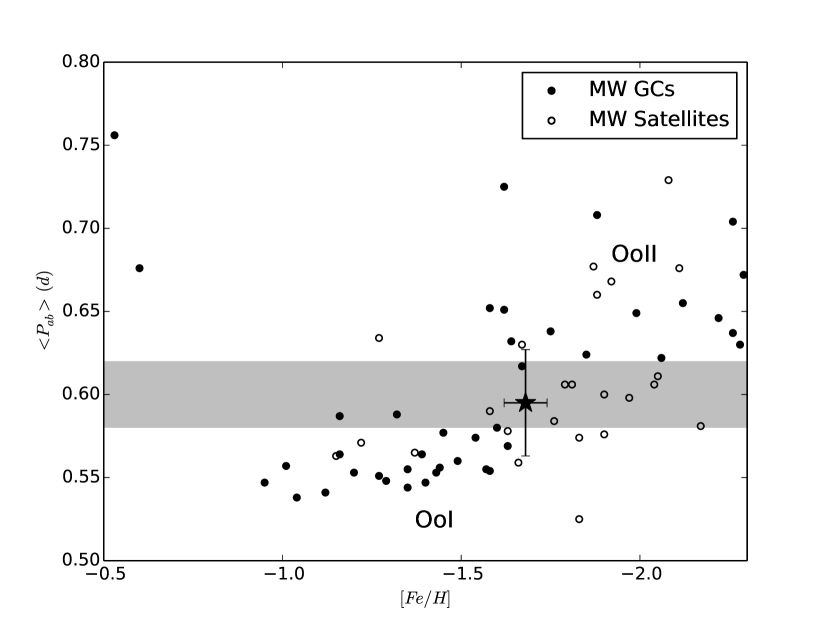
Figure 10 illustrates the Oosterhoff dichotomy in terms of the metallicity of a system and of its RR Lyrae population (Catelan, 2009). In contrast to the appearance of the Bailey diagram of Phoenix, its intermediate metallicity (calculated from the RRab stars; see Section 5.3) and place it well within the Oosterhoff gap, amongst most other Milky Way satellite systems. Adding to this, Phoenix appears to contain a higher fraction of longer period ( d), lower amplitude ( mag) RRab stars in comparison to the canonical OoI systems. However, we note that the error bars for the period of Phoenix in this plot, calculated from the artificial RR Lyrae simulations in Section 3, do allow for the possibility of Phoenix to be an OoI system. We also acknowledge the possibility that the window function of our data may have prevented detection of some shorter period RRab stars. While we cannot rule this possibility out, its position well within the Oosterhoff gap in Figure 10 leads us to conclude that Phoenix is more likely of intermediate Oosterhoff type.
5.2 The reddening to Phoenix from the RRab stars
It has been previously determined that the intrinsic () colors of RRab stars at the minimum phase of their pulsation is restricted to a small range. Guldenschuh et al. (2005) calculated this minimum light color to be mag. We use this value to calculate the reddening to the individual RRab stars in Phoenix and construct a reddening distribution.
Previous studies of the interstellar medium in Phoenix conclude that the reddening to stars within the galaxy is fairly small [ mag, Bianchi et al. (2012)]. Thus, we expect little to no differential reddening within Phoenix and combine the reddening distributions from both the inner and outer fields. To calculate the reddening to each individual RRab star, we used the best fit light curves to obtain the colors at minimum light, which we then converted to reddenings, , using the relation from Guldenschuh et al. (2005). The reddening distributions are illustrated in Figure 11 for the candidates and Figure 12 for probable RR Lyrae stars in Phoenix.
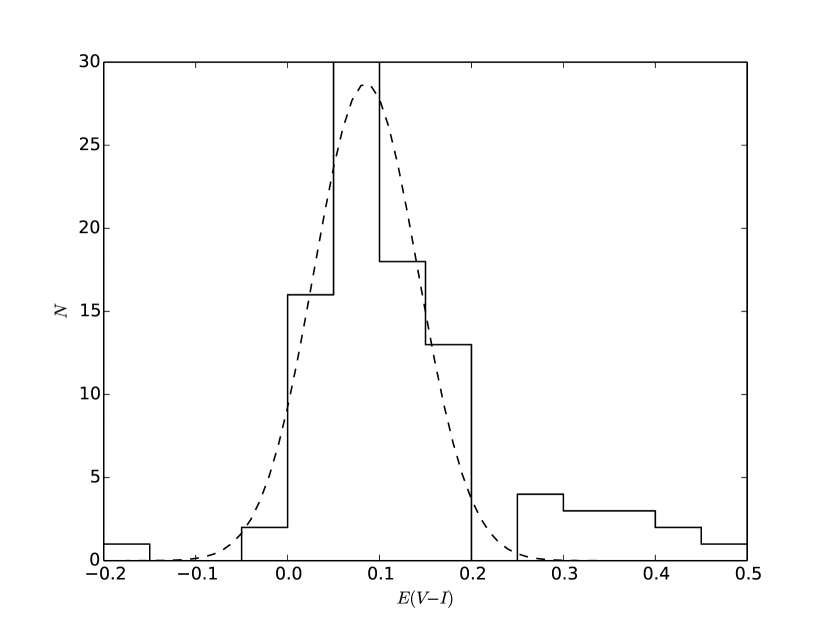
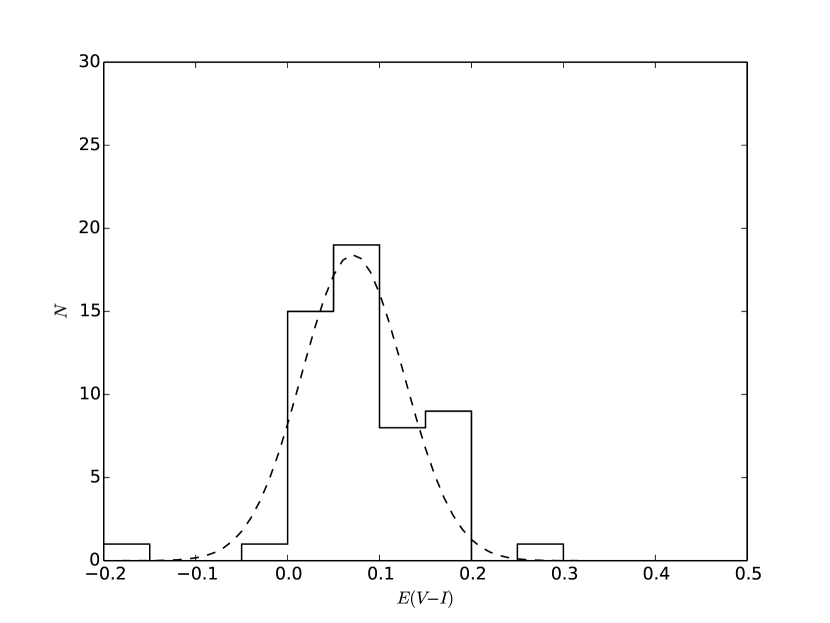
To obtain a singular value for the line of sight reddening and an error estimation, we fit a Gaussian to each distribution. The peak of this Gaussian approximates the mean reddening value while the 1- width approximates the standard deviation of this value. We take the standard error of the mean to estimate the random error of this value. Two additional sources of error for the reddening values result from the uncertainty in the intrinsic minimum light color of RRab stars from Guldenschuh et al. (2005) and the uncertainty in the minimum light colors we calculated from the artificial RR Lyrae simulations (see Table 2). We add these sources of uncertainty together in quadrature to obtain a realistic error estimate for this reddening value to Phoenix. This results in a reddening of mag using all the RRab candidates and mag utilizing only the probable RRab stars. Additionally, we repeated this process separately for both observed fields to check our initial assumption of little to no differential reddening. We obtain for the probable RRab stars in Phoenix mag for the inner field and mag for the outer field. The difference in reddening between the two fields is within the errors, thus we regard it as statistically insignificant.
These reddening values do not agree well with that of Phoenix from the recalibrated Schlegel et al. (1998) maps (Schlafly & Finkbeiner, 2011) of mag. However, previous studies of the stellar populations in Phoenix have found the reddening to be higher in Phoenix than from the Schlegel et al. (1998) maps. Bianchi et al. (2012) found a reddening between mag using SED fitting. Using the location of the plume of blue supergiants in its CMD, Massey et al. (2007) calculated a larger reddening of mag. The comparison of these values with the reddening from the recalibrated Schlegel et al. (1998) maps of mag indicates a significant source of internal reddening within Phoenix. Taking into account that E(V-I)=1.62*E(B-V) (Cardelli et al., 1989), we find that our results qualitatively agrees with these previous findings.
5.3 The metallicity of RRab stars in Phoenix
We use the relation between RRab period, amplitude, and metallicity from Alcock et al. (2000) to calculate the metallicity of the RRab stars in Phoenix:
| (3) |
This yields a mean metallicity for all RRab candidates in Phoenix of dex. This value is essentially unchanged when the RRab stars outside of the instability strip are excluded: dex. The uncertainties quoted for these metal abundances reflect the standard error of the mean summed in quadrature with the period and amplitude errors from Table 2 propagated through the metallicity calculation. Held et al. (1999) previously estimated the mean metal abundance of Phoenix by comparing the RGB in the , CMD. Through this method, they obtained a mean abundance of dex with which our abundance calculation from the RR Lyrae population agrees within the uncertainties. Meanwhile, Hidalgo et al. (2009) calculated the mean metallicity of Phoenix to be dex from their SFH analysis (where they assumed ), with which our metallicity also agrees well.
An alternative method for determining the metallicities of RRab stars involves using the shape of their light curves. Jurcsik & Kovács (1996) originally calibrated this relation using the period and Fourier parameter , finding that:
| (4) |
More recently, Nemec et al. (2013) re-calibrated this relation using RR Lyrae stars in the Kepler field, finding:
| (5) |
We note that it is necessary to first convert the values in the -band to the Kepler system before computing the metallicities this way. We use the calibration of Nemec et al. (2011) for this conversion, where they find that . Alcock et al. (2000) compared their calibration with that of Jurcsik & Kovács (1996), noting that metallicities using the latter relation must be shifted by -0.2 dex in order to place them on the same metallicity scale. Since the Nemec et al. (2013) calibration is on the same scale as Jurcsik & Kovács (1996), we shift the metallicities using both relations by -0.2 dex to place everything on the Alcock et al. (2000) metallicity scale.
A direct Fourier decomposition of the dataset was not considered to be the most effective method of determining given the low number of data points. Instead, we opted to use the method of template Fourier fitting as described by Kovács & Kupi (2007), which is better suited for light curves containing less than 20 data points. In particular, we utilized the Template Fourier Fitting (TFF) code provided by Kovács & Kupi (2007) for the fitting process using the FITLC determined periods in conjunction with the -band light curves as input. The Fourier amplitude and phase coefficients are then calculated by comparing with 248 RRab light curve templates. The phase coefficient, , was extracted from these TFF fits and used to determine metal abundances for the probable RRab stars in Phoenix using the two relations previously mentioned.
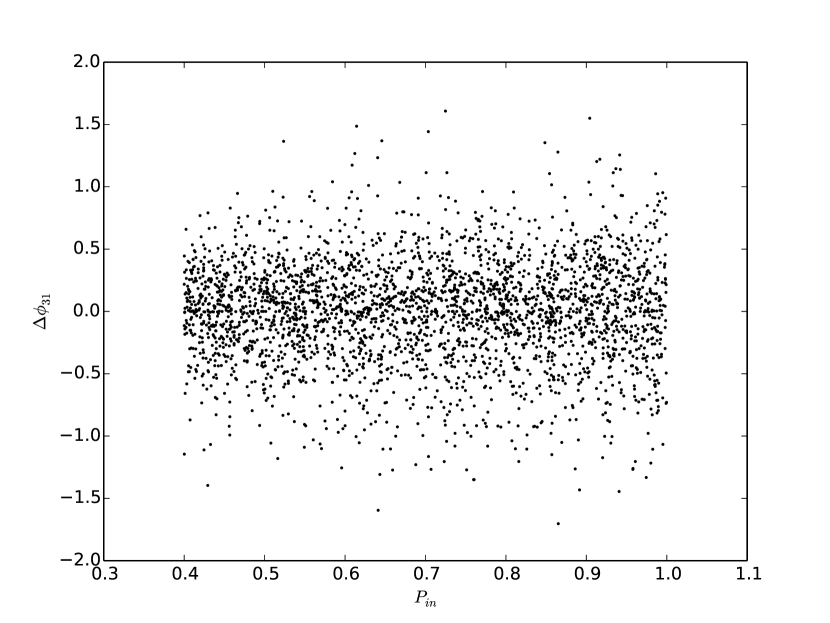
We performed artificial RR Lyrae simulations similar to those described in Section 3 in order to estimate the errors in . The only modification was to run TFF on the artificial RR Lyrae stars using the periods calculated by FITLC. The errors derived in this way are also tabulated in Table 2. Figure 13 illustrates the differences in the input and output values versus input period from the simulations for the outer field. These results show that there are no biases in our data resulting in systematic errors or degeneracies in the fit values from TFF. The simulations for the inner field conclude the same. Thus, we expect no systematic errors in the metallicities calculated from .
In order to compare the abundances from the different relations, we show the MDF resulting from each calculation in Figure 14. While the results from the RR Lyrae candidates have greater signal (less Poisson noise), this set of candidates is likely contaminated by various other variable types (e.g. the likely anomalous Cepheid discussed in Section 5.1). Therefore, in an effort to compare abundances of bona fide RR Lyrae stars only, we exclusively refer to the probable RR Lyrae results in this comparison as well as in the rest of this paper. The MDFs in Figure 14 show binned histograms in each case using a bin size of 0.2 dex.
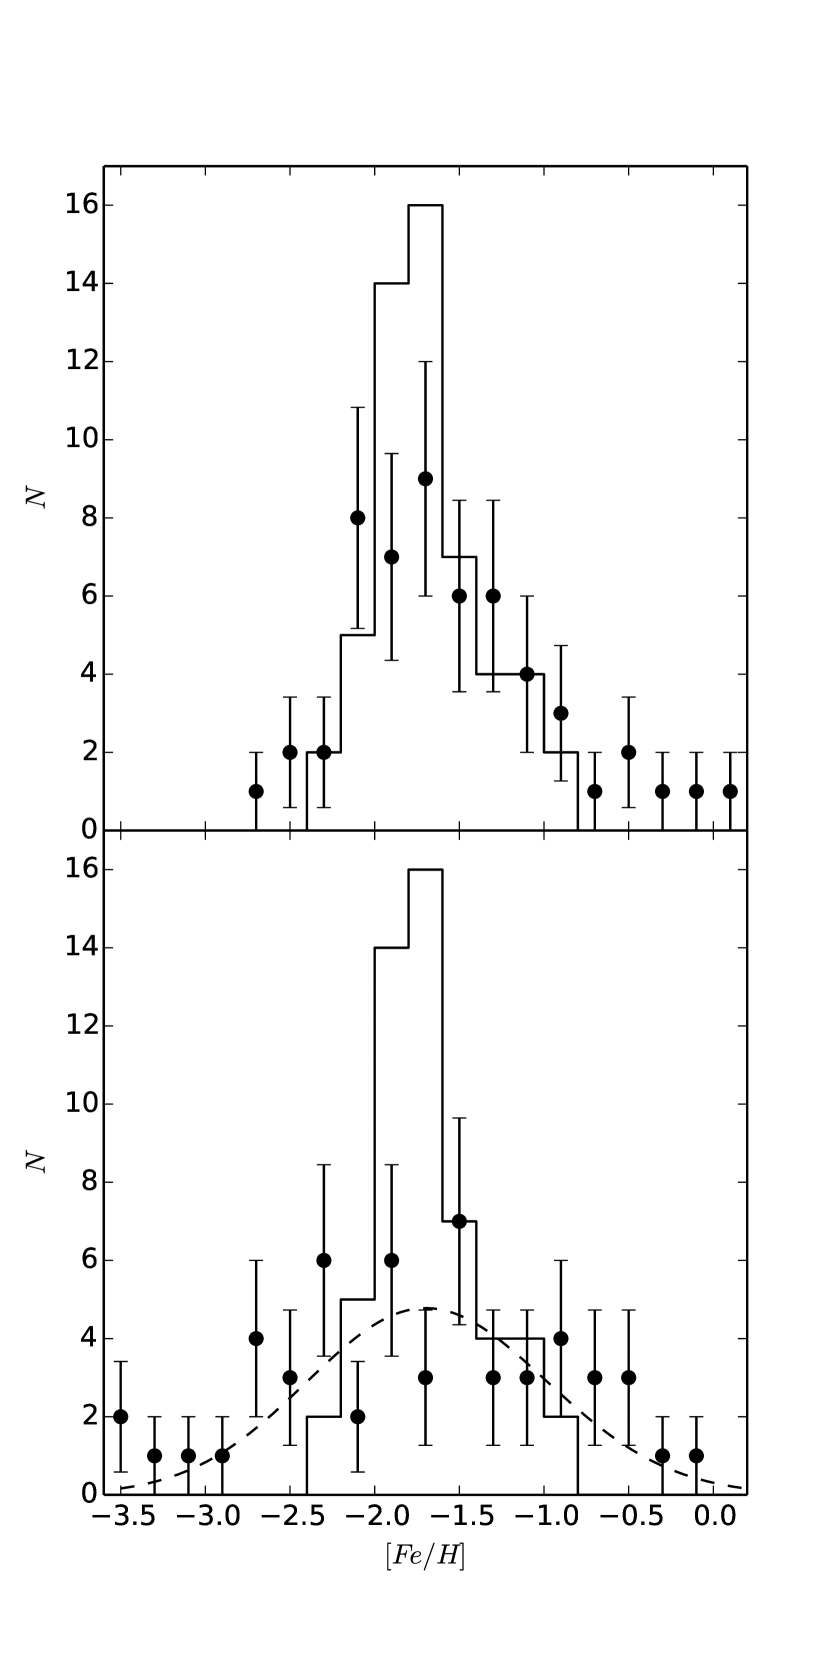
Qualitatively, it is apparent that the Jurcsik & Kovács (1996) MDF resembles the overall shape of the Alcock et al. (2000). Meanwhile the Nemec et al. (2013) MDF has much more noise with no discernible shape resembling the other two. The mean metallicity of the RRab stars using the Jurcsik & Kovács (1996) relation is dex. Using the Nemec et al. (2013) relation, the mean metallicity becomes dex (uncertainties represent errors in period and propagated through the metallicity calculation summed with the standard error of the mean in quadrature). In comparison the mean abundance from the Alcock et al. (2000) relation yields dex, which is significantly closer to the other abundance determinations previously mentioned ( dex and dex; Held et al. (1999); Hidalgo et al. (2009)) than the mean abundance using the Jurcsik & Kovács (1996) relation. Jurcsik & Kovács (1996) point out that their relation predicts systematically higher abundances for lower metallicity ( -2.0 dex) RRab stars when compared with the spectroscopic abundances, which could explain why the metallicities calculated using it are higher than the other determinations.
On the other hand, the mean abundance using the Nemec et al. (2013) relation lies closer to other determinations. However, it has an extremely large error, and its corresponding MDF appears significantly more noisy than the other two. We suspect this to be resultant from the characteristics of the dataset used in this study. Namely, while the data are high-quality in the sense that the photometric errors are low, there are few data points available for a Fourier decomposition to accurately determine the shape of the light curves even with TFF. Especially in the case of the Nemec et al. (2013) relation where there is a quadratic term as well as a term , these errors become large and are probably responsible for the poor quality of that corresponding MDF.
In order to test this speculation, we performed the following test. We constructed a generalized histogram for the Alcock et al. (2000) MDF assigning to each metallicity measurement an error equal to the error in using the Nemec et al. (2013) relation. This is shown as the dashed curve in Figure 14. That this generalized histogram agrees with the binned histogram of the Nemec et al. (2013) MDF supports the assertion that the two are in agreement, and the errors in act to add more noise to the MDF. Considering the results of this comparison, we consider the MDF using the Alcock et al. (2000) relation more accurate than the two using , and refer to it exclusively for the duration of this paper.
6 Discussion
A major goal of this work is to probe the early chemical evolution of Phoenix through the RR Lyrae stars and compare their properties to the analysis of Hidalgo et al. (2009). In particular, they perform a detailed study of the SFH of Phoenix as a function of time and position in the dwarf galaxy. In this section, we compare the chemical evolution law (CEL) at early times ( 10 Gyr ago) derived from their analysis with our results from the RRab stars.
First, we checked for any variation in RR Lyrae star properties with galactocentric distance since Phoenix has been observed to contain a stellar population gradient (Ortolani & Gratton, 1988; Martínez-Delgado et al., 1999; Held et al., 1999). Specifically, younger stars are centrally concentrated while the older RGB stars are present throughout the entire galaxy. We further investigated this gradient for the very old stars by examining the properties of the RR Lyrae stars as a function of galactocentric distance. We found no trends in metallicity, pulsation period, or pulsation amplitude for the RR Lyrae stars in Phoenix as a function of galactocentric distance, consistent with recent work by Hidalgo et al. (2013) which determined that the oldest stellar populations in dwarf transition-type galaxies, specifically Phoenix, are coeval at all galactocentric radii. This is also consistent with our analysis in Section 5.1 where we found no significant difference in RRab periods between the two observed fields. This implied spatial homogeneity of the RRab population in Phoenix justifies combining the RRab stars from both observed fields to perform the subsequent analysis of the CEL of Phoenix.
We note that in their analysis, Hidalgo et al. (2009) constructed a grid of 16 different parameterizations of the synthetic CMDs used to calculate the SFH of Phoenix. They average these solutions for the final solution and take the 1- dispersion in the solutions as the uncertainty associated with their model SFH. Using these methods, they calculate the metallicity of Phoenix at a look-back time of 10 Gyr to be dex (with the assumption that ). They compare this CEL with several chemical evolution models, of which only the closed-box and the outflow models are compatible. This coupled with the overall shape of the RR Lyrae MDF motivated our choice of the closed-box as our fiducial model.
Since Hidalgo et al. (2009) did not consider the effects of alpha-enhancement in their models, we do the same for the sake of comparison and consider using the metallicities, , calculated for the RRab stars using Equation 3 in Section 5.3. We fit to the RRab MDF a closed-box model of the following form:
| (6) |
where is the initial metal abundance of the system, and is the yield. The sum of these two quantities equals the average metal abundance of the system so that (Pagel, 2009). Therefore, the peak of this abundance distribution in logarithmic space is at .
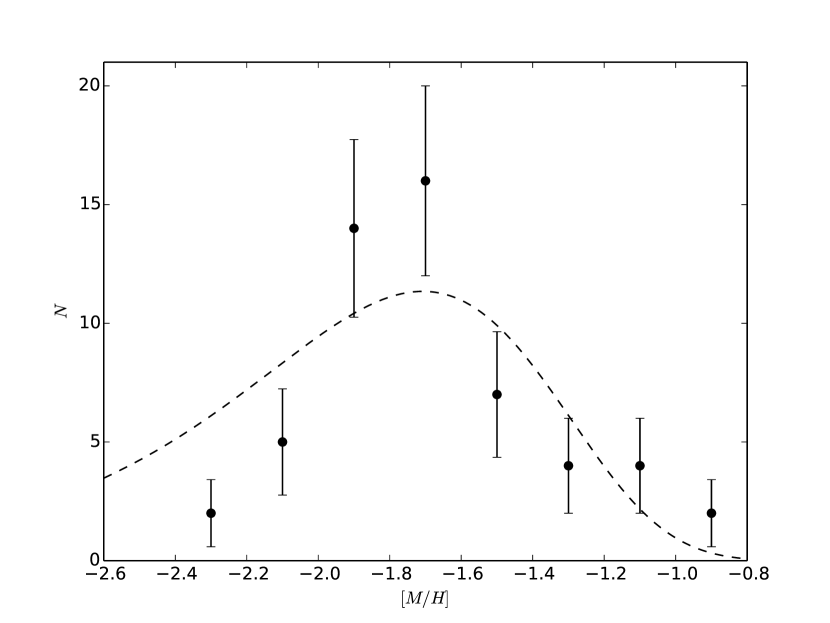
Figure 15 shows a pure closed-box with no pre-enrichment, where . A least-squares fit of this model to the data results in a yield of ( dex). This best fit is plotted over the MDF in Figure 15. While the resultant value for the mean metallicity does agree with the CEL from Hidalgo et al. (2009), this model clearly fails to reproduce the shape of the RRab MDF. In particular, the pure closed-box is marked by a significant low metallicity tail that is not observed in the RRab MDF. This issue, the so-called G-dwarf problem (van den Bergh, 1962; Schmidt, 1963), is known to be ubiquitous in galaxies (Harris & Harris, 2000; Binney & Merrifield, 1998), and has had extensive study devoted to its resolution. Multiple solutions to this problem have been proposed, and we proceed to investigate one such scenario for Phoenix, namely the pre-enrichment scenario.
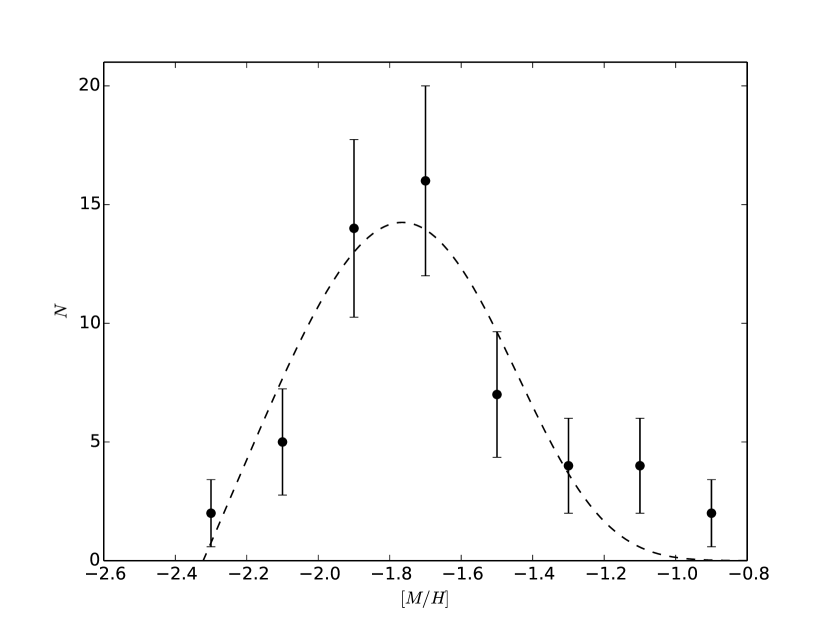
This analysis indicates that the MDF of Phoenix at an early age is not consistent with a pure closed-box CEL. To attempt to reconcile the MDF with a chemical evolution model, we consider the scenario in which the galaxy was born with a non-zero metallicity, . Under this assumption, we again fit a closed-box given by Equation 6 to the MDF of Phoenix, but this time allowing to vary as a free parameter. We find that a least-squares fit of a pre-enriched closed-box model agrees well with the RRab MDF of Phoenix as illustrated in Figure 16. The probable RRab MDF is best fit with a closed-box with an initial metal abundance of ( dex) and a yield of , which translates to a mean metallicity of dex for the system. The uncertainties quoted for these metal abundances represent the standard deviations calculated from the covariance matrix of the model parameters of the fit (), while that of the metallicity represents their propagation through the metallicity calculation. This agrees very well with the CEL of Phoenix at early times from Hidalgo et al. (2009) yielding a metallicity of dex. This value was obtained by averaging the metallicities of their model for ages Gyr.
Our analysis thus indicates that the old epoch of star formation associated with the RR Lyrae variables present in Phoenix is consistent with a pre-enriched closed-box model. We now consider the physical interpretation of this scenario in the context of the current understanding of galaxy formation and evolution. The over estimation of low metallicity stars by a pure closed-box model, the ubiquitous G-dwarf problem, is reconciled with the observed RRab MDF if some form of chemical pre-enrichment had occurred in Phoenix prior to the formation of these old stars.
Many studies have previously investigated possible scenarios leading to such pre-enrichment in galaxies. Truran & Cameron (1971) first proposed the idea of a generation of pre-galactic star formation which preferentially formed massive stars. This early generation of high mass stars would then evolve rapidly and promptly enrich the early galaxy forming environments. Thus such galaxies would form from material previously enriched by this initial, short lived generation of stars. In the case of Phoenix, such prompt initial enrichment would manifest itself as an RR Lyrae MDF described by a pre-enriched chemical evolution model. Another possible source of chemical pre-enrichment could be extra-galactic. In particular, one might imagine a scenario in which chemically enriched material from a further evolved, neighboring galaxy is transferred to the system . However, we point out that the isolated status of Phoenix in the Local Group makes this situation unlikely.
Our analysis concludes that Phoenix chemically evolved similar to a pre-enriched closed-box as evident from the RR Lyrae MDF. The parameters of the best fit closed-box model to this MDF agree with the analysis of Hidalgo et al. (2009), supporting their SFH analysis for the early evolution of Phoenix. We interpret this result as evidence that the prompt initial enrichment scenario for galaxies first proposed by Truran & Cameron (1971) likely occurred in Phoenix.
7 Conclusions
We have presented the first detailed study of the RR Lyrae stars populating the Phoenix dwarf galaxy. We used light curve template fitting routines to identify and characterize RR Lyrae variables within Phoenix using archival WFPC2 data. The cadence and phase coverage of these data coupled with our fitting routines allowed us to increase the number of highly probable RR Lyrae stars to , with more RR Lyrae candidates observed outside of the instability strip. The mean periods calculated for the two types of RR Lyrae found in Phoenix are d and d for the ab- and c-types, respectively.
We have used the properties of the RR Lyrae population within Phoenix to probe its behavior at early times. Using the best fit light curve properties, we have constructed the Bailey diagram for the RR Lyrae stars in Phoenix which displays the RRab stars apparently following the OoI relation. However, the position of Phoenix in the [Fe/H]- plane lies within the Oosterhoff gap, indicating that it is likely of intermediate Oosterhoff type. This is consistent with most other Milky Way dwarf satellite galaxies, however the discrepancy between the Bailey diagram and the calculated values of and warrants further investigation.
We used the minimum light colors of the RRab stars in Phoenix to estimate the line of sight reddening to the galaxy. Using this method, we calculated the reddening to Phoenix to be mag. This does not agree well with the Schlegel et al. (1998) maps. However, this does qualitatively agree with previous determinations of the reddening to Phoenix indicating internal sources of extinction resulting in such a discrepancy.
We also studied the RR Lyrae star properties as a function of galactocentric radius in Phoenix and found no significant trends, consistent with the previously observed stellar population gradient for old stars in the dwarf galaxy. In particular, we found no significant trends in , [Fe/H], or with respect to distance from the center of Phoenix in our RR Lyrae sample. We did however find a small but significant difference in mean RRc period, , between our two observed fields.
Finally, we fit a closed-box chemical evolution model to the MDF of the RRab stars in Phoenix. Using the pulsation periods and amplitudes of the RRab stars, we calculated their metallicities using the period-amplitude-metallicity relation from Alcock et al. (2000). We obtained a mean metallicity for the probable RRab stars in Phoenix of dex. We found that a pure closed-box devoid of pre-enrichment poorly fit the MDF. However, a pre-enriched closed-box fits the MDF much better. The average metallicity associated with this best fit pre-enriched model, dex, agrees well with the CEL for Phoenix derived by Hidalgo et al. (2009), supporting the notion that this galaxy chemically evolved similar to a pre-enriched, closed-box at a young age. Due to the isolated nature of Phoenix, we speculate that this pre-enrichment was not likely from any external source. Instead, we suggest that the prompt initial enrichment scenario in which material that contributed to the formation of Phoenix likely experienced an early generation of star formation marked by preferentially massive stars.
References
- Alcock et al. (2000) Alcock, C. et al., 2000, AJ, 119, 2194
- Bianchi et al. (2012) Bianchi, L., Efremova, B., Hodge, P., Massey, P., & Olsen, K., 2012, AJ, 143, 74
- Binney & Merrifield (1998) Binney, J. & Merrifield, M., 1998, Galactic Astronomy (Princeton, NJ : Princeton University Press)
- Cardelli et al. (1989) Cardelli, J. A., Clayton, G. C., & Mathis, J. S., 1989, ApJ, 345, 245
- Catelan (2009) Catelan, M., 2009, Ap&SS, 320, 261
- Clement & Rowe (2000) Clement, C. M. & Rowe, J., 2000, AJ, 120, 2579
- Dolphin (2000) Dolphin, A. E., 2000, PASP, 112, 1383
- Dorfi & Feuchtinger (1999) Dorfi, E. A. & Feuchtinger, M. U., 1999, A&A, 348, 815
- Fernley (1998) Fernley, J., Carney, B. W., Skillen, I., Cacciari, C., & Janes, K., 1998, MNRAS, 293, L61
- Gallart et al. (2004) Gallart, C., Aparicio, A., Freedman, W. L., Madore, B. F., Martínez-Delgado, D. & Stetson, P. B., 2004, AJ, 127, 1486
- Guldenschuh et al. (2005) Guldenschuh, K. A., Layden, A. C., & Wan, Y., 2005, PASP, 117, 833
- Harris & Harris (2000) Harris, G. L. H. & Harris, W. E., 2000, AJ, 120, 2423
- Held et al. (1999) Held, E. V., Saviane, I., & Momany, Y., 1999, A&A, 345, 747
- Hidalgo et al. (2009) Hidalgo, S. L., Aparicio, A., Martínez-Delgado, D. & Gallart, C., 2009, ApJ, 705, 704
- Hidalgo et al. (2013) Hidalgo, S. L. et al., 2013, ApJ, 778, 103
- Holtzman (1995) Holtzman et al., 1995, PASP, 107, 156
- Jurcsik & Kovács (1996) Jurcsik, J. & Kovács, G., 1996, A&A, 312, 111
- Kovács & Kupi (2007) Kovács, G. & Kupi, G., 2007, A&A, 462, 1007K
- Krist, Hook, & Stoehr (2011) Krist, J. E., Hook, R. N., & Stoehr, F., 2011, in Society of Photo-Optical Instrumentation Engineers (SPIE) Conference Series, Vol. 8127, SPIE Conference Series
- Layden & Sarajedini (2000) Layden, A. C. & Sarajedini, A., 2000, AJ, 119, 1760
- Lee & Carney (1999) Lee, J.-W. & Carney, B. W., 1999, AJ, 118, 1373
- Liu & Janes (1990) Liu, T. & Janes, K., 1990, ApJ, 354, 273
- Mackey & Gilmore (2003) Mackey, A. D. & Gilmore, G. F., 2003, MNRAS, 343, 747
- Mancone & Sarajedini (2008) Mancone, C. & Sarajedini, A., 2008, AJ, 136, 1913
- Martínez-Delgado et al. (1999) Martínez-Delgado, D., Gallart, C. & Aparicio, A., 1999, AJ, 118, 862
- Massey et al. (2007) Massey, P. et al., 2007, AJ, 133, 2393
- Mateo (1998) Mateo, M., 1998, ARA&A, 36, 435
- Morgan et al. (2007) Morgan, S. M., Wahl, J. N., & W ieckhorst, R. M., 2007, MNRAS, 374, 1421
- Nemec et al. (2011) Nemec, J.M. et al., 2013, MNRAS, 417, 1022
- Nemec et al. (2013) Nemec, J. M. et al., 2013, ApJ, 773, 181
- Ortolani & Gratton (1988) Ortolani, S. & Gratton, R. G., 1988, PASP, 100, 1405
- Pagel (2009) Pagel, B. E. J., 2009, Nucleosynthesis and Chemical Evolution of Galaxies, Cambridge Univ. Press
- Peimbert et al. (1994) Peimbert, M., Colin, P., & Sarmiento, A., 1994, in Violent Star Formation, from 30 Doradus to QSOs, ed. G. Tenorio-Tagle (Cambridge: Cambridge Univ. Press), 79
- Sandage (1993) Sandage, A., 1993, AJ, 106, 719
- Sandage & Tammann (2006) Sandage, A. & Tammann, G. A., 2006, ARA&A, 44, 93
- Sarajedini et al. (2012) Sarajedini, A., Yang, S.-C., Monachesi, A., Lauer, T. R. & Trager, S. C., 2012, MNRAS, 425, 1459
- Schlafly & Finkbeiner (2011) Schlafly, E. F. & Finkbeiner, D. P., 2011, ApJ, 737, 103
- Schlegel et al. (1998) Schlegel, D. J., Finkbeiner, D. P, & Davis, M., 1998, ApJ, 500, 523
- Schmidt (1963) Schmidt, M., 1963, ApJ, 137, 758
- Schuster & West (1976) Schuster, H. E. & West, R. M., 1976, A&A, 49, 129
- Smith (1995) Smith, H. A., 1995, Cambridge Astrophysics Ser. Vol. 27, RR Lyrae Stars, Cambridge Univ. Press, Cambridge
- Truran & Cameron (1971) Truran, J. W. & Cameron, A. G. W., 1971, Ap&SS, 14, 179
- van den Bergh (1962) van den Bergh, S., 1962, AJ, 67, 486
- Yang et al. (2010) Yang, S.-C., Sarajedini, A., Holtzman, J. A. & Garnett, D. R., 2010, ApJ, 724, 799
- Yang & Sarajedini (2012) Yang, S.-C. & Sarajedini, A., 2012, MNRAS, 419, 1362
- Young et al. (2007) Young, L. M., Skillman, E. D., Weisz, D. R. & Dolphin, A. E., 2007, ApJ, 659, 331
| Filter | HJD - 2451900 (days) | Star magnitude | Magnitude error |
|---|---|---|---|
| F555W | 1925.66641 | 24.019 | 0.235 |
| F555W | 1925.67428 | 23.707 | 0.03 |
| F555W | 1925.69094 | 23.2 | 0.022 |
| F555W | 1925.73805 | 23.164 | 0.043 |
| F555W | 1925.7561 | 23.291 | 0.022 |
| F555W | 1925.8054 | 23.523 | 0.026 |
| F555W | 1925.82346 | 23.598 | 0.026 |
| F555W | 1925.87276 | 23.687 | 0.028 |
| F555W | 1925.89082 | 23.495 | 0.168 |
| F555W | 1925.93943 | 23.921 | 0.033 |
| F555W | 1925.95748 | 24.021 | 0.034 |
| F814W | 1926.62562 | 23.465 | 0.047 |
| F814W | 1926.67631 | 23.555 | 0.052 |
| F814W | 1926.69356 | 23.548 | 0.047 |
| F814W | 1926.74425 | 23.55 | 0.05 |
| F814W | 1926.7623 | 23.441 | 0.044 |
| F814W | 1926.81161 | 22.85 | 0.031 |
| F814W | 1926.82966 | 22.921 | 0.031 |
| F814W | 1926.87827 | 22.99 | 0.167 |
| F814W | 1926.89632 | 23.161 | 0.036 |
| F814W | 1926.94563 | 23.231 | 0.039 |
| F814W | 1926.96368 | 23.222 | 0.038 |
| F814W | 1927.01229 | 23.358 | 0.043 |
| ID | RA (J2000) | Dec (J2000) | Type | Period (d) | (mag) | (mag) | (mag) | (mag) |
|---|---|---|---|---|---|---|---|---|
| V00030 | 1 51 10.3023 | -44 23 46.811 | ab | 0.55 | 0.719 | 0.3 | 23.957 | 23.444 |
| V01828 | 1 51 9.385 | -44 24 7.623 | ab | 0.577 | 1.145 | 0.716 | 23.747 | 23.242 |
| V01850 | 1 51 12.7286 | -44 24 57.335 | c | 0.383 | 0.525 | 0.328 | 23.636 | 23.204 |
| V01851 | 1 51 7.3409 | -44 24 45.572 | ab | 0.657 | 0.642 | 0.379 | 23.767 | 23.153 |
| V01852 | 1 51 10.1339 | -44 24 39.903 | ab | 0.55 | 1.167 | 0.729 | 23.728 | 23.307 |
| V01862 | 1 51 10.6558 | -44 25 27.132 | ab | 0.6 | 0.877 | 0.548 | 23.826 | 23.246 |
| V01867 | 1 51 10.1103 | -44 24 23.18 | ab | 0.642 | 0.728 | 0.455 | 23.684 | 23.101 |
| V01868 | 1 51 9.5417 | -44 25 12.712 | ab | 0.571 | 0.89 | 0.556 | 23.783 | 23.27 |
| V01870 | 1 51 7.0235 | -44 25 7.425 | ab | 0.591 | 0.819 | 0.512 | 23.779 | 23.264 |
| V01877 | 1 51 11.3796 | -44 25 1.509 | c | 0.356 | 0.509 | 0.318 | 23.698 | 23.292 |
| V01889 | 1 51 11.3589 | -44 24 40.242 | c | 0.36 | 0.492 | 0.307 | 23.735 | 23.273 |
| V01900 | 1 51 9.4811 | -44 24 45.698 | c | 0.34 | 0.473 | 0.349 | 23.72 | 23.337 |
| V01904 | 1 51 6.6992 | -44 25 10.371 | ab | 0.591 | 0.746 | 0.466 | 23.713 | 23.178 |
| V01906 | 1 51 12.6181 | -44 25 15.33 | c | 0.37 | 0.626 | 0.31 | 23.735 | 23.251 |
| V01909 | 1 51 8.8591 | -44 25 23.986 | ab | 0.688 | 0.556 | 0.348 | 23.87 | 23.233 |
| V01926 | 1 51 11.6177 | -44 24 39.268 | ab | 0.575 | 0.375 | 0.235 | 23.806 | 23.21 |
| V01933 | 1 51 10.2845 | -44 24 58.76 | c | 0.364 | 0.35 | 0.131 | 23.785 | 23.463 |
| V08484 | 1 51 5.372 | -44 24 8.984 | ab | 0.528 | 1.104 | 0.69 | 23.791 | 23.334 |
| V08486 | 1 51 8.4435 | -44 24 16.779 | ab | 0.598 | 0.989 | 0.618 | 23.805 | 23.257 |
| V08503 | 1 51 1.9574 | -44 24 37.401 | ab | 0.584 | 0.896 | 0.56 | 23.814 | 23.298 |
| V08517 | 1 51 6.4885 | -44 24 49.23 | ab | 0.575 | 0.52 | 0.325 | 23.792 | 23.194 |
| V08519 | 1 51 3.5394 | -44 23 54.399 | ab | 0.54 | 1.194 | 0.746 | 23.743 | 23.297 |
| V08525 | 1 51 7.9508 | -44 24 9.073 | c | 0.33 | 0.521 | 0.326 | 23.742 | 23.378 |
| V08527 | 1 51 4.2859 | -44 24 20.434 | c | 0.29 | 0.258 | 0.176 | 23.739 | 23.391 |
| V08535 | 1 51 3.9698 | -44 24 26.839 | ab | 0.55 | 0.6 | 0.351 | 23.911 | 23.389 |
| V08547 | 1 51 6.6909 | -44 24 13.971 | ab | 0.52 | 0.705 | 0.42 | 23.836 | 23.297 |
| V08548 | 1 51 7.4302 | -44 24 33.553 | ab | 0.527 | 0.55 | 0.343 | 23.873 | 23.365 |
| V13413 | 1 51 5.4186 | -44 23 26.427 | ab | 0.55 | 0.9 | 0.5 | 23.853 | 23.411 |
| V13419 | 1 51 8.8069 | -44 23 35.074 | ab | 0.604 | 0.761 | 0.475 | 23.788 | 23.163 |
| V13426 | 1 51 8.3281 | -44 23 36.738 | c | 0.367 | 0.435 | 0.272 | 23.785 | 23.311 |
| V13428 | 1 51 5.9148 | -44 23 32.945 | ab | 0.633 | 0.452 | 0.282 | 23.878 | 23.248 |
| V13439 | 1 51 9.8959 | -44 22 48.219 | c | 0.27 | 0.283 | 0.166 | 23.795 | 23.421 |
| V00182 | 1 51 10.9012 | -44 26 16.739 | c | 0.352 | 0.43 | 0.269 | 23.756 | 23.305 |
| V00220 | 1 51 8.3127 | -44 26 19.618 | ab | 0.711 | 0.738 | 0.461 | 24.0 | 23.471 |
| V00221 | 1 51 8.4787 | -44 26 30.691 | ab | 0.64 | 0.6 | 0.375 | 23.994 | 23.542 |
| V00230 | 1 51 8.9078 | -44 26 37.951 | ab | 0.565 | 0.908 | 0.556 | 23.785 | 23.346 |
| V04487 | 1 51 7.5186 | -44 27 6.035 | ab | 0.56 | 1.2 | 0.752 | 23.27 | 22.728 |
| V04565 | 1 51 9.8315 | -44 27 33.477 | ab | 0.716 | 0.752 | 0.47 | 23.598 | 23.067 |
| V04566 | 1 51 7.132 | -44 27 39.686 | c | 0.393 | 0.482 | 0.301 | 23.609 | 23.197 |
| V04629 | 1 51 6.1442 | -44 27 19.921 | c | 0.341 | 0.494 | 0.309 | 23.745 | 23.328 |
| V04641 | 1 51 10.1578 | -44 27 25.703 | ab | 0.591 | 0.834 | 0.55 | 23.682 | 23.193 |
| V04642 | 1 51 11.5694 | -44 27 16.29 | c | 0.38 | 0.436 | 0.241 | 23.67 | 23.27 |
| V04663 | 1 51 8.3945 | -44 27 5.552 | ab | 0.557 | 0.637 | 0.398 | 23.708 | 23.112 |
| V04664 | 1 51 6.8452 | -44 27 25.634 | c | 0.36 | 0.418 | 0.23 | 23.769 | 23.338 |
| V04666 | 1 51 7.0685 | -44 26 54.726 | ab | 0.615 | 0.684 | 0.428 | 23.745 | 23.209 |
| V04675 | 1 51 5.7521 | -44 27 21.587 | c | 0.4 | 0.355 | 0.19 | 23.74 | 23.3 |
| V04677 | 1 51 11.3829 | -44 27 33.179 | c | 0.33 | 0.4 | 0.244 | 23.75 | 23.294 |
| V04694 | 1 51 9.5196 | -44 27 20.383 | ab | 0.57 | 1.237 | 0.776 | 23.469 | 23.035 |
| V04702 | 1 51 6.9907 | -44 27 10.772 | ab | 0.65 | 0.425 | 0.266 | 23.818 | 23.267 |
| V04708 | 1 51 8.0198 | -44 27 19.846 | ab | 0.64 | 0.679 | 0.4 | 23.741 | 23.171 |
| V04711 | 1 51 6.2346 | -44 27 44.12 | ab | 0.64 | 0.681 | 0.405 | 23.691 | 23.159 |
| V05076 | 1 51 7.2067 | -44 27 44.776 | ab | 0.662 | 0.75 | 0.45 | 24.118 | 23.827 |
| V15025 | 1 51 4.5119 | -44 27 24.002 | c | 0.4 | 0.409 | 0.223 | 23.419 | 23.025 |
| V15061 | 1 51 3.5596 | -44 26 36.829 | ab | 0.524 | 0.939 | 0.587 | 23.684 | 22.989 |
| V15146 | 1 51 2.0041 | -44 27 22.887 | c | 0.259 | 0.425 | 0.266 | 23.689 | 23.089 |
| V15193 | 1 51 3.5748 | -44 27 7.108 | ab | 0.6 | 0.595 | 0.372 | 23.769 | 23.235 |
| V15217 | 1 51 3.8976 | -44 26 53.091 | c | 0.35 | 0.43 | 0.269 | 23.702 | 23.291 |
| V15222 | 1 51 0.9742 | -44 26 22.131 | c | 0.307 | 0.346 | 0.216 | 23.723 | 23.29 |
| V15239 | 1 51 4.6409 | -44 26 44.189 | ab | 0.6 | 0.492 | 0.279 | 23.737 | 23.225 |
| V15264 | 1 51 1.9697 | -44 26 52.379 | ab | 0.6 | 0.959 | 0.599 | 23.799 | 23.361 |
| V15265 | 1 51 4.3707 | -44 27 40.149 | ab | 0.571 | 1.166 | 0.729 | 23.592 | 23.017 |
| V15267 | 1 51 2.8094 | -44 27 35.197 | ab | 0.616 | 0.705 | 0.44 | 23.835 | 23.333 |
| V15297 | 1 51 2.8737 | -44 26 41.092 | ab | 0.65 | 0.898 | 0.55 | 23.64 | 23.146 |
| V15330 | 1 51 1.1669 | -44 26 23.008 | ab | 0.53 | 1.058 | 0.657 | 23.73 | 23.18 |
| V15334 | 1 51 1.3606 | -44 26 41.063 | ab | 0.581 | 1.028 | 0.643 | 23.796 | 23.286 |
| V15397 | 1 50 59.5913 | -44 27 8.637 | ab | 0.56 | 1.063 | 0.665 | 23.746 | 23.293 |
| V24705 | 1 51 8.7395 | -44 25 37.304 | ab | 0.72 | 0.348 | 0.218 | 23.566 | 23.022 |
| V24730 | 1 51 7.7841 | -44 25 59.551 | ab | 0.61 | 0.999 | 0.624 | 23.707 | 23.271 |
| V24740 | 1 51 7.8297 | -44 25 48.525 | ab | 0.56 | 0.884 | 0.54 | 23.77 | 23.142 |
| V24758 | 1 51 7.6053 | -44 25 57.245 | ab | 0.558 | 1.161 | 0.725 | 23.48 | 22.962 |
| V24796 | 1 51 6.4818 | -44 26 7.381 | c | 0.4 | 0.466 | 0.244 | 23.693 | 23.277 |
| V24816 | 1 51 7.442 | -44 26 28.76 | ab | 0.574 | 0.857 | 0.535 | 23.755 | 23.15 |
| V24819 | 1 51 5.361 | -44 25 31.527 | ab | 0.592 | 0.857 | 0.535 | 23.761 | 23.281 |
| V24830 | 1 51 3.9655 | -44 26 15.488 | ab | 0.55 | 1.242 | 0.744 | 23.726 | 23.285 |
| V24859 | 1 51 4.7892 | -44 26 19.749 | ab | 0.56 | 1.156 | 0.722 | 23.826 | 23.299 |
| V24860 | 1 51 5.4346 | -44 25 35.49 | c | 0.397 | 0.48 | 0.3 | 23.73 | 23.331 |
| V24867 | 1 51 1.9257 | -44 25 54.047 | ab | 0.631 | 0.419 | 0.262 | 23.874 | 23.224 |
| V24930 | 1 51 5.4548 | -44 25 43.291 | c | 0.36 | 0.387 | 0.242 | 23.802 | 23.355 |
| ID | RA (J2000) | Dec (J2000) | Type | Period (d) | (mag) | (mag) | (mag) | (mag) |
|---|---|---|---|---|---|---|---|---|
| V00026 | 1 51 12.2262 | -44 23 50.628 | ab | 0.55 | 0.925 | 0.492 | 23.91 | 23.219 |
| V00029 | 1 51 10.6934 | -44 24 2.009 | ab | 0.566 | 0.806 | 0.504 | 23.903 | 23.2 |
| V01737 | 1 51 7.3919 | -44 25 9.917 | ab | 0.81 | 0.7 | 0.426 | 23.009 | 22.375 |
| V01920 | 1 51 8.6178 | -44 25 7.858 | ab | 0.606 | 1.071 | 0.669 | 23.707 | 23.245 |
| V01922 | 1 51 14.8559 | -44 24 36.817 | ab | 0.54 | 0.94 | 0.593 | 23.787 | 23.247 |
| V01935 | 1 51 12.8491 | -44 25 2.949 | ab | 0.53 | 0.988 | 0.594 | 23.799 | 23.253 |
| V01936 | 1 51 10.6045 | -44 25 33.379 | ab | 0.636 | 0.823 | 0.514 | 23.786 | 23.268 |
| V01964 | 1 51 9.6648 | -44 24 33.275 | ab | 0.54 | 1.17 | 0.727 | 23.772 | 23.287 |
| V01987 | 1 51 10.7769 | -44 25 12.145 | ab | 0.77 | 0.288 | 0.128 | 24.213 | 23.325 |
| V08460 | 1 51 6.265 | -44 24 1.739 | ab | 0.67 | 0.922 | 0.946 | 23.68 | 23.014 |
| V08478 | 1 51 5.1497 | -44 24 16.041 | ab | 0.501 | 1.285 | 0.803 | 23.83 | 23.338 |
| V08499 | 1 51 4.6759 | -44 24 43.511 | ab | 0.67 | 0.597 | 0.373 | 23.721 | 23.152 |
| V08518 | 1 51 6.2679 | -44 24 16.05 | ab | 0.648 | 0.7 | 0.231 | 23.733 | 23.202 |
| V08553 | 1 51 6.2555 | -44 24 57.4 | ab | 0.65 | 0.955 | 0.317 | 23.739 | 23.257 |
| V08557 | 1 51 5.5317 | -44 24 48.54 | ab | 0.71 | 0.626 | 0.391 | 23.807 | 23.305 |
| V08558 | 1 51 3.2475 | -44 24 25.363 | ab | 0.55 | 0.833 | 0.51 | 23.765 | 23.232 |
| V13436 | 1 51 9.5384 | -44 22 49.036 | ab | 0.555 | 1.0 | 0.618 | 23.806 | 23.194 |
| V04221 | 1 51 10.9832 | -44 27 48.207 | ab | 0.629 | 0.675 | 0.4 | 23.123 | 22.181 |
| V04269 | 1 51 6.6831 | -44 27 14.035 | c | 0.646 | 0.16 | 0.1 | 23.322 | 22.453 |
| V04354 | 1 51 12.5259 | -44 27 27.815 | ab | 0.641 | 0.572 | 0.358 | 23.375 | 22.452 |
| V04406 | 1 51 9.084 | -44 26 49.047 | ab | 0.665 | 0.552 | 0.345 | 23.364 | 22.599 |
| V04417 | 1 51 5.9308 | -44 27 32.915 | ab | 0.661 | 0.554 | 0.31 | 23.425 | 22.577 |
| V04418 | 1 51 7.4437 | -44 27 42.772 | ab | 0.506 | 1.06 | 0.662 | 23.63 | 23.071 |
| V04507 | 1 51 11.0036 | -44 27 49.6 | ab | 0.55 | 0.16 | 0.1 | 23.652 | 22.78 |
| V04570 | 1 51 7.5821 | -44 27 9.353 | ab | 0.603 | 0.733 | 0.458 | 23.755 | 23.177 |
| V04571 | 1 51 7.5345 | -44 27 41.459 | ab | 0.67 | 0.294 | 0.184 | 23.631 | 22.95 |
| V04712 | 1 51 9.3698 | -44 27 48.068 | c | 0.334 | 0.16 | 0.1 | 24.027 | 23.101 |
| V04721 | 1 51 7.9728 | -44 27 6.884 | ab | 0.614 | 0.628 | 0.393 | 23.741 | 23.204 |
| V04741 | 1 51 9.3652 | -44 27 36.423 | ab | 0.665 | 0.496 | 0.31 | 23.91 | 23.023 |
| V04799 | 1 51 11.1361 | -44 27 36.472 | ab | 0.481 | 1.379 | 0.871 | 23.825 | 23.342 |
| V14821 | 1 51 4.0875 | -44 27 17.392 | ab | 0.71 | 0.391 | 0.244 | 23.165 | 22.388 |
| V14932 | 1 51 1.6833 | -44 26 10.717 | ab | 0.79 | 0.3 | 0.15 | 23.602 | 22.542 |
| V15082 | 1 51 5.0753 | -44 26 52.258 | ab | 0.481 | 1.279 | 0.799 | 23.465 | 22.801 |
| V15143 | 1 51 1.7939 | -44 26 53.144 | ab | 0.52 | 1.366 | 0.854 | 23.706 | 23.291 |
| V15170 | 1 51 2.8397 | -44 26 38.914 | ab | 0.613 | 0.561 | 0.351 | 23.728 | 23.156 |
| V15191 | 1 51 5.4653 | -44 26 36.46 | ab | 0.601 | 0.738 | 0.461 | 23.78 | 23.262 |
| V15207 | 1 51 4.0704 | -44 27 40.983 | ab | 0.57 | 0.536 | 0.335 | 23.648 | 23.034 |
| V15242 | 1 51 3.9535 | -44 26 58.767 | ab | 0.58 | 0.668 | 0.396 | 23.818 | 23.223 |
| V15271 | 1 51 5.6198 | -44 26 51.548 | ab | 0.526 | 0.886 | 0.554 | 23.745 | 23.299 |
| V24727 | 1 51 4.6408 | -44 25 29.496 | ab | 0.709 | 0.462 | 0.288 | 23.632 | 22.681 |
| V24794 | 1 51 7.3438 | -44 26 23.126 | ab | 0.601 | 0.847 | 0.529 | 23.778 | 23.266 |
| V24906 | 1 51 8.3403 | -44 26 0.238 | ab | 0.58 | 0.987 | 0.617 | 23.85 | 23.272 |
| V24962 | 1 51 7.4637 | -44 26 26.23 | ab | 0.599 | 1.02 | 0.631 | 23.874 | 23.322 |