11email: andre.maeder@unige.ch 22institutetext: Institute for Astro- and Particle Physics, University of Innsbruck, Technikerstr. 25/8, A-6020 Innsbruck, Austria 33institutetext: Dr. Karl Remeis-Observatory & ECAP, University Erlangen-Nuremberg, Sternwartstr. 7, D-96049 Bamberg, Germany 44institutetext: Astrophysics group, EPSAM, Keele University, Lennard-Jones Labs, Keele, ST5 5BG, UK
Evolution of surface CNO abundances in massive stars
Abstract
Aims. The nitrogen to carbon (N/C) and nitrogen to oxygen (N/O) ratios are the most sensitive quantities to mixing in stellar interiors of intermediate and massive stars. We further investigate the theoretical properties of these ratios as well as put in context recent observational results obtained by the VLT-FLAMES Survey of massive stars in the Galaxy and the Magellanic Clouds.
Methods. We consider analytical relations and numerical models of stellar evolution as well as our own stellar atmosphere models, and we critically re-investigate observed spectra.
Results. On the theoretical side, the N/C vs N/O plot shows little dependence on the initial stellar masses, rotation velocities, and nature of the mixing processes up to relative enrichment of N/O by a factor of about four, thus this plot constitutes an ideal quality test for observational results. The comparison between the FLAMES Survey and theoretical values shows overall agreement, despite the observational scatter of the published results. The existence of some mixing of CNO products is clearly confirmed, however the accuracy of the data is not sufficient for allowing a test of the significant differences between different models of rotating stars and the Geneva models. We discuss reasons (for the most part due to observational bias) why part of the observational data points should not be considered for this comparison. When these observational data points are not considered, the scatter is reduced. Finally, the N/C vs N/O plot potentially offers a powerful way for discriminating blue supergiants before the red supergiant stage from those after it. Also, red supergiants of similar low velocities may exhibit different N enrichments, depending on their initial rotation during the main-sequence phase.
Key Words.:
stars: abundances – stars: early-type – stars: evolution – stars: fundamental parameters – stars: massive1 Introduction
Models for the evolution of massive stars are of utmost importance for wide fields of astrophysics. Among many others, they provide the basis for the interpretation of stellar populations in stellar clusters and galaxies (Maeder & Conti 1994), define the structure of supernova progenitors and nucleosynthesis yields (Bresolin et al. 2008). They are the starting point for predicting the properties of the first generation of stars (Bromm & Larson 2004) and for explaining exotic phenomena such as neutron stars, stellar black holes, and -ray bursts of the long-duration soft-spectrum type (Woosley & Heger 2012).
Differences in the massive star populations in various galactic environments (like blue-to-red supergiant ratios or Wolf-Rayet to O star numbers) have long since indicated that the standard theory of massive star evolution (e.g., Chiosi & Maeder 1986), which describes the stars as mass-losing non-rotating bodies parameterised by mass and chemical composition (metallicity), is not complete. More recently, progress in astrophysical observation, in particular from high-resolution spectroscopy and from asteroseismology, has shown more deviations from standard theory, e.g., in form of nitrogen enrichments of the surface layers of massive stars near the main sequence (MS).
Over the past two decades, a growing body of evidence has been assembled indicating that rotation (Meynet & Maeder 2000; Heger & Langer 2000; Meynet & Maeder 2005), binarity (Wellstein et al. 2001), and possibly magnetic fields (Maeder & Meynet 2005; Heger et al. 2005; Meynet et al. 2011) are as important factors for massive star evolution as mass-loss. Past developments are reviewed by Maeder & Meynet (2000), Maeder (2009), and Maeder & Meynet (2012) for single stars, and by Vanbeveren et al. (1998) and Langer (2012) in consideration of additional effects of massive binary star evolution. Martins & Palacios (2013) recently presented a quantitative comparison of currently available model grids, aimed at constraining the uncertainties on the predicted evolutionary paths from the theoretical side.
The importance and sources of internal mixing is a major concern of most recent models of stellar evolution, since mixing affects all of the model outputs. The models make detailed predictions of the surface properties (stellar parameters and chemical abundances) of massive stars that need to be compared to detailed observations for verification of the assumptions made in the models. So far, the most ambitious effort in this respect was the VLT-FLAMES Survey of massive stars in the Galaxy and the Magellanic Clouds (in brief, the ‘FLAMES Survey’ in the following, Evans et al. 2005, 2006). The quantitative analysis of a large number of early B-type stars covering a wide range of rotational velocities gave rise to challenges in the concept of rotational mixing (Hunter et al. 2008, 2009). In particular, the existence of highly nitrogen-enriched slow rotators (see also Morel et al. 2006; Nieva & Przybilla 2012; Rivero González et al. 2012) and nitrogen-normal fast rotators (together composing 40% of the sample stars) was found to contradict current model predictions.
Maeder et al. (2009) pointed out that the behaviour of the excess ratio, which is the primary evidence for this criticism, is a multivariate function
where is the mass of a star, its age, the (projected) rotational velocity, and the metallicity. In order to find a correlation of a multivariate function with a parameter ( in the case of the FLAMES Survey), it is necessary to limit the range of the other parameters involved as much as possible. Maeder et al. (2009) argued that the concept of rotational mixing is in fact supported, when the range of parameters is limited.
However, the enrichment of nitrogen is only one aspect of rotational mixing. With nitrogen, carbon and oxygen also have to follow tight correlations as participants in the CNO-bicycle, in addition to helium, which is the burning product (Przybilla et al. 2010). The most sensitive parameters to mixing are the nitrogen to carbon (N/C) and nitrogen to oxygen (N/O) ratios. In this respect, the N/C vs N/O plot of observed abundances is essential. This shall be studied further here.
We first investigate the properties of the N/C vs N/O diagram, both by analytical (Sect. 2) and numerical approaches (Sect. 3). In particular, we examine its sensitivity to the initial stellar masses, to the metallicity, and to the strength of mixing. We compare the recent determinations of CNO abundances for OB stars within the FLAMES Survey to the theoretical predictions and we try to analyse the discrepancies (Sect. 4). In Sect. 5, we perform our own line-formation computations for a 10% fraction of early B-type stars from the FLAMES Survey to re-assess the published results by Hunter et al. (2009). Finally, the conclusions from our investigations are summarised in Sect. 6.
2 Nuclear constraints on the N/C vs N/O plots
First, we examine the changes of the N/C vs N/O ratios predicted by the CNO cycle analytically. Two different simplifying hypotheses can be made. In the case of the most massive stars, the carbon 12C immediately reaches equilibrium by the CN cycle and is turned to 14N (see for example Maeder 2009). The oxygen 16O is slowly destroyed during the MS to produce nitrogen 14N. Thus, we take the number C of carbon atoms as a constant, and note by N and O the numbers of nitrogen and oxygen atoms. We consider only the most abundant isotopes of each of these elements. We have
| (1) | |||
| (2) |
One has to be careful about treating mass fractions and number ratios correctly. For example, with mass fractions, the above relations would be written:
| (3) | |||
| (4) |
The constant number of carbon atoms implies the constancy of the mass fraction . Each time a nitrogen atom is destroyed an oxygen atom is created, but their mass fractions are related as indicated, since turning 14N to 16O requires the addition of two nucleons, at the expense of the H-content.
In terms of numbers, we have
| (5) |
| (6) |
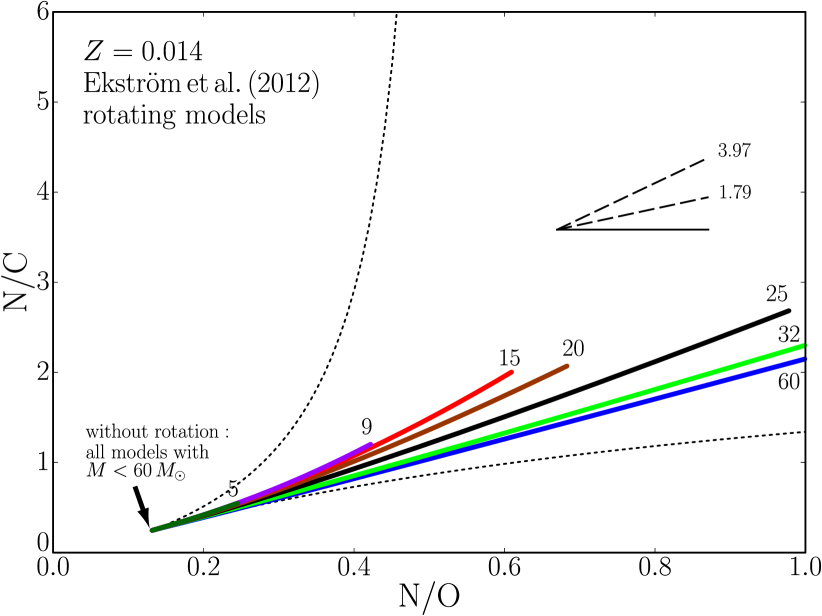
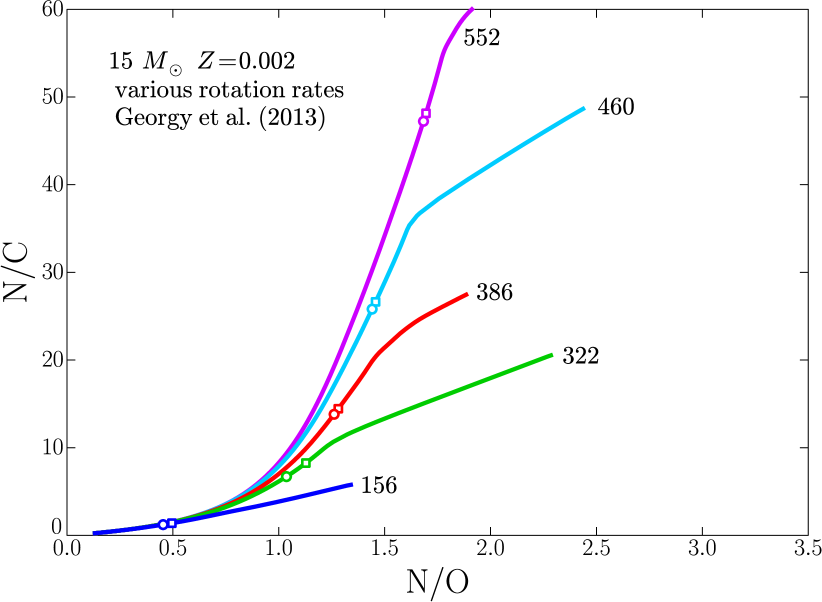
This means that the slope in a plot N/C vs N/O initially only depends on nuclear physics and initial CNO ratios111The reader may wonder why appear here the initial values of N/C and N/O, and not the values obtained after CN equilibrium. Actually, it can be shown that when the dilution factor is near 1, then the values of N/C and N/O appearing in the equations are actually initial values. The dilution factor is defined as the fraction of the mass with initial composition divided by the total mass which is mixed. This total mass is made from the mass with initial composition (initially in the envelope) and the mass with CN equilibrium composition (initially in the core).. In such a plot for massive stars, the first term on the right produces a linear relation, while the second one flattens the slope as the CNO cycle proceeds. We shall see this flattening of the curve for the most massive stars in Figs. 1, 2, 5, 6, 7, and 8 obtained from numerical models. There, the slopes for the most massive stars are lower than for intermediate masses, because of the more rapid transformation of oxygen into nitrogen in more massive stars.
Another simplifying assumption applies to the lower mass stars experiencing the CNO cycle. There, one may assume that the CNO cycle starts by converting 12C to 14N, keeping the 16O abundance about constant. This implies in numbers (Przybilla et al. 2010),
| (7) | |||
| (8) |
Thus, we have
| (9) |
leading to the ratio
| (10) |
There, the relation deviates upwards from a linear curve as more advanced products of the CNO cycle become visible. Figures in Sect. 3 show well this effect for the lower stellar masses (5-15 ) in the range considered.
With rotation included (Ekström et al. 2012), the new models predict N-enrichment down to 2 . For a moderate enrichment corresponding, for example, to N/O=0.3 and N/C=0.7 in intermediate and massive stars (see Fig. 1), we find from Eqs. (6) and (10), respectively, the following slopes:
| (11) |
These local average slopes, based on our two simplifying assumptions, are illustrated in Fig. 1. The slope for the lower mass stars is steeper than that of the higher mass stars, in agreement with the analytical predictions.
We may also note that Eqs. (6) and (10) can be integrated analytically. We call =N/C and =N/O. Eq. (6) with C constant becomes
| (12) |
which admits a solution of the form
| (13) |
where is a constant defined by initial conditions. This is
| (14) |
With the same notations for and , Eq. (10) with O constant becomes
| (15) |
This equation has the following solution:
| (16) |
where is another constant determined by the initial conditions. This is
| (17) |
The two solutions (14) and (17) are plotted in Fig. 1, which also presents the results of the numerical models discussed in the next Section. We see that these two solutions are tangent and encompass the model results close to the initial abundances, but they rapidly and largely deviate upwards and downwards from the numerical solutions when CNO-processed elements appear. This is not a surprise in view of the simplifying assumptions made. The analytical solutions are only valid for small departures from the initial abundances. The numerical models show intermediate values between the two limiting cases, as normally expected. We notice in this context that average slopes (6) and (10) over a limited interval are likely better simplifying assumptions, as illustrated by Fig. 1.
From the point of view of stellar physics, we recall that the N/C and N/O ratios do not always change simultaneously and in the same way. The branching ratio between the ON loops and the CN cycle is about at a typical temperature K. Thus, the conversion of C to N occurs at a lower temperature than that of O to N. Thus, the main effect in massive stars is that the conversion of C to N occurs much faster than that of O to N. The reactions also occur differently at different levels in the stars, but this has generally little consequence for massive stars on the MS, since efficient nuclear reactions occur in a large convective core. This may be different in later evolutionary phases. Thus, depending on the strength of the mixing processes at different levels in the stars and at different ages, the relations between the observed surface N/C and N/O ratios may be different. This explains why these relations are not always the same and may show differences as evolution proceeds.
3 Models for OB stars in the Galaxy, LMC, and SMC
3.1 Numerical models for solar abundances
Recent grids of the Geneva models (Ekström et al. 2012, hereafter E12) consider both non-rotating and rotating stars in the range of mass 0.8 to 120 . The rotating models have an initial velocity equal to 40% of the critical equatorial velocity. Three different sets of models have been made or are in progress with initial metallicities (E12), (Eggenberger et al. in prep.) and (Georgy et al. 2013a). Solar or scaled solar elemental abundances are adopted with the initial N/C and N/O ratios for solar abundances of 0.248 and 0.131 (by number), respectively.
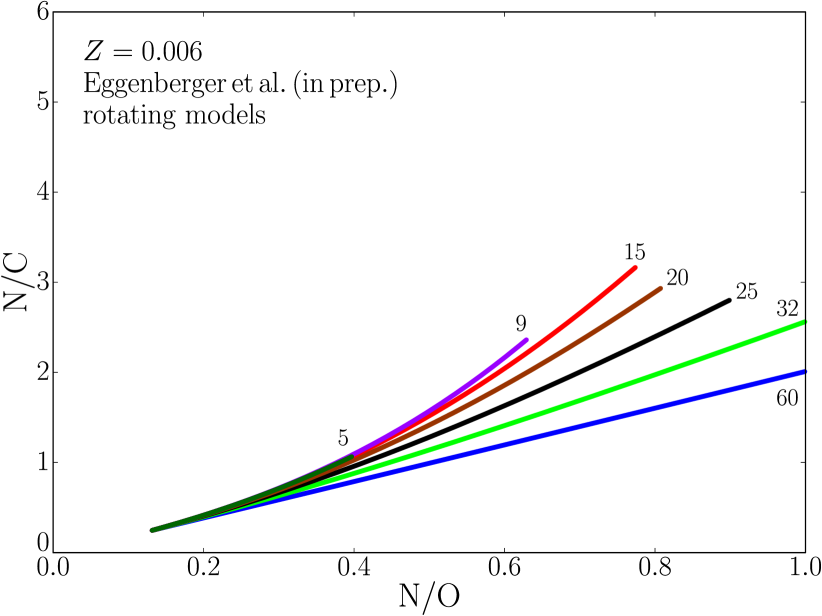
For , the initial mass fractions of the main CNO elements are , , and (Asplund et al. 2005, 2009). Figure 1 shows the relations N/C vs N/O during the MS for models from 5 to 60 . This means that the present results apply to clusters with ages between 4 and 110 Myr. For non-rotating stars, there is no enrichment in this mass interval, except at the end of the MS phase of the 60 model (there the change of surface composition is due to mass loss).
The rotating stellar models (E12), with an initial velocity of 40% of the critical one222The reader should be aware that the definition of used by Brott et al. (2011) and the definition used by the Geneva group are different and not exactly comparable., correspond rather well to the average observed velocities at each mass. As illustrated by Fig. 1 the relations are very close to linear for the whole MS phase. At 5 , the mixing is small and N/O reaches only 0.26 at the end of the MS phase. In agreement with relations (11), the less massive stars have the steepest slopes, while the relation is flatter for massive stars. The range of slopes span by the models during the MS phase is rather narrow. It is a bit smaller than the range given by the analytical approximation (11). This is understandable, since the analytical approximations apply to two extreme cases and the numerical models are between these extremes.
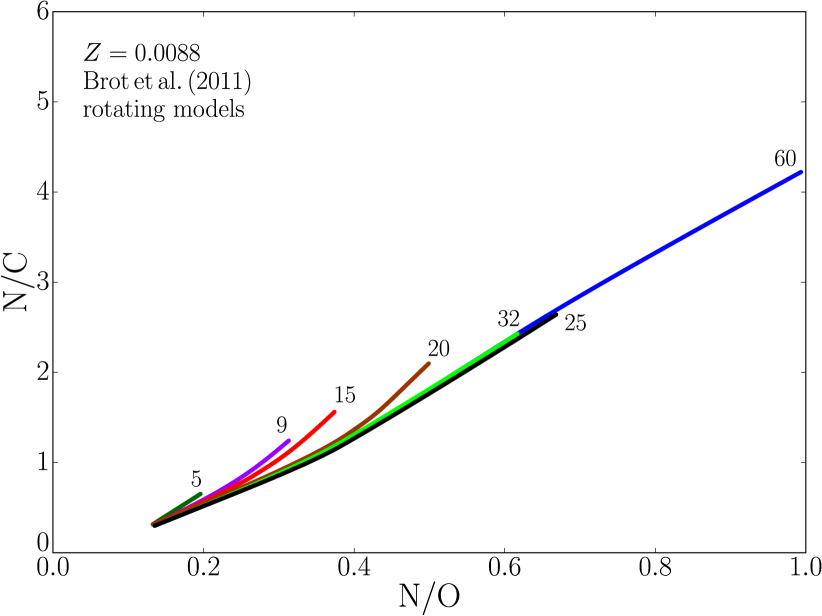
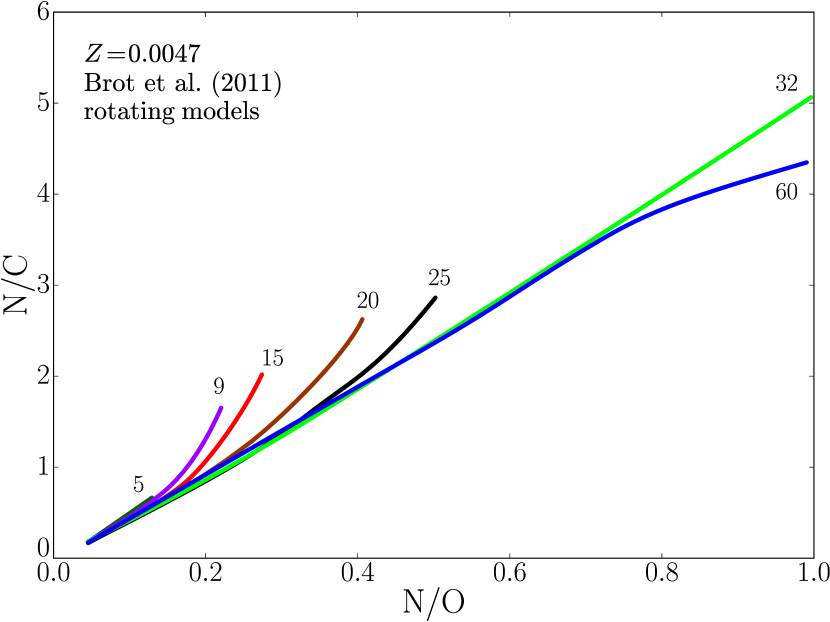
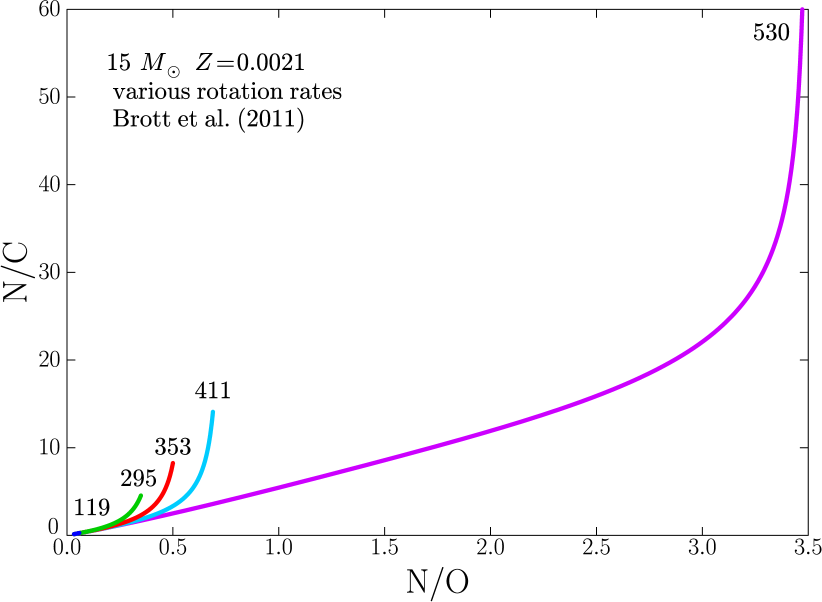
Figure 2 is identical as Fig. 1 but shows the models by Brott et al. (2011, hereafter B11), in some cases interpolations have been made from the grid of these authors. The metallicity of adopted by these authors is lower than the metallicity adopted in the Geneva models and based on Przybilla et al. (2008) and Nieva & Przybilla (2012), however the adopted CNO ratios are similar in both sets of models. The initial slope is the same as in the Geneva models, but it is a bit steeper in models by B11 away from the zero age MS. This may result from the different physics of mixing in the two sets of models. The main differences are: 1) the much larger overshoot parameter adopted by B11; 2) the Geneva models adopt an advecto-diffusion treatment for the meridional circulation, while B11 use a diffusion scheme; and 3) the models by B11 include magnetic field while the Geneva models do not. The large initial overshooting (since the pressure scale height is larger initially) favours a rapid surface increase of N/C by the CN cycle, while the contribution of the ON cycle becomes relatively more important in the course of evolution.
The extension of the tracks in Figs. 1 and 2 is a measure of the importance of mixing. We see that the N/C enrichments are about the same in both sets of models. However, the enrichments in N/O are larger, by at least 50%, in the Geneva models for the models with an average (rather low) velocity equal to 40% of the critical velocity. The effects are different for higher velocities, as shown below.
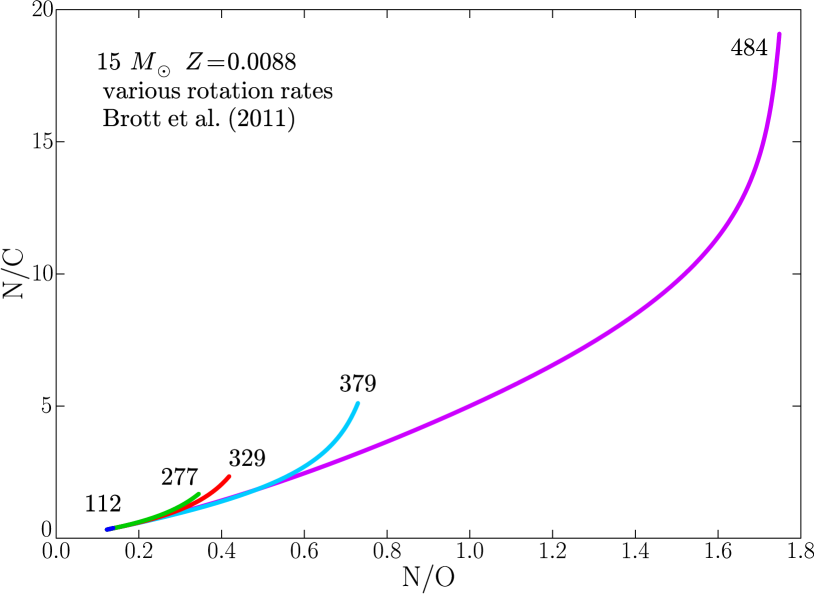
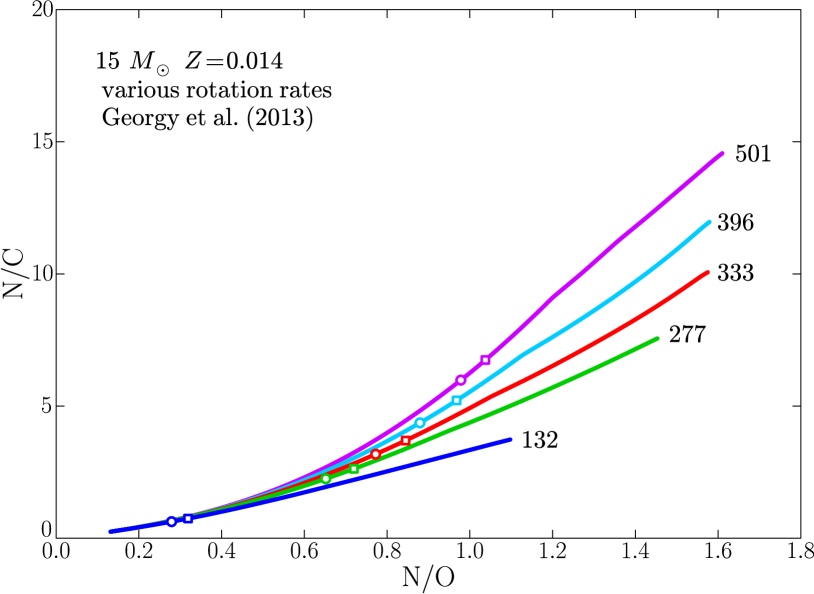
The effects of various initial rotational velocities in the N/C vs N/O plot are illustrated for 15 models in Fig. 3 (Georgy et al. 2013b) and in Fig. 4 (B11). The models are labelled by their equatorial velocity333Note that in terms of (as labelled in Georgy et al. 2013b), the 132 (277, 333, 396, and 501) km s-1 model corresponds to 0.3 (0.6, 0.7, 0.8, and 0.9) respectively.. The end of the MS phase is marked by a small open circle in Fig. 3. The beginning of the red supergiant phase is indicated by a small square. The (first) blue supergiant phase extends between the open circle and the square. Figure 4 only covers the MS of the models by B11. The behaviours of the two sets of models are different. For moderate velocities ( km s-1), as seen above, the N/O enrichments are higher in the Geneva models, while the more rapid rotators from B11 are more enriched. For the N/C ratio, the trend is the same.
Another difference between the two sets of models is that at a given value of N/O, the Geneva models by Georgy et al. (2013b) predict progressively higher N/C ratios for higher rotation velocities. The models by B11 predict tracks in the N/C vs N/O plot with only small deviations from the average relation, with maybe a trend that is inverse of that in the Geneva models. We will see below that this trend, i.e., higher N/C ratios for lower velocities at a given N/O value, is present in Fig. 10 from the B11 for the SMC composition. At this stage, the observations do not permit us to discriminate between the two sets of models.
On the whole, we may conclude that, at least for low or moderate N/O values, the deviations from a linear relation remain small: in all cases, for the models by B11, we see that at N/O=0.4, 0.6, and 0.8, the maximum N/C values are limited to approximatively 2.2, 3.8, and 5.8, respectively, while for the Geneva models these values are 1.2, 2.4, and 4.4, respectively. The concept of a linear relation between N/C and N/O over a significant range also applies when the enrichments are produced by accretion of CNO-enriched material in a close binary (provided there is no differentiation brought by the dilution and transfer processes). This implies that discrepancies between the observations and the theoretical relations (at least in their initial parts) are difficult to explain with binary effects. This may be the reason why, even with binaries it is difficult (B11) to reproduce the CNO observations. Even when the magnetic braking is taken into account, which enhances the mixing (Meynet et al. 2011), the N/C vs N/O relation follows the same linear trend at the beginning.
After the MS and the (first) blue supergiant phases, the models exhibit much larger effects of CNO processing. Large deviations from a linear relation may be present in the red supergiant phase () of models with high initial rotation velocities. For red supergiants, typical values of N/C are in the range of 2–15 and N/O values in the range of 0.7 – 1.7. Red supergiants resulting from fast rotating MS stars have higher N/C enrichments with respect to their N/O values than initially slowly rotating stars. This is visible from Figs. 3 and 9. The extended convective zones of red supergiants homogenise the layers above the H-burning shell. This produces an average composition reflecting the already existing internal enrichments. These effects suggest that red supergiants, despite their generally very low rotation velocities, may show large differences in their N/C and N/O ratios depending on their rotation velocities during the MS phase.
When the stars enter the Wolf-Rayet stages, most of the composition differences disappear since these stars essentially show products of the CNO cycle at equilibrium, rather than a dilution of products of the CNO cycle in a medium of original composition. Note that some WNL stars may still show effects of dilution, while this is certainly not the case for stars in the WNE phase, which are nearly pure helium objects. In WN stars (WNL and WNE), the N/C ratios are typically in the range 10-100 and N/O between 5 and 80. Of course, in the WC stage, these two ratios rapidly fall to zero.
3.2 Models for lower metallicities
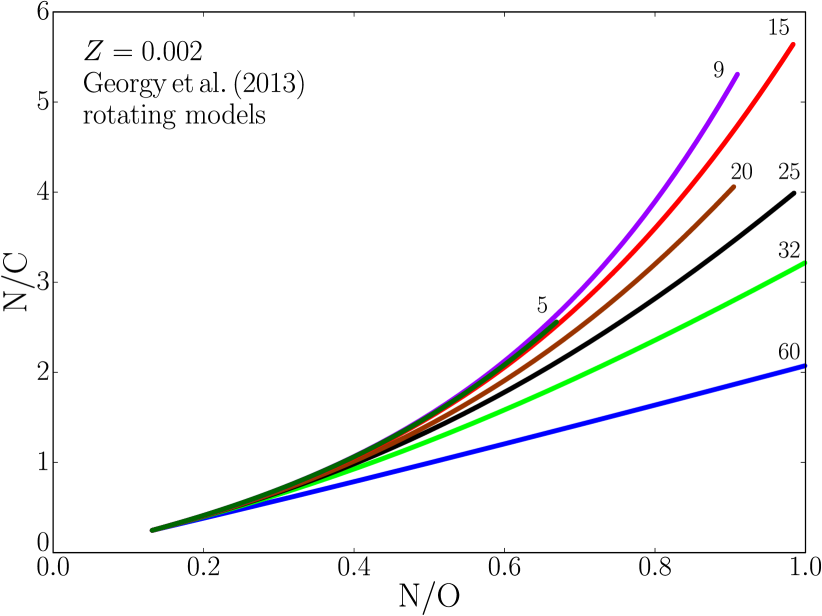
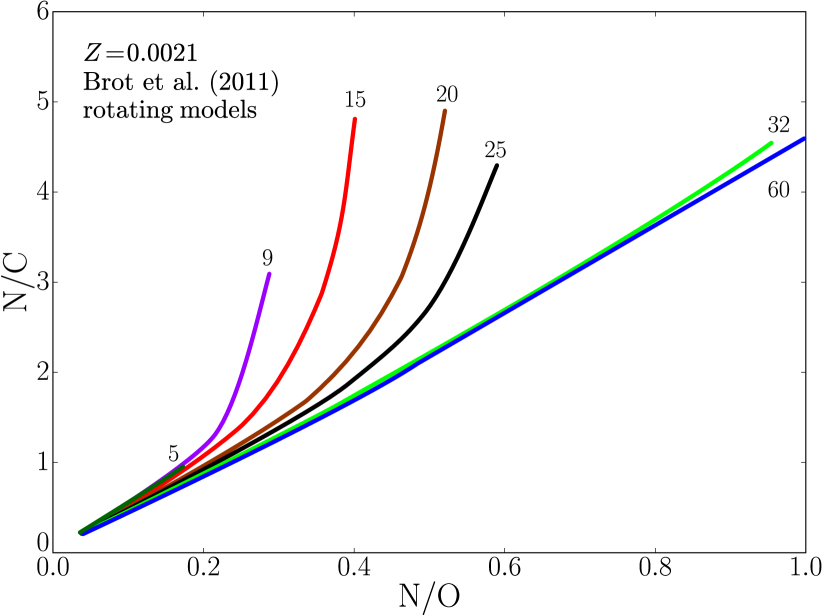
We use recent grids of numerical models of rotating stars for the metallicities of the Large and Small Magellanic Cloud (LMC and SMC) (Brott et al. 2011; Georgy et al. 2013a, Eggenberger et al., in prep.). Figures 5, 6, 7, and 8 show the N/C vs N/O plots for most of the MS phase of stars with initial masses in the range of 5 to 60 and for initial rotation velocities equal to 40 % of the critical values. Again, without rotation there would be no N-enrichments during the MS phase for all masses considered here from 5 to 60 included. From all models, we see, as already well known (Maeder & Meynet 2001), that at lower metallicities the mixing is stronger for a similar rotational velocity. This is due to steeper internal gradients of angular velocities at lower , which favour a stronger diffusion. This results in more extended curves, as well as larger maximum deviations between the curves in the N/C vs N/O plots.
The models by B11 use non-solar abundance ratios for the LMC and SMC, with nitrogen substantially under-abundant by 0.3 to 0.5 dex (by number) relative to the other chemical species (e.g., Garnett 1999; Korn et al. 2002, 2005; Rolleston et al. 2003). The initial N/C and N/O ratios are 0.141 and 0.035, respectively, for the LMC composition, and for the SMC they are 0.134 and 0.033. The Geneva models use solar CNO abundance ratios, which may apply to some low -galaxies with high star formation rates; their initial N/C ratio is 0.248 and the initial N/O ratio is 0.131. The differences with respect to the models by B11 amount to a factor of about 1.8 for N/C and 3.8 for N/O for the LMC and SMC. These differences in initial CNO compositions have some consequences that require particular attention, because they make the comparison of models difficult:
- 1.
- 2.
-
3.
The relative enhancements have to be estimated with accounts of the differences in the initial ratios. In contrast with what appears at first sight, the relative mixing is a bit higher, at least for fast rotation, in the models by B11 (Figs. 6, 8) than in the Geneva models (Figs. 5, 7). This is a consequence of the different physics in the models (cf. Sect. 3.1).
Both sets of models show that for low and moderate N/O ratios the differences between the curves corresponding to the average rotational velocities for various initial masses remain small. For example, in the Geneva models for (Fig. 5) and (Fig. 7), the maximum N/C values are 1.15 and 2.2 at N/O= 0.4 and 0.6 (i.e., a relative N/O increase by more than a factor of 5); this is the same as for solar composition. In the models by B11, the deviations in Fig. 6 for the LMC are even smaller: up to N/O=0.5, i.e., a relative increase by a factor of 14, the N/C ratio remains smaller than 2.9. In Fig. 8, the deviations are very limited up to N/O = 0.2, i.e., a relative increase of N/O by a factor of 6.
On the whole, if one wants to use slightly different initial CNO ratios for already existing models of a given , the following rule applies to the first order: the relative enhancements with respect to the initial composition remain the same. As seen above, a slight change of the mean slope may also result in some cases.
The effects of different initial rotational velocities for a given initial mass are also examined for the SMC metallicity. Figure 9 shows the results for the Geneva 15 models at (Georgy et al. 2013b). The N/C ratios can reach high values for high rotation velocities. However, up to N/O=0.8, the deviations from the unique linear relation remain small. At N/O=0.6 (relative enrichment larger than 5), the N/C ratio is below 2.4; at N/O=0.8 it lies below 4.4, even in the case of extreme rotation. This is similar to the solar metallicity case. Figure 10 shows the same kind of results for the models of a 15 star at for the SMC (B11). We also notice high N/C and N/O values for high rotation velocities. The deviations from the linear relation remain moderate up to N/O= 0.30 (a relative increase by a factor of 9). There the maximum N/C ratio is of the order of 3. Physically, the N/C vs N/O curves express the degree of dilution of the CNO abundances at equilibrium mixed with the initial CNO abundances. All stellar models evolve along identical curves, at least in their initial linear part. Depending on model assumptions, models may evolve along these curves more or less rapidly.
Comparing the two sets of models and taking the difference of the zero points into account, we see that, at least for high velocities, mixing is more important in the models by B11 than in the Geneva models for the different values, which confirms the remark made in Sect. 3.1. There is another noticeable general difference between the two sets of models, in line with the previous remark on Figs. 3 and 4. The Geneva models at a given N/O ratio show higher N/C ratios for higher initial rotational velocities, while at a given N/O value the models by B11 show higher N/C values for lower initial rotational velocities. This is a big difference, although not easy to test observationally. It likely results from a different history of mixing at various depths during MS evolution (cf. Sect. 2).
4 Recent CNO observations in open clusters
There are several data sources for observations of CNO abundances in Galactic massive stars (Przybilla et al. 2010). Open clusters form, in principle, homogeneous samples in age and composition. Here, we focus on a work that is recognised as a seminal study of the massive star content of open clusters at different , in the Galaxy, the LMC, and SMC: the FLAMES Survey. Observations of over 800 stars were performed with the Fibre Large Array Multi-Element Spectrograph (FLAMES) on the 8.2 m European Southern Observatory Very Large Telescope (ESO-VLT, Evans et al. 2005, 2006) and the main results of the chemical abundance analysis for about 300 stars were presented by Hunter et al. (2009, hereafter H09). The FLAMES Survey constitutes the largest sample of CNO abundances available in the three local galaxies and it has been used for various further analyses, particularly regarding the effects of stellar rotation on CNO abundances.
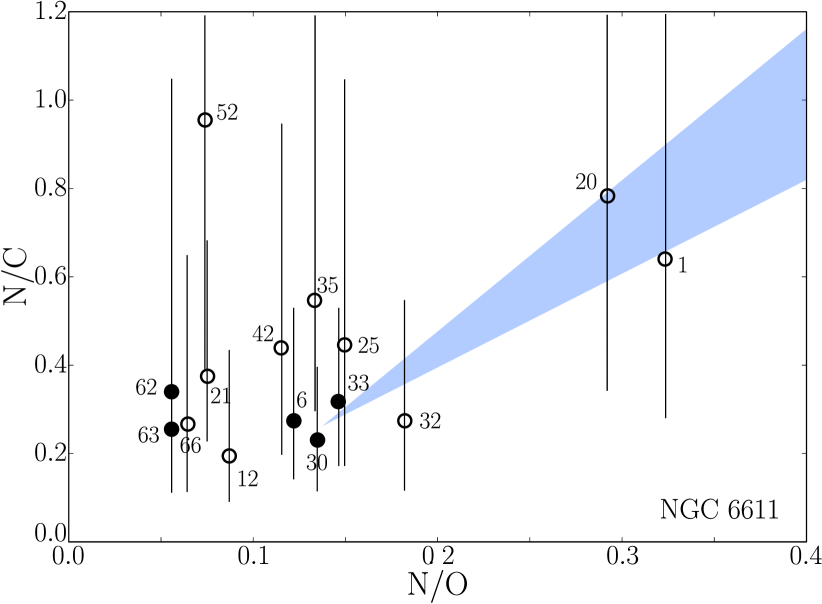
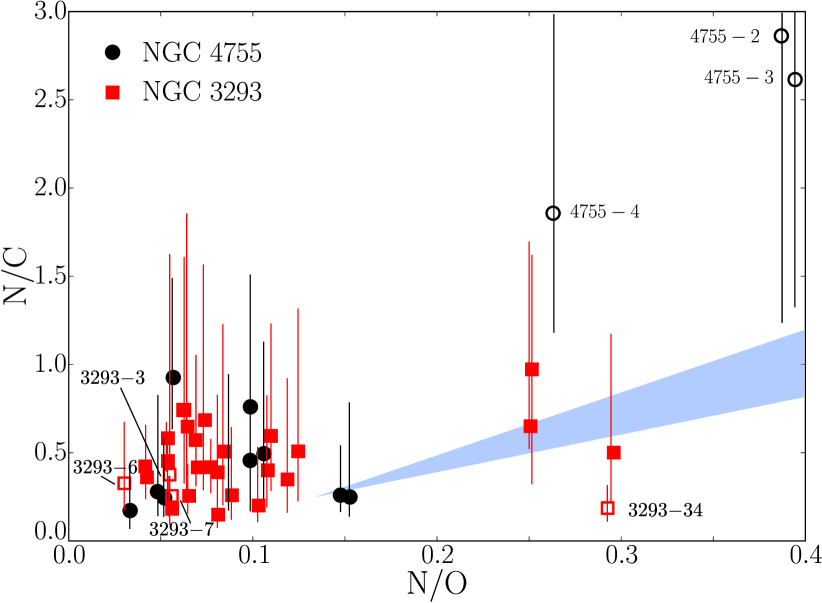
A warning is necessary here. The C-abundance is based on one C ii line at 4267 Å, interpreted with an empirical adjustment. This is why for the comparisons made in Fig. 11-15, we indicate the error bars on the N/C ratios in the N/C vs N/O plots of the various clusters studied in the Galaxy, LMC, and SMC. These plots were not used by H09 to derive their results (instead, their conclusions were based on nitrogen abundances only). We also avoid stars for which only upper limits are given. However, despite these difficulties, these comparisons with the N/C vs N/O plots provide an independent quality test of the data and also offer some new indications on the possible deviations from model predictions and on the status of blue supergiants.
4.1 OB stars in the Galaxy
In the Galaxy, the three clusters NGC 6611 (7.7 Myr), NGC 3293 (10.3 Myr), and NGC 4755 (16.4 Myr) have been observed444The ages come from the Webda database, http://www.univie.ac.at/webda. Figures 11 and 12 show the results of the comparisons between the domain covered by the Geneva models (Fig. 1) and observations. These figures show an offset of the objects with little or no enrichment with respect to the solar data given in Sect. 3 (N/C below 0.4 and N/O below 0.1). The offset can be understood as a consequence of the individual element abundances derived within the FLAMES Survey: while the carbon and nitrogen abundances are both about half solar, the oxygen abundance is only slightly sub-solar on average (regarding solar values of Asplund et al. 2005, 2009). Therefore, the offset in N/C is very small or even negligible, while the offset in N/O is much larger, with the observed values lower than the solar value. We refer for the further discussion of this to Martins & Palacios (2013) who have pointed out the unusual characteristics of the metallicity (about half solar) and, in particular, the C abundances found by the FLAMES Survey, when compared to several independent studies on Galactic stars.
The plot for NGC 6611 shows some scatter. However, most of the observed results are consistent with the model predictions from Fig. 1 indicated by a blue triangle in Fig. 11. As discussed below, only stars 6, 30, 33, 62, and 63 (filled symbols in Fig. 11) appear to be normal stars. The other stars are binaries or candidate binaries, and one star (52) is a Be star (all marked by open symbols in Fig. 11). So, part of the observed scatter may be due to this fact.
The observed N/C enrichments for stars in NGC 4755 appear larger than for stars in NGC 3293, they are also significantly larger than the theoretical predictions. In principle, as stated previously, over the range considered here, the theoretical predictions should essentially be model independent. Thus, either the observed difference is a consequence of the scatter or it may indicate that the real N/C values are higher than predicted by both sets of models considered above and that rotational mixing makes higher N/C values than those we simulate in the models. The repetition below of such a trend is to be underlined. Let us also note that the re-analysis of seven stars (labeled in Fig. 12) shows that while stars NGC 3293-3, 7, and NGC 4755-2 do appear as normal stars, although with poor fits, the other four stars are binaries (NGC 3293-6, NGC 4755-3,4) or an He-strong star (NGC 3293-34, see Table 1 and discussion in Sect. 5 and Appendix B).
4.2 OB stars in the LMC
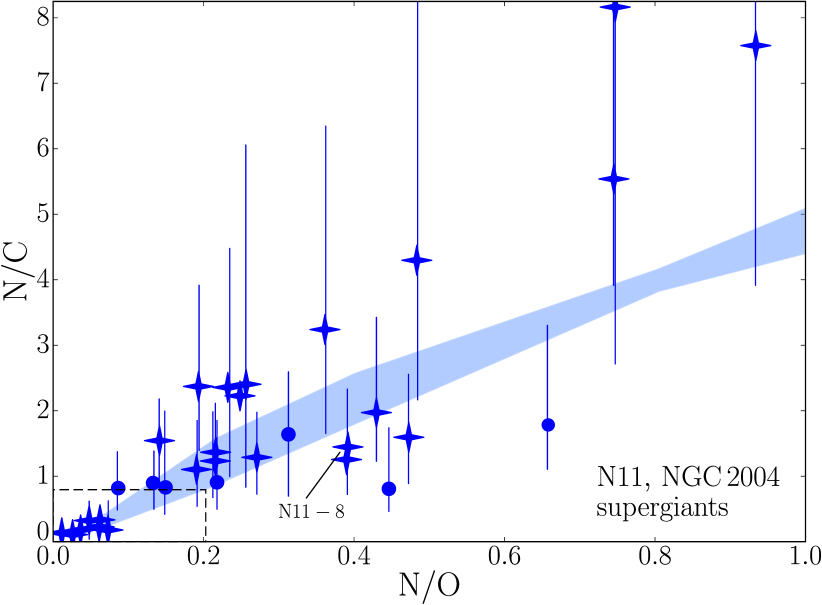
We now turn to the two young clusters N11 and NGC 2004 in the LMC. The cluster N11 is about 8-10 Myr (Evans et al. 2006), while NGC 2004 is older at of 25 Myr (Maeder et al. 1999). Figure 13 shows the comparison of the MS stars and the domain predicted by the models of Fig. 6 by Brott et al. (2011). We see no significant offset between the abundances of the non-evolved models and those of the stars with negligible N-enrichments (Martins & Palacios 2013). The predicted trend is globally compatible with observations, however, the possibility of distinguishing between models like those discussed in Figs. 5 and 6 seems unlikely on the basis of the present data. The reanalysis of nine stars discussed below in Sect. 5 (see also Table 1) indicate that only N11-95 and NGC 2004-90 are normal stars, while the other seven stars are binaries (N11-8, 72) or Be stars (N11-34, 39, NGC 2004-29, 53, and 100).
Figure 14 gives a broader view on the N/C vs N/O domain. The stars represented here are stars with . Noticeably, as we have seen above, some supergiant stars show higher N/C values compared to the theoretical predictions. Whether this is real or an effect of the scatter is uncertain. If real, this might either point towards many fast rotating stars or indicate an unaccounted effect in the mixing processes.
We point out that it is surprising to find several supergiant stars with very low values of N/O. Typically, see Fig. 6, one would expect that most blue supergiants would have N/O above 0.25-0.30, unless they would come from initial models with low initial velocities ( inferior to 40% of the critical velocity). We may also wonder whether some stars are blue supergiants right after the MS phase, occupying the lower branch in Fig. 14 , while supergiants with high N/C values could be blue supergiants following the red supergiant stage. Thus, the FLAMES survey brings about several interesting questions, which may likely be answered in the future.

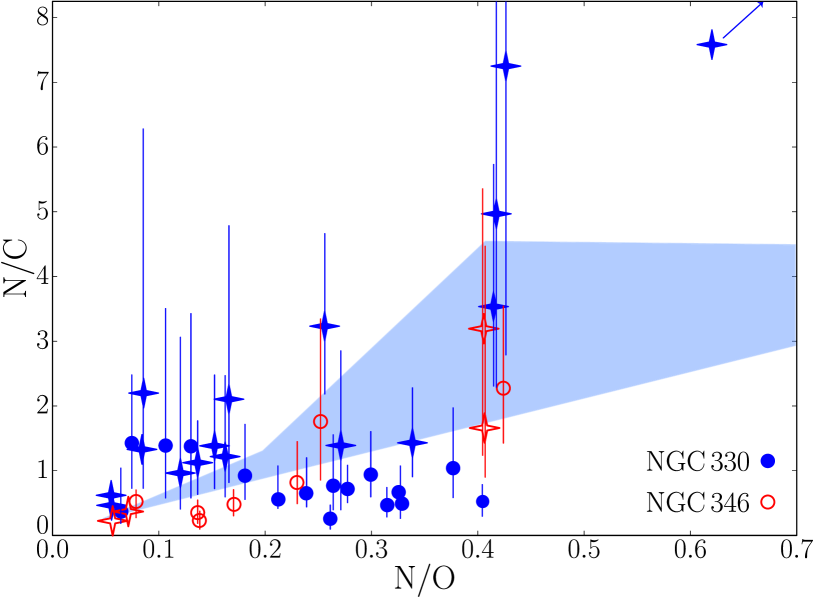
4.3 OB stars in the SMC
In the SMC, the two clusters NGC 330 and NGC 346 are considered. Both are 20 Myr old, according to Maeder et al. (1999). There seems to be two populations of stars in the latter cluster, one of very young stars of about 1 Myr and another one of 20 Myr (De Marchi et al. 2011), which may form most of the present sample.
Figure 15 confirms the results of previous figures. Also, we notice the absence of an offset between the observations and the models. Despite the scatter, there is much clearly evidences about internal mixing producing N enrichment at the expense of carbon and oxygen. We also note the existence of stars with high N/C values observed for rather low or moderate N/O ratios. Likely, such properties result from rapid rotation, however, it is still uncertain whether such excessively high N/C ratios indicate anomalous mixing or not. Nevertheless, the repetition of the same observed trend for all clusters considered in this work may be an indication in that direction.
5 A re-assessment of the observational constraints
An underlying scatter much larger than one may expect from considering changes in the initial mass, rotation, and model details on the nuclear path is clearly evident in the N/O–N/C data. To assess the significance of the scatter, we aim to confirm the results of H09 for a sub-sample of stars, both for objects following the nuclear path and for outliers. For the confirmation of the observational results we focus mostly on objects in the Galactic clusters (2/3 of the re-investigated sample) as spectra with the highest S/N were obtained for these. We further concentrate primarily on slow rotators (, 2/3 of the re-investigated sample), which facilitates uncovering details that are challenging to be identified in the lower-quality LMC and SMC data, and in faster rotators.
In the following, we aim to investigate all of the results for one target cluster, NGC 6611, to avoid any potential selection bias,. Then, additional targets were drawn from members of other clusters in the Milky Way and LMC, covering objects from the different star groups identified by H09 (e.g., N-rich slow rotators and N-normal fast rotators on the MS, evolved stars). In total, 31 stars were selected, see Figs. 11 to 14 for their identifications.
A straightforward confirmation of the FLAMES Survey results of H09 can be achieved under the premise that no matter the details of the model implementations, similar analysis results will be derived if they are sufficiently realistic. In particular, a good match of the synthetic with the observed spectra should be obtained globally, and in detail, as demonstrated by Nieva & Przybilla (2012, NP12). We therefore expect to find good agreement between the observed spectra and our model calculations when based on atmospheric parameters and abundances published by H09, except for small deviations that relate to details of the model implementations by H09 and by our analysis (see Appendix A for a short overview).
Non-LTE synthetic spectra (i.e., accounting for deviations from local thermodynamic equilibrium) for the elements investigated by the FLAMES Survey were computed, employing atmospheric parameters and elemental abundances adopted from H09555Extracted from the online data table available via the VizieR Service at CDS: http://vizier.u-strasbg.fr/viz-bin/VizieR. Table 1 summarises the atmospheric input parameters effective temperature , surface gravity , microturbulent velocity , and (projected) rotational velocity for the selected sub-sample of stars. The computed synthetic spectra were convolved with a rotational profile for the appropriate and with a Gaussian profile of a width matching the spectral resolution to account for instrumental broadening.
Comparisons with the observed spectra of the 31 sub-sample stars covered the diagnostic lines of H i, C ii, N ii, O ii, Mg ii, and Si iii/iv analysed by H09. In addition, we also verified the match of the He i/ii and C iii lines. The results of the visual inspection are summarised in Table 1, assigning three quality indicators depending on whether a good, reasonable, or no match was found for the individual ions. Detailed examples are discussed in the online Appendix B, with Figures 18 to 23 showing the comparison between models and observations for six prototype cases. A good match is indicated when the deviations between model and observation are small overall, typical for what can be expected from a thorough investigation (see, e.g., most of the panels in Fig. 18, or the examples shown by NP12). For a reasonable fit, some lines of an ion may be over-reproduced and some others under-reproduced, but an average over the abundances from a full analysis would come close to the input abundance (see, e.g., the C ii 4267 Å and 6578-82 Å lines in Fig. 22). No match is obtained when the modelled and observed spectral lines of an ion deviate significantly from each other, in particular, if the differences seem to be of a systematic nature (see, e.g., Fig. 23). The visual inspection of the observed spectra and the comparison with model spectra, furthermore, gave additional information on the nature of the re-investigated stars. Comments on this are summarised in the last column of Table 1. Essentially four object classes were identified: normal stars, Be stars, chemically peculiar objects, and double-lined spectra.
The following is learned from this comparison, with the relevant details discussed in Appendix B on the basis of six prototype examples. It is rather easy to obtain an excellent fit to some individual spectral lines, and to obtain even a good fit to large portions of the observations. However, this becomes insignificant if a single critical aspect is missed, like an indicator for the presence of a disc, abundance peculiarities of an important chemical species, or the (often subtle) signatures for the presence of light contribution from a second star, as discussed in the following.
Binaries.
Line asymmetries and unresolvable difficulties in a consistent modelling of the line spectra point towards a certain or potential contribution of second light to 13 sample stars (see Table 1). This is supported by findings, in particular for NGC 6611, reported in the literature recently. Several sample stars have been identified as visual binaries with separations 1″using adaptive optics (Duchêne et al. 2001), thus falling inside the FLAMES/MEDUSA fibre apertures of 1.2″. The objects NGC 6611-021, -025, and -066 show a magnitude difference between primary and secondary of 10, 53 and 37 in the -band. This second light contributes to the NGC 6611-021 spectrum (as confirmed by the observations), and possibly to the NGC 6611-066 spectrum (a changing line asymmetry is indicated, but the S/N is low). Several other targets in NGC 6611 were found to be radial velocity variables (Martayan et al. 2008), from medium-resolution spectroscopy employing FLAMES/GIRAFFE on the VLT (confirmed by us). As the secondaries of OB-type primaries are often OB-stars as well, a contribution of second light to the spectrum is highly likely, as confirmed by us in several cases (see Table 1). The number of multiple systems among the early B-star members, therefore, becomes comparable666The FLAMES Survey identified three out of 23 early B-stars as SB2 systems, i.e., a 13%-fraction of binaries in NGC 6611 (Evans et al. 2005). to the O-star binary fraction in NGC 6611 (44-67%, Sana et al. 2009).
| Hunter et al. (2009) | our assessment of the H09 work | |||||||||||||||||
|---|---|---|---|---|---|---|---|---|---|---|---|---|---|---|---|---|---|---|
| # | Object | H | He i | He ii | C ii | C iii | N ii | O ii | Mg ii | Si iii | Si iv | remark | ||||||
| K | (cgs) | km s-1 | km s-1 | |||||||||||||||
| 1 | NGC 6611-001 | 30300 | 3.70 | 10 | 142 | SB2a𝑎aa𝑎aSana et al. (2009), eclipsing binaryb𝑏bb𝑏bLefevre et al. (2009) | ||||||||||||
| 2 | NGC 6611-006 | 31250 | 4.00 | 8 | 20 | normal star | ||||||||||||
| 3 | NGC 6611-012 | 27200 | 3.90 | 5 | 95 | SB2 candidate (asymmetric line profiles) | ||||||||||||
| 4 | NGC 6611-020 | 27000 | 4.10 | 2 | 220 | – | SBc𝑐cc𝑐cMartayan et al. (2008), SB2 candidate (asymmetric line profiles) | |||||||||||
| 5 | NGC 6611-021 | 26250 | 4.25 | 0 | 30 | visual binaryd𝑑dd𝑑dDuchêne et al. (2001), double-lined spectrum | ||||||||||||
| 6 | NGC 6611-025 | 25000 | 4.10 | 0 | 95 | SB2 (changing asymmetry pattern), in addition: visual binaryd𝑑dd𝑑dDuchêne et al. (2001) | ||||||||||||
| 7 | NGC 6611-030 | 22500 | 4.15 | 1 | 10 | – | – | SBc𝑐cc𝑐cMartayan et al. (2008), SB1 (normal star) | ||||||||||
| 8 | NGC 6611-032 | 22500 | 4.15 | – | 70 | – | – | – | SBc𝑐cc𝑐cMartayan et al. (2008), SB2 candidate (asymmetric line profiles) | |||||||||
| 9 | NGC 6611-033 | 25600 | 4.00 | 4 | 30 | normal star | ||||||||||||
| 10 | NGC 6611-035 | 27000 | 4.10 | 2 | 120 | – | double-lined spectrum (asymmetric line profiles) | |||||||||||
| 11 | NGC 6611-042 | 22500 | 3.90 | 4 | 155 | – | – | double-lined spectrum (asymmetric line profiles) | ||||||||||
| 12 | NGC 6611-052 | 19200 | 3.85 | 8 | 120 | – | – | – | Be star | |||||||||
| 13 | NGC 6611-062 | 18400 | 4.05 | 7 | 165 | – | – | – | – | normal star | ||||||||
| 14 | NGC 6611-063 | 22500 | 4.00 | 2 | 95 | – | – | – | SBc𝑐cc𝑐cMartayan et al. (2008), normal star? (status unclear because of low S/N) | |||||||||
| 15 | NGC 6611-066 | 20800 | 4.20 | – | 80 | – | – | – | SB2? (changing asymmetry pattern, but low S/N), also: visual binaryd𝑑dd𝑑dDuchêne et al. (2001) | |||||||||
| 16 | NGC 3293-003 | 20500 | 2.75 | 13 | 80 | normal star, overall poor fit, notable macroturbulence | ||||||||||||
| 17 | NGC 3293-006 | 21500 | 3.15 | 15 | 200 | – | – | double-lined spectrum | ||||||||||
| 18 | NGC 3293-007 | 22600 | 3.10 | 11 | 65 | normal star, overall poor fit, notable macroturbulence | ||||||||||||
| 19 | NGC 3293-034 | 26100 | 4.25 | – | 35 | He-strong stare𝑒ee𝑒eEvans et al. (2005) | ||||||||||||
| 20 | NGC 4755-002 | 15950 | 2.20 | 18 | 70 | – | – | – | normal star, notable macroturbulence, no ionization equilibrium | |||||||||
| 21 | NGC 4755-003 | 17700 | 2.50 | 15 | 38 | – | double-lined spectrum, overall poor fit | |||||||||||
| 22 | NGC 4755-004 | 19550 | 2.60 | 17 | 75 | normal star, notable macroturbulence | ||||||||||||
| 23 | N11-008 | 25450 | 3.00 | 16 | 43 | double-lined spectrum, notable macroturbulence, overall poor fit | ||||||||||||
| 24 | N11-034 | 25500 | 3.25 | 12 | 203 | – | – | Be star | ||||||||||
| 25 | N11-039 | 21700 | 3.00 | 9 | 157 | – | – | – | Be star | |||||||||
| 26 | N11-072 | 28800 | 3.75 | 5 | 15 | double-lined spectrum | ||||||||||||
| 27 | N11-095 | 26800 | 3.85 | 2 | 267 | – | – | – | normal star | |||||||||
| 28 | NGC 2004-029 | 23100 | 3.50 | 1 | 30 | – | Be starf𝑓ff𝑓fEvans et al. (2006) | |||||||||||
| 29 | NGC 2004-053 | 31500 | 4.15 | 7 | 7 | Be starf𝑓ff𝑓fEvans et al. (2006) | ||||||||||||
| 30 | NGC 2004-090 | 32500 | 4.10 | – | 16 | normal star | ||||||||||||
| 31 | NGC 2004-100 | 26800 | 3.70 | 6 | 323 | – | – | – | – | Be star | ||||||||
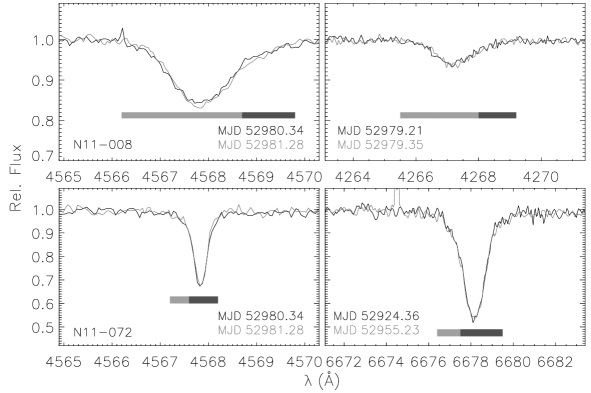
In general, the binary fraction of OB stars is high. A recent study by Chini et al. (2012) finds a SB2-fraction among early B-type stars of 50% in the mean, which may reach 70% for stars in a young cluster. Sana et al. (2012) find similar numbers for the binary fraction of Galactic O-stars, 699%, and a fraction of 50% for the LMC Tarantula nebula region (Sana et al. 2013). Therefore, one may expect additional binary stars also in the LMC and SMC clusters of the FLAMES Survey to be identified, where so far a binary fraction of 23 to 36% was found (Evans et al. 2006). Examples of rv-stable double-lined spectra of LMC stars are shown in Fig. 16. The lines are not clearly separated but tell-tale asymmetries reveal the true nature of the objects, which is immediately obvious for N11-008 and more subtle for N11-072.
Overall, spectra influenced by second light need to be excluded from the analysis to avoid bias. The reason is that second light changes, depending on the individual binary configuration, line depths relative to the continuum flux and/or line widths, and thus also equivalent widths. An analysis of a binary composite spectrum, assumed it to be single, results in erroneous stellar parameters and elemental abundances.
Be stars.
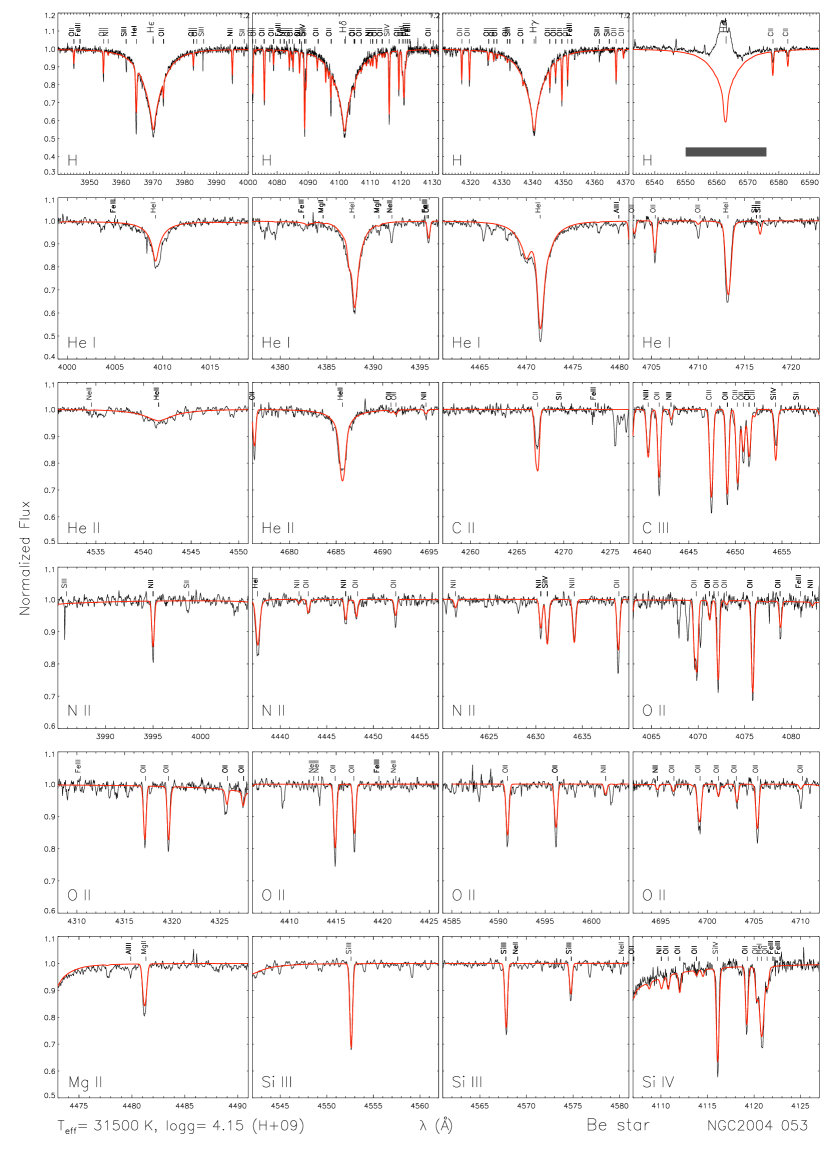
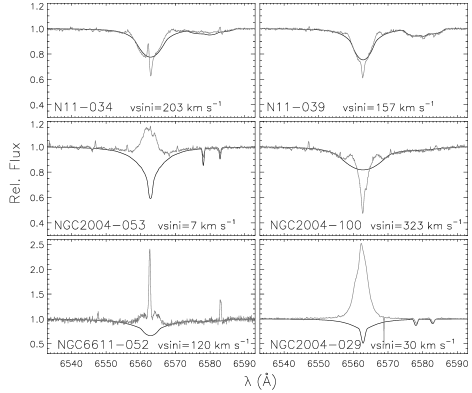
A closer inspection of the spectra from our sub-sample of 31 stars selected from the FLAMES Survey also reveals Be characteristics for six stars, see Table 1. When continuum and line emission from a disc overlaps with the stellar spectrum, this gives rise to a variety of spectral morphologies depending on disc parameters, disc size, and viewing angle on the stardisc system (see, e.g., Rivinius et al. 2013). Moreover, Be-stars rotate close to the breakup velocity, leading to a distortion from spherical geometry and non-uniform surface temperatures (hot poles and cool equator) and densities. Gravitational darkening leads to an under-estimation of rotational velocities (Townsend et al. 2004) and to changes in the equivalent widths of the spectral lines (Frémat et al. 2005). Because of these complications to the modelling, all identified Be stars were excluded from analysis within the FLAMES Survey to avoid systematical bias to stellar parameters and elemental abundances. However, some known Be stars (like NGC2004-029 and NGC2004-053, Evans et al. 2006) remained in the H09 sample for unknown reasons, and we identified several more, including the fastest rotator of the FLAMES Survey, NGC 2004-100. The H-profiles of these objects are shown in Fig. 17. Note that the weak emission in H line wings in the two objects in N11 may be inconspicuous to visual inspection, but clearly becomes apparent in the comparison with model predictions. It is not clear how many similar Be-stars may be present within the entire sample analysed by H09 without performing detailed investigations.
Chemical peculiarity.
Furthermore, we identified one He-strong B-star in the sample analysed by H09: NGC 3293-034 (see also Evans et al. 2005). The pronounced chemical peculiarity leads to a derivation of inappropriate stellar parameters and elemental abundances, if models with standard helium abundance are employed in the analysis.
Our re-assessment of a sub-sample of stars from the FLAMES Survey, as summarised in Table 1, shows that problems from a standard analysis of the observational data may be widespread. A part of the analysis results of H09 may therefore be subject to systematic bias of unknown extent. From the sub-sample of 31 stars re-investigated here only 11 seem suitable for a comparison of CNO values with theoretical predictions. When this is considered, all data points that are located off the nuclear path (as well as some matching ones) in Figs. 11 and 12 need to be dropped from interpretation (indicated by open symbols) and the scatter is reduced.
Consequently, the main conclusion from our re-assessment is that a careful and critical re-investigation of the FLAMES Survey data presented by H09 is clearly required. This may finally resolve the unusual characteristics of chemical abundances derived within the FLAMES Survey when compared to other studies of Galactic stars (Martins & Palacios 2013).
6 Conclusions
We provide some analytical properties of the N/C vs N/O diagram. For small enrichments (less than a factor of 4 in N/O), these properties essentially depend on nuclear physics and initial CNO ratios. There are only small deviations from a straight line in the N/C vs N/O diagram up to a value of N/O=0.6 at solar metallicity; for other compositions, this is the case up to an enrichment in N/O by a factor of at least 4. The N/C vs N/O diagram, therefore, provides an interesting quality test for observational results.
The models of rotating stars by Brott et al. (2011) and the models by Ekström et al. (2012) and Georgy et al. (2013a, b) show significant differences in their predictions. For low and moderate rotation velocities (up to 40% of the critical value), the Geneva models predict larger enrichments, while for faster rotations the models by Brott et al. (2011) predict larger enrichments.
Observed CNO abundances have often been used to derive conclusions on the physical processes at work in massive stars, such as the occurrence of rotational mixing, mixing by magnetic instabilities, tidal mixing, instabilities, etc. Clearly, the data from the VLT-FLAMES Survey provide evidences of mixing. However, the precision of the data makes analyses of fine effects difficult. Also, the accuracy of the data is insufficient to allow for a test of the significant differences between the models of rotating stars by Brott et al. (2011) and the Geneva models. We note that the existence of stars with high N/C values for low or moderate N/O may be a bit difficult to explain in all models, but these findings may not be real.
A careful detailed re-assessment of a sub-sample comprising 10% of the FLAMES Survey stars threw some light on sources of the above uncertainties. A double-lined character of many sample stars was found, as well as a chemical peculiarity or a Be-star nature for some stars. When the problematic cases are dropped from the interpretation, a much lower scatter of the observed data around the predicted nuclear path can be obtained.
We finally note that potentially, the N/C vs N/O plot offers a powerful way to discriminate the blue supergiants before the red supergiant stage from those after it, but first the test of recovering the basic predictions of the nuclear CNO cycle must be passed satisfactorily.
Acknowledgements.
Based on observations made with ESO Telescopes at the La Silla Paranal Observatory under programme IDs 171.D-0237 and 073.D-0234. We like to thank A. Irrgang for help with the FEROS data reduction and M.A. Urbaneja for providing us with test calculations employing Fastwind and Cmfgen. This research has made use of the SIMBAD database, operated at CDS, Strasbourg, France. MFN acknowledges financial support by the equal opportunities programme FFL of the University of Erlangen-Nuremberg.References
- Asplund et al. (2005) Asplund, M., Grevesse, N., & Sauval, A. J. 2005, in Cosmic Abundances as Records of Stellar Evolution and Nucleosynthesis, ed. T. G. Barnes, III & F. N. Bash (ASP, San Francisco), 25
- Asplund et al. (2009) Asplund, M., Grevesse, N., Sauval, A. J., & Scott, P. 2009, ARA&A, 47, 481
- Bouret et al. (2012) Bouret, J.-C., Hillier, D. J., Lanz, T., & Fullerton, A. W. 2012, A&A, 544, A67
- Bresolin et al. (2008) Bresolin, F., Crowther, P. A., & Puls, J., eds. 2008, IAU Symposium, Vol. 250, Massive Stars as Cosmic Engines
- Bromm & Larson (2004) Bromm, V. & Larson, R. B. 2004, ARA&A, 42, 79
- Brott et al. (2011) Brott, I., de Mink, S. E., Cantiello, M., et al. 2011, A&A, 530, A115
- Butler & Giddings (1985) Butler, K. & Giddings, J. R. 1985, in: Newsletter on Analysis of Astronomical Spectra No. 9 (Univ. London)
- Chini et al. (2012) Chini, R., Hoffmeister, V. H., Nasseri, A., Stahl, O., & Zinnecker, H. 2012, MNRAS, 424, 1925
- Chiosi & Maeder (1986) Chiosi, C. & Maeder, A. 1986, ARA&A, 24, 329
- De Marchi et al. (2011) De Marchi, G., Panagia, N., Romaniello, M., et al. 2011, ApJ, 740, 11
- Duchêne et al. (2001) Duchêne, G., Simon, T., Eislöffel, J., & Bouvier, J. 2001, A&A, 379, 147
- Ekström et al. (2012) Ekström, S., Georgy, C., Eggenberger, P., et al. 2012, A&A, 537, A146
- Evans et al. (2006) Evans, C. J., Lennon, D. J., Smartt, S. J., & Trundle, C. 2006, A&A, 456, 623
- Evans et al. (2005) Evans, C. J., Smartt, S. J., Lee, J.-K., et al. 2005, A&A, 437, 467
- Firnstein & Przybilla (2012) Firnstein, M. & Przybilla, N. 2012, A&A, 543, A80
- Frémat et al. (2005) Frémat, Y., Zorec, J., Hubert, A.-M., & Floquet, M. 2005, A&A, 440, 305
- Garnett (1999) Garnett, D. R. 1999, in New Views of the Magellanic Clouds, ed. Y.-H. Chu, N. Suntzeff, J. Hesser, & D. Bohlender (ASP, San Francisco), 266
- Georgy et al. (2013a) Georgy, C., Ekström, S., Eggenberger, P., et al. 2013a, A&A, 558, A103
- Georgy et al. (2013b) Georgy, C., Ekström, S., Granada, A., et al. 2013b, A&A, 553, A24
- Giddings (1981) Giddings, J. R. 1981, Ph.D. Thesis (Univ. London)
- Heger & Langer (2000) Heger, A. & Langer, N. 2000, ApJ, 544, 1016
- Heger et al. (2005) Heger, A., Woosley, S. E., & Spruit, H. C. 2005, ApJ, 626, 350
- Hillier & Miller (1998) Hillier, D. J. & Miller, D. L. 1998, ApJ, 496, 407
- Hunter et al. (2009) Hunter, I., Brott, I., Langer, N., et al. 2009, A&A, 496, 841 (H09)
- Hunter et al. (2008) Hunter, I., Brott, I., Lennon, D. J., et al. 2008, ApJ, 676, L29
- Korn et al. (2002) Korn, A. J., Keller, S. C., Kaufer, A., et al. 2002, A&A, 385, 143
- Korn et al. (2005) Korn, A. J., Nieva, M. F., Daflon, S., & Cunha, K. 2005, ApJ, 633, 899
- Kurucz (1993) Kurucz, R. L. 1993, CD-ROM No. 2–12 (SAO, Cambridge, MA), 13
- Langer (2012) Langer, N. 2012, ARA&A, 50, 107
- Lefevre et al. (2009) Lefevre, L., Marchenko, S. V., Moffat, A. F. J., & Acker, A. 2009, A&A, 507, 1141
- Maeder (2009) Maeder, A. 2009, Physics, Formation and Evolution of Rotating Stars (Springer, Berlin)
- Maeder & Conti (1994) Maeder, A. & Conti, P. S. 1994, ARA&A, 32, 227
- Maeder et al. (1999) Maeder, A., Grebel, E. K., & Mermilliod, J.-C. 1999, A&A, 346, 459
- Maeder & Meynet (2000) Maeder, A. & Meynet, G. 2000, ARA&A, 38, 143
- Maeder & Meynet (2001) Maeder, A. & Meynet, G. 2001, A&A, 373, 555
- Maeder & Meynet (2005) Maeder, A. & Meynet, G. 2005, A&A, 440, 1041
- Maeder & Meynet (2012) Maeder, A. & Meynet, G. 2012, Reviews of Modern Physics, 84, 25
- Maeder et al. (2009) Maeder, A., Meynet, G., Ekström, S., & Georgy, C. 2009, Communications in Asteroseismology, 158, 72
- Martayan et al. (2008) Martayan, C., Floquet, M., Hubert, A. M., et al. 2008, A&A, 489, 459
- Martins et al. (2008) Martins, F., Hillier, D. J., Paumard, T., et al. 2008, A&A, 478, 219
- Martins & Palacios (2013) Martins, F. & Palacios, A. 2013, A&A, 560, A16
- Meynet et al. (2011) Meynet, G., Eggenberger, P., & Maeder, A. 2011, A&A, 525, L11
- Meynet & Maeder (2000) Meynet, G. & Maeder, A. 2000, A&A, 361, 101
- Meynet & Maeder (2005) Meynet, G. & Maeder, A. 2005, A&A, 429, 581
- Morel et al. (2006) Morel, T., Butler, K., Aerts, C., Neiner, C., & Briquet, M. 2006, A&A, 457, 651
- Nieva & Przybilla (2007) Nieva, M. F. & Przybilla, N. 2007, A&A, 467, 295
- Nieva & Przybilla (2008) Nieva, M. F. & Przybilla, N. 2008, A&A, 481, 199
- Nieva & Przybilla (2012) Nieva, M. F. & Przybilla, N. 2012, A&A, 539, A143
- Nieva & Simón-Díaz (2011) Nieva, M. F. & Simón-Díaz, S. 2011, A&A, 532, A2
- Przybilla et al. (2010) Przybilla, N., Firnstein, M., Nieva, M. F., Meynet, G., & Maeder, A. 2010, A&A, 517, A38
- Przybilla et al. (2008) Przybilla, N., Nieva, M.-F., & Butler, K. 2008, ApJ, 688, L103
- Przybilla et al. (2011) Przybilla, N., Nieva, M. F., & Butler, K. 2011, J. Phys.: Conf. Ser., 328, 012015
- Rivero González et al. (2012) Rivero González, J. G., Puls, J., Najarro, F., & Brott, I. 2012, A&A, 537, A79
- Rivinius et al. (2013) Rivinius, T., Carciofi, A. C., & Martayan, C. 2013, A&A Rev., 21, 69
- Rolleston et al. (2003) Rolleston, W. R. J., Venn, K., Tolstoy, E., & Dufton, P. L. 2003, A&A, 400, 21
- Sana et al. (2013) Sana, H., de Koter, A., de Mink, S. E., et al. 2013, A&A, 550, A107
- Sana et al. (2012) Sana, H., de Mink, S. E., de Koter, A., et al. 2012, Science, 337, 444
- Sana et al. (2009) Sana, H., Gosset, E., & Evans, C. J. 2009, MNRAS, 400, 1479
- Townsend et al. (2004) Townsend, R. H. D., Owocki, S. P., & Howarth, I. D. 2004, MNRAS, 350, 189
- Vanbeveren et al. (1998) Vanbeveren, D., De Loore, C., & Van Rensbergen, W. 1998, A&A Rev., 9, 63
- Wellstein et al. (2001) Wellstein, S., Langer, N., & Braun, H. 2001, A&A, 369, 939
- Woosley & Heger (2012) Woosley, S. E. & Heger, A. 2012, ApJ, 752, 32
Appendix A Observational data and modelling
We intend to work as closely as possible with the observational data of the FLAMES Survey, aiming to avoid bias from differences in the data reduction. As a test, raw data for all FLAMES Survey targets observed with the Fiber-fed Extended Range Optical Spectrograph (FEROS) at the 2.2m telescope at ESO (La Silla, Chile) were retrieved from the ESO archive and reduced using the FEROS pipeline and our additional recipes for continuum normalisation (see, e.g., Nieva & Przybilla 2007). These were compared with the published FLAMES Survey spectra, downloaded from the project webpage888http://star.pst.qub.ac.uk, see Evans et al. (2005, 2006) for details on the observations made within the FLAMES Survey and the data reduction.. Good agreement of the two data reductions was found, such that the FLAMES Survey spectra were employed, except for the H region, which was missing in the published data.
The sky-corrected single exposures of the individual FLAMES orders as well as the fully-reduced spectra were also downloaded from the project webpage. Multiple exposures of an object were cross-correlated to identify radial-velocity (rv) variables. In the case of rv variables, the single exposures per order were rv-corrected to laboratory rest frame, normalised and coadded (with weighing factors according to S/N), and then the orders merged. In the case of no rv-variation the fully-reduced spectra from the project webpage were employed.
Our atmospheric modelling and spectrum synthesis calculations for early B-type stars on the MS have been discussed in detail by Nieva & Przybilla (2008, 2012). In brief, based on prescribed LTE model atmospheres (Atlas9, Kurucz 1993) non-LTE line-formation calculations were performed using the codes Detail and Surface (Giddings 1981; Butler & Giddings 1985, both updated by K. Butler), abbreviated by Ads henceforth. Such plane-parallel and hydrostatic hybrid non-LTE models have been shown to be equivalent to either plane-parallel and hydrostatic full non-LTE line-blanketed model atmospheres (Nieva & Przybilla 2007; Przybilla et al. 2011), such as applied within the FLAMES Survey, or spherical and hydrodynamic full non-LTE line-blanketed model atmospheres (Nieva & Simón-Díaz 2011) on the MS.
Appendix B Test case examples
We discuss six prototype examples representative of the four object classes identified in our investigations in Sect. 5 in the following. These comprise normal stars (on the MS and beyond), double-lined objects (SB2 candidates, visual or apparent binaries), Be stars, and a chemically peculiar object. The focus of the discussion, based on Figs. 18 to 23, is on the quality of the match of the synthetic with the observed spectra, in particular, with regard to the stellar parameter indicators – the H and He lines, and metal ionisation equilibria. The individual panels of the figures are centred on the diverse diagnostic lines from different chemical species, sorted according to increasing atomic weight, and within one element by increasing ionisation degree and wavelength. Note that several – mostly weaker – metal lines are not implemented in the models, with the intention to reproduce only the FLAMES Survey results. For the assessment of the entire sub-sample of 31 stars drawn from the H09 work see Table 1.
- NGC 6611-006.
-
Figure 18 shows an example for one of the best matches between theory and observation found within our re-investigation of the sub-sample of stars drawn from the H09 work, for a single, normal star. Good agreement is found for the hydrogen line profiles, except for the narrow central H emission that is of nebular origin. A good match is also obtained for the He i and most metal lines, while a reasonable match is found for the He ii and C iii lines, and for Si iv 4654 Å (not considered by H09). Only C ii 4267 Å and C ii 6578/82 Å in the H wing do not fit, with the predicted lines being too strong by a factor of 2 and a factor of several, respectively. The ionisation balance of C ii/iii is thus not established, suggesting that an overall improved fit could be achieved by a revision of the atmospheric parameters (requiring also an adjustment of chemical abundances).
- NGC 2004-053.
-
This star is apparently the slowest rotator and yet one of the most nitrogen-rich stars in the LMC sample, making it a role-model for one of the star classes that cannot be explained on the basis of rotational mixing alone (H09). The broad central and symmetric H emission in Fig. 19 identifies the object as a Be star seen pole-on (feature apparently overlooked by H09, but correctly identified by Evans et al. 2006). Despite the sharp-lined character of the spectrum, this is, in fact, a fast-rotating star. The spectrum is dominated by light from the hot stellar pole, and smaller contributions from the gravity-darkened stellar equator regions (further diminished because of limb darkening) and the disc. The question is to which extent the non-uniform surface temperature and density, and the emission from the disc affect the continuum and line spectra. Despite the overall rather good match of model spectrum and observations (again except for C ii 4267 Å and C ii 6578/82 Å, and a consistent failure to reproduce the depths of most metal lines) it is at present not possible to judge how realistic the derived parameters and abundances really are. Because of this potential systematic bias they should be treated with caution in any further interpretation. For the moment, the star should be excluded from further interpretation, like other Be-stars (see Sect. 5). However, on observational grounds alone a true nature as a nitrogen-rich fast rotator is indicated.
- NGC 3293-034.
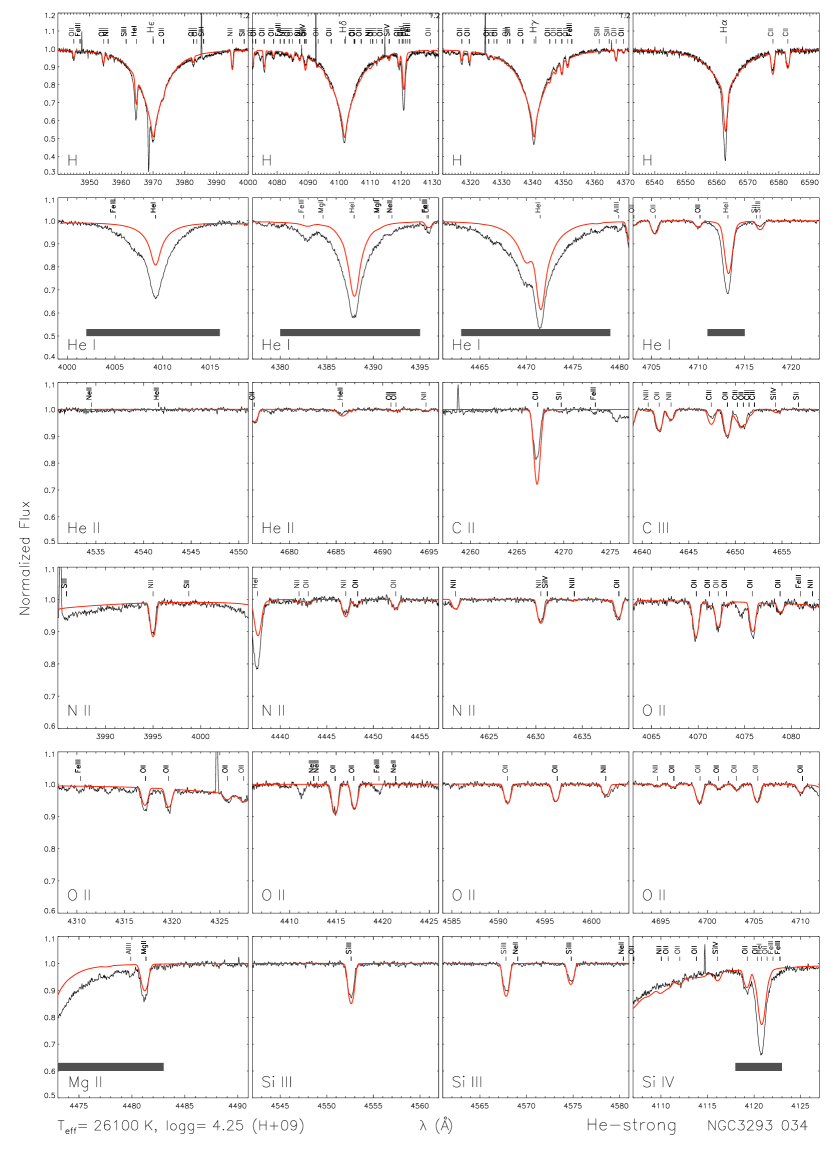
-
Despite being a good match for Balmer lines, He ii 4686 Å and many metal lines (Fig. 20) the stellar parameters and abundances derived by H09 are not adequate. The reason for this is the mismatch of model and observation for the He i lines. These indicate that NGC 3293-034 is a He-strong star (as identified by Evans et al. 2005). Note also that none of the available ionisation equilibria (He i/ii, C ii/iii, Si iii/iv) is matched in a satisfactory way. The higher molecular weight and lower opacity of He (with respect to H) in combination with a pronounced overabundance of the element change the atmospheric temperature and density structure, which requires dedicated model calculations for proper consideration beyond the pre-computed grids employed within the FLAMES Survey. In consequence, this star has to be excluded from further interpretation to avoid biased conclusions.
- NGC 6611-001.
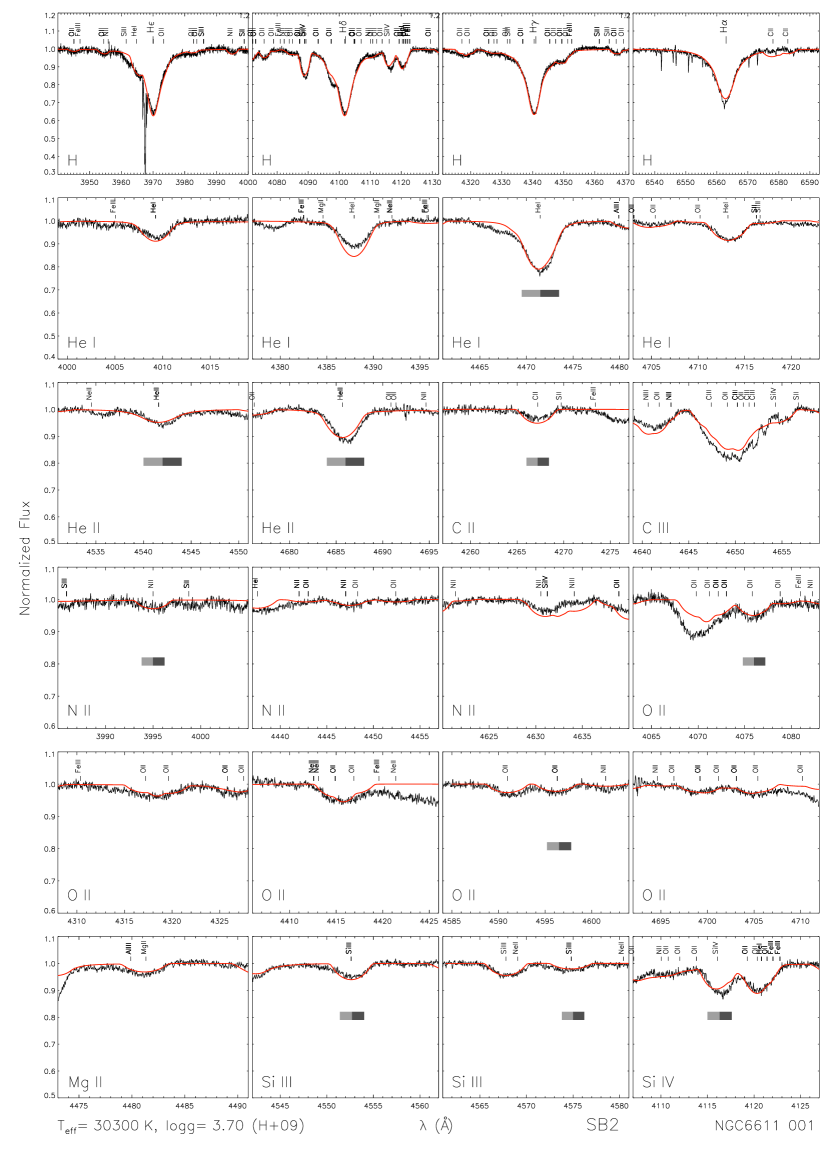
-
The spectrum synthesis provides an overall good match to the observed spectrum, see Fig. 21, except for some He i/ii lines and the unsatisfactory fit of the C iii-dominated complex around 4650 Å. However, close inspection of isolated strong metal features like C ii 4267 Å, O ii 4076 Å, or Si iii 4552, 4574 Å reveals line-profile asymmetries. Such asymmetries become apparent in particular in visual inspection when using line-profile fitting techniques, but are easily overlooked when employing an equivalent-width approach (like by H09) for the quantitative analysis. Line-profile asymmetries are indicators for a possible SB2 nature of the star, but require confirmation by time-series spectroscopy. Indeed, Sana et al. (2009) can clearly resolve double lines for NGC 6611-001 for some epochs in their spectra (note that the star is also known to be an eclipsing binary, Lefevre et al. 2009). Consequently, the spectrum, while dominated by the light of the primary, is compromised by second light, and the analysis is therefore biased. To avoid misleading conclusions, the star has to be excluded from further interpretation.
- NGC 3293-007.
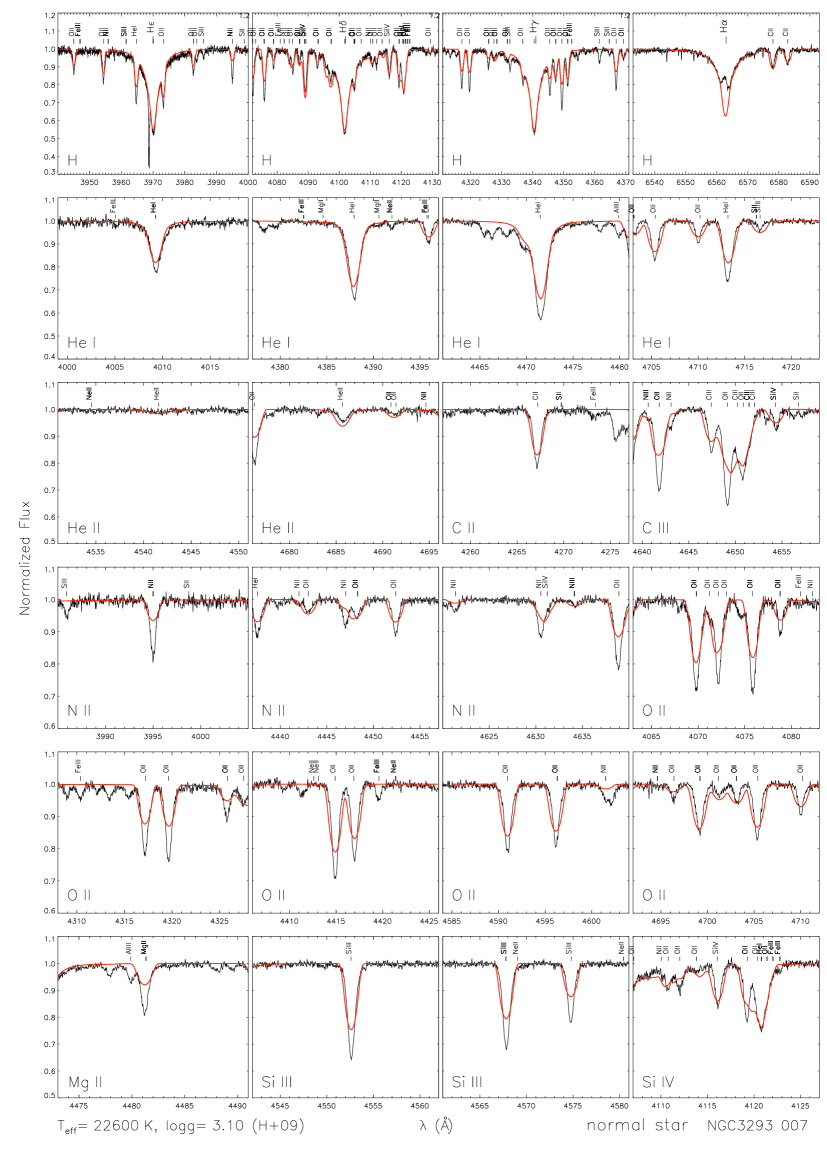
-
This is an example of an object evolved off the MS, identified as nitrogen-poor by H09. The comparison of observed and model spectra in Fig. 22 shows an overall poor match, with the model largely under-predicting the depths of nearly all lines. In particular, the synthetic N ii lines are too weak by a factor 2-3 in equivalent width, indicating that the finding of nitrogen-poorness is spurious. Moreover, the ionisation equilibria do not match, indicating poorly constrained stellar parameters and therefore, erroneous abundances in general. An independent comparison with non-LTE line-blanketed hydrodynamic models computed with Fastwind and Cmfgen (Hillier & Miller 1998) by M. Urbaneja (priv. comm.) confirms a poor match of observation and models for the published parameters and abundances of H09. This is in line with the findings of Martins & Palacios (2013) that the abundances for Galactic OB stars determined by H09, on the one hand, and those determined by other codes differ (Martins et al. 2008; Przybilla et al. 2010; Nieva & Simón-Díaz 2011; Firnstein & Przybilla 2012; Nieva & Przybilla 2012; Bouret et al. 2012, despite some minor differences that also exist between the Ads, Fastwind, and Cmfgen models). A higher by 3000 to 4000 K would seem more appropriate. The object should be excluded from further interpretation.
- NGC 4755-003.
-
This is an example of an evolved nitrogen-rich star of H09. As in the case of the previous example, the match between observation and model is overall poor, see Fig. 23. This time, the model over-predicts the depths of almost all lines, including the N ii features. Again, poorly constrained stellar parameters seem to be a major factor for the mismatch. The object should be excluded from further interpretation. A second reason for exclusion is found from closer inspection of the profiles of the stronger lines. They show the presence of a second absorption component in the red wings – this object is double-lined. It appears that the second object is of similar spectral type but less luminous, probably a main-sequence star.