Warm absorbers in X-rays (WAX), a comprehensive high resolution grating spectral study of a sample of Seyfert galaxies:
I. A global view and frequency of occurrence of warm absorbers.
Abstract
We present results from a homogeneous analysis of the broadband CCD resolution as well as of soft X-ray high-resolution grating spectra of a hard X-ray flux-limited sample of 26 Seyfert galaxies observed with XMM-Newton. Our goal is to characterise warm absorbers (WAs) along the line-of-sight to the active nucleus. We significantly detect WAs in of the sample sources. Our results are consistent with WAs being present in at least half of the Seyfert galaxies in the nearby Universe, in agreement with previous estimates . We find a gap in the distribution of the ionisation parameter in the range which we interpret as a thermally unstable region for WA clouds. This may indicate that the warm absorber flow is probably constituted by a clumpy distribution of discrete clouds rather than a continuous medium. The distribution of the WA column densities for the sources with broad Fe K lines are similar to those sources which do not have broadened emission lines. Therefore the detected broad Fe K emission lines are bonafide and not artifacts of ionised absorption in the soft X-rays. The WA parameters show no correlation among themselves, with the exception of the ionisation parameter versus column density. The shallow slope of the versus linear regression () is inconsistent with the scaling laws predicted by radiation or magneto-hydrodynamic-driven winds. Our results suggest also that WA and Ultra Fast Outflows (UFOs) do not represent extreme manifestation of the same astrophysical system.
keywords:
(galaxies:) quasars: absorption lines,(galaxies:) quasars: emission lines, (galaxies:) quasars: general, galaxies: active, galaxies: Seyfert, X-rays: galaxies, Resolved and unresolved sources as a function of wavelength.1 Introduction
The X-ray and -ray emission of an active galaxy mostly originate from the innermost regions of the central engine, known as the Active Galactic Nuclei (AGN). It is commonly believed that the AGN is powered by accretion of plasma onto a super-massive black hole. The X-ray emission spectrum of radio quiet (RQ) AGN can be well approximated by a power-law with a photon index in the range of , suggesting Comptonisation as the main underlying physical process (Haardt & Maraschi, 1991; Titarchuk, 1994). Superposed on this continuum, several spectral components have been discovered along the history of X-ray astronomy. Most of these are believed to be due to reprocessing by an optically thick and geometrically thin accretion disk (George & Fabian, 1991). Spectral distortions, most notably observed in the profile of emission lines such as the iron K, suggest that the bulk of the X-ray emission comes from a region just a few gravitational radii from the black hole’s event horizon (for e.g., see the review by Turner & Miller, 2009, for a different interpretative scenario). Extrapolating this non-thermal component to energies lower than 1 keV unveils a “soft X-ray excess”. The physical origin of this component has so far proven elusive (see e.g., Gierliński & Done, 2004; Porquet et al., 2004; Crummy et al., 2006; Piconcelli et al., 2005; Schurch & Done, 2006; Dewangan et al., 2007). Redwards of the soft X-rays lie the unobservable region of the AGN spectra. The energy range of is obscured from us due to the Galactic extinction. Below the big blue bump (BBB) is the most important and dominant spectral feature. It typically spans the energy range from - or and is a major contributor to the AGN bolometric luminosity (Calderone et al., 2013; Vasudevan & Fabian, 2007; Elvis et al., 1994; Sanders et al., 1989). The most commonly accepted origin of the BBB is the multi-colored blackbody emission from a geometrically thin and optically thick accretion disk (Shakura & Sunyaev, 1973).
The spectra of many AGN are affected by obscuration by partially ionised material along our line of sight and intrinsic to the source, first detected by Halpern (1984) using Einstein data. Such X-ray absorbing clouds have been named warm absorbers (WA). These warm absorbers imprint their signatures on the X-ray spectrum as narrow absorption lines and edges, from elements at a wide range of ionisation stages (see e.g., Kaastra et al., 2000; Kaspi et al., 2000; Blustin et al., 2005). The high resolution grating X-ray spectra from the XMM-Newton and Chandra observatories have profoundly improved our understanding of these discrete absorption and emission features.
Absorption lines and photo-absorption edges are sensitive diagnostics of the ionisation structure and kinematics of the gas. The measured blue-shift of the absorption lines with respect to the systemic velocity implies that these absorbers are outflowing with moderate velocities in the range of . In some AGNs, high velocity () outflows have also been detected (e.g., Reeves et al., 2003; Dadina & Cappi, 2004; Dasgupta et al., 2005; Braito et al., 2007). The resulting mass outflow rate can be a substantial fraction of the accretion rate required to power the AGN. Thus, warm absorbers can be dynamically important and the knowledge of their state, location, geometry and dynamics would help in understanding the central engines of AGN (Mathur et al., 1995).
1.1 Previous studies of warm-absorbed AGN samples
Spectroscopic measurements of AGN with the X-ray CCD detectors onboard ASCA allowed the first systematic studies of sizable samples of warm absorbed AGN. Reynolds (1997) presented a study of X-ray spectral properties along with warm absorber properties for a sample of 24 type 1 AGN, using the medium resolution ASCA data. Almost half of the objects in this sample show K-shell absorption edges of O vii and O viii, and were interpreted as signatures of warm absorbers. Reynolds found a trend for less ionised absorption to be present in more luminous objects. A similar fraction of warm absorbed sources was found in a sample of 18 Seyfert 1–1.5 galaxies observed by ASCA (George et al., 1998), as well as in a sample of 40 Palomar-Green Quasi Stellar objects (QSOs) observed by the XMM-Newton EPIC CCD cameras (Piconcelli et al., 2005).
Blustin et al. (2005) compiled the results of previous studies of a number of Seyfert galaxies observed with the RGS (Reflection Grating Spectrometer) onboard XMM-Newton. They suggested that warm absorbers in nearby Seyfert galaxies and QSOs originate in outflows from the dusty torus. The kinetic luminosity of these outflows accounts for well under of the bolometric luminosities of AGN. The authors showed that the amount of matter processed through an AGN outflow system, averaged over the lifetime of the AGN, is probably large enough to have a significant influence on the evolution of the host galaxy. McKernan et al. (2007) analysed a sample of 15 type 1 sources using the high resolution Chandra grating data. Ten out of the 15 sources show signatures due to intrinsic absorption from H- or He-like Oxygen, with nine out of the ten sources requiring multiple ionisation components. The ionisation parameter of the warm absorbing gas spanned almost four orders of magnitude (), and the column density 3 orders of magnitude (). These authors found an apparent gap in the distribution of outflow velocities between , whose origin was unclear. Winter et al. (2012) studied a sample of 48 Seyfert 1-1.5 galaxies in the X-rays and hard X-rays using the Suzaku and XMM-Newton telescopes. The sources were detected in the hard X-rays using the Swift Burst alert telescope (BAT) in the band. They detected significantly O vii and O viii edges in of their sample. The ionised column densities of sources with O vii and O viii detections cluster in a narrow range around , while sources without strong detection have column densities an order of magnitude lower. Taking into account the inhomogeneous coverage of their sample in the soft X-ray band, they conclude that up to of nearby AGN could host warm absorbers.
Tombesi et al. (2010) (hereafter T10) have carried out an extensive sample study of ultra fast outflows (UFOs), which are highly ionised outflowing clouds of gas with velocities a fraction () of the speed of light. Their signatures in the spectra are in the form of narrow absorption lines in the energy range . The authors conclude that these outflowing clouds are present in about of Seyfert galaxies in the nearby universe. Tombesi et al. (2013) (hereafter T13) carried out a detailed comparison between the UFOs and the WAs and conclude that possibly both the types of ionised outflows belong to a single extended stratified ouflow. They also suggest that the UFOs may be launched from the innermost parts of the accretion disk.
1.2 Motivation of our study
Our study aims at characterising the properties of warm absorbing gas in a well defined, flux-limited sample of nearby AGN. At variance with most of the studies discussed in Sect. 1.1, we apply a homogeneous data reduction and analysis procedure on all the sources in our sample, use simultaneous UV and X-ray measurements to obtain the Spectral Energy Distribution (SED) of each object, employ state-of-the-art photoionisation codes to model the spectra of the warm absorbing gas, and fit simultaneously CCD spectra in the broad 0.3–10 keV energy band and high-resolution grating spectra in the 0.4–2 keV energy band to achieve a self-consistent astrophysical description of the spectra. We made use of data obtained with the XMM-Newton satellite (Jansen et al., 2001). For each source we could combine the large collecting area of the XMM-Newton optics, the high quantum efficiency of the EPIC-pn (Strüder et al., 2001), the high resolution RGS (Den Herder et al., 2001) detectors, and the simultaneous optical photometry obtained with the Optical Monitor (Mason et al., 2001). This broadband coverage allowed us to self-consistently calculate the SED of each object at the same time as the warm absorber was studied. The WAX-AGN (warm absorbers in X-ray AGN, WAX hereafter) project aims at addressing the following important questions:
-
1.
How fundamental are ionised outflows in AGN?
-
2.
What are the distribution of warm absorber properties (column density, ionisation parameter, outflow velocity, launching radius) in the parent population of nearby Seyfert galaxies ?
-
3.
What is the outflow acceleration mechanism?
-
4.
Do ionised outflows play an important role on the host galaxy chemical history and evolution?
The first two questions are specifically addressed in this paper.
The paper is organised as follows: Section 2 deals with the sample selection. Section 3 describes the data reprocessing and spectral extraction which involves the data from all the three types of instruments aboard XMM-Newton. Sections 4, 5 and 6 describe the spectral analysis. Sections. 7 and 8 discusses the results, which is followed by summary and conclusion.
2 The Sample selection
The WAX sample was selected as a sub-sample of the CAIXA (Catalogue of AGN In XMM Archive) sample (Bianchi et al., 2009). CAIXA consists of all radio quiet X-ray unobscured () AGN observed by XMM-Newton at the boresight, whose data were public as of March 2007, and have at least 200 background-subtracted counts in the 0.3–2 keV, as well as in the 2–10 keV energy band. Sources, whose EPIC-pn spectra were affected by pile-up larger than were not included in CAIXA. To ensure that only radio quiet objects were included in the CAIXA catalogue, Bianchi et al. (2009) collected radio data at cm ( GHz) and 20 cm (1.4 GHz) from the literature and calculated the K-corrected radio-loudness parameter (Panessa et al., 2007). All quasars with log were excluded. For the Seyferts, however, known to be on an average “radio louder”, log was used as the boundary. At the end of the selection procedure CAIXA consists of 156 radio-quiet AGN.
We cross-correlated the CAIXA sources with the RXTE X-ray Sky Survey (XSS: Revnivtsev et al., 2004), and retained only those sources with an XSS count rate 1 s-1. The hard X-ray selection avoids biases against sources whose spectrum is affected by strong opacity in the soft X-ray band (which is the most interesting band for the purposes of any warm absorber studies). This cross-correlation yielded a hard X-ray flux-limited sample of 34 sources. From this parent flux-limited sample we additionally removed three sources (NGC 7314, MCG-5-23-16, and NGC 526A) because their spectra exhibit column density of cold (neutral) photoabsorbing gas 5 cm-2 . Such a column density substantially affects the signal-to-noise ratio in the soft X-ray energy band, where features due to warm absorbers are expected to be the most prominent. The XMM-Newton observations of four other sources in the remaining sample of 31 sources (5C3.100, H1846-786, RXJ1424.9+4214, E1346+266) were affected by high particle background, making the signal-to-noise ratio in the RGS spectra too poor for the sake of our study. Furthermore, H0557-385 was in a very low flux state during most of the XMM-Newton observations. Only one of the XMM-Newton observations caught this target at a flux level high enough to potentially warrant a good SNR in the soft X-ray band (Longinotti et al., 2009). However, its exposure time is too short and hence the SNR of its RGS spectrum is again too poor. The final sample of 26 sources with their XMM-Newton EPIC-pn and RGS spectra will be referred to as the “WAX sample” throughout this work. The WAX sample is therefore complete with respect to RXTE/XSS sources with a count rate count , and at least complete with respect to the sub-sample of X-ray unobscured AGN. When multiple observations of the same source are available, we selected only the longest exposure data for our analysis to avoid any bias related to the flux and/or spectral state of the source.
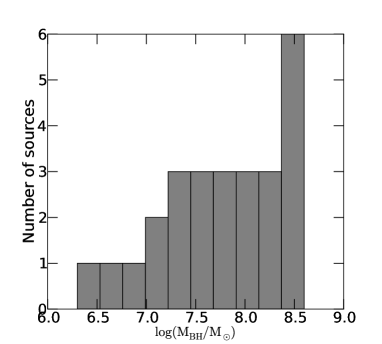
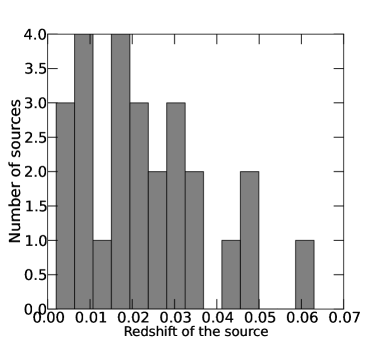
The WAX sample consists of a total of 26 sources of which nine Seyfert 1 or Broad Line Seyferts, five are Seyfert 1.2, 11 are Seyfert 1.5, and one is LINER (the classification is according to the NASA Extragalactic Database, NED). All the sources are in the local universe with a maximum redshift of and a median redshift of (see Fig. 1). The blackhole masses range from (see Fig. 1). The average RGS exposure time is ks. Readers are referred to Tables 1 and 2 for a list of the main properties of the sources in the WAX sample.
3 Data reprocessing, filtering and spectral extraction
All sources in the WAX sample were simultaneously observed by all the instruments on-board XMM-Newton. For broad band spectral analysis we used only the EPIC-pn data as its signal to noise ratio (SNR) is higher compared to the EPIC-MOS cameras (Turner et al., 2001). The details of the observation done using the XMM-Newton satellite are given in Table 2. We used SASv11 for data reprocessing and spectral extraction, using the most update calibration files at the time the data were reduced (2011).
Calibrated and concatenated event lists for the EPIC-pn camera were generated using the SAS task epchain. We extracted full field-of-view, single event light curves at energies keV to estimate the level of particle background during each observation. Good Time Intervals (GTI) for the accumulation of scientific products were defined as those corresponding to a count rate 1 counts s-1 above . Spectra were accumulated using single events only, because they have the best spectral resolution. Single events constitute the bulk of the events at energies lower than . The source spectra were extracted from circular regions of 45 arc-seconds radius centred on the source X-ray centroid, while the background spectra were extracted from appropriate nearby circular regions on the same CCD free of serendipitous contaminating sources. We created the ancillary response file (ARF) and the redistribution matrix file (RMF) using the SAS tasks arfgen and rmfgen. The EPIC-pn spectral data were grouped with a minimum of 20 counts per energy bin and at most 5 energy bins per resolution element, using the specgroup command in the SAS. We used ISIS version 1.6.2-12 (Houck & Denicola, 2000) for our spectral fitting. We performed spectral fits on the EPIC-pn spectra using the energy band, where the instrument is well calibrated.
The RGS data were reprocessed using the SAS task rgsproc assuming the source optical coordinates as reference for the calculation of the position-dependent wavelength scale. We filtered particle background using background light curves extracted from CCD9, which is most sensitive to proton events, and where the effective area to X-ray photons is the lowest. All intervals with a background count rate were selected, to maximise the SNR.
We reprocessed the OM data using the SAS task omichain. The OM camera simultaneously observed the sources along with EPIC and RGS cameras. We considered fluxes measured by any one of the following filters: UVW1 (), UVM2 (), or UVW2 (). These UV energy bands () lie in the region of our interest where the AGN “Big-Blue-Bump” (BBB) peaks. Observed UV fluxes were corrected for the Galactic reddening assuming Fitzpatrick (1999) redenning law with (see Table 3).
We checked for the spectral variability in the WAX sources, and found that the 2–10 keV versus 0.3–2 keV hardness ratio of 10 sources varied during the observation. In a future paper, we will carry out time resolved spectroscopy of those sources. In this paper we instead focus on the properties of their time-averaged spectra. All errors quoted on the fitted parameters reflect the confidence interval for one interesting parameter corresponding to (Lampton et al., 1976). Throughout this paper, we consider the ‘best-fit’ as that corresponding to the global minimum of the surface in the given energy band with the given set of models.
4 X-ray spectral analysis: Medium resolution
The X-ray emission from AGN is very complex with a number of physical phenomena contributing to the emitted flux and in most cases overlapping with each other in the energy space (see Risaliti & Elvis, 2004, for a review). A typical Seyfert spectrum in the band can be fit with a combination of the following components: a powerlaw, most likely due to unsaturated thermal Comptonization of accretion disk photons in a hot corona (Rybicki & Lightman, 1979; Haardt & Maraschi, 1991), a soft-excess (SE), neutral Compton-reflection continuum, fluorescent and recombination iron emission lines, and warm absorption and emission in the soft X-rays, along with Galactic and intrinsic neutral absorption. Emission lines can be “narrow” (unresolved at the resolution of the detectors) or “broad”, in the latter case due to either Keplerian motions in the torus or broad line regions clouds (Yaqoob & Padmanabhan, 2004; Nandra et al., 2006) or by a combination of special and general relativistic effects if the lines are emitted in the innermost regions of a X-ray illuminated accretion disk (Fabian et al., 1989; Matt et al., 1991). We fit the EPIC-pn spectra with an astrophysically-motivated combination of spectral components. For all the sources we follow a common procedure for modeling the broad band spectra as enumerated below.
We start with the EPIC-pn data as this part of the continuum is not affected by the SE. We fit the data with a powerlaw absorbed by Galactic and intrinsic neutral columns and narrow/broad Gaussian lines to describe the Fe K and Fe K emission. In many cases we find that the rest frame Fe K profiles are resolved. Also the Fe K line energy in some cases is indicating that the lines are emitted from an ionised disk. In most cases the fit is satisfactory (See Table 4).
Extrapolating the best fit model down to uncovered soft excess emission in all cases except for MR 2251-178. We used blackbody models to describe this excess. The blackbody temperatures are in the range as typically measured in Seyfert 1s (0.1-0.25 keV, Gierliński & Done, 2004). We interpret residual excess emission above 7 keV as a signature of Compton-reflection from optically thick gas in the nuclear environment (Nandra & Pounds, 1994). The Xspec model pexmon (Nandra et al., 2007) was used to describe this excess emission. pexmon treats self-consistently the fluorescent emission lines from iron and nickel associated with Compton-reflection. When using pexmon, we have therefore removed the phenomenological Gaussian profiles originally included in our model. In principle, pexmon was designed to describe reflection from a plane-parallel infinite slab, such as an accretion disk as seen from the primary X-ray source. If reflection occurs in an azimuthally symmetric distribution of clouds (the most likely geometry of the reflecting AGN “torus”) the parameters obtained from pexmon may not correctly describe the system (see an extensive discussion of this point in Murphy & Yaqoob, 2009). However, we still used pexmon due to its simplicity and flexibility. We tied the normalization and the spectral index in the pexmon model to the normalization and the spectral index of the primary power-law continuum (assuming therefore a plane-parallel infinite geometry and an isotropic primary source). When the energy at the centroid of the iron line indicates ionisation (E), we needed a separate Gaussian because pexmon describes only reflection off cold matter. We have not attempted fitting these ionized emission lines with physical models, due to their weakness and the lack of spectral ranges within the EPIC-pn sensitive bandpass where continuum components associated with these lines are expected to contribute. For 11 sources in our sample de La Calle Pérez et al. (2010) detected broad Fe K emission lines. For those sources we removed the broad Gaussian lines and used more physical diskline (Fabian et al., 1989) or laor (Laor, 1991) models which describe the broadened and skewed profile of an emission line emitted by an X-ray illuminated relativistic accretion disk. The models diskline and Laor are characterised by four important parameters: the central line energy of emission, the inner radius, the emissivity profile, and the inclination of the disk. The inner radius of the disk decides the effect of the strong gravity regime on the emission line. The emissivity profile of the disk on the other hand determines the amount of flux emitted as a function of the radius of the disk. The outer radius of these model is kept fixed to . In all cases diskline profiles improve the fit with respect to Gaussian profiles, except for Mrk766 and NGC 3516 where we have used a broad Gaussian and a Laor profile, respectively.
Once all these components are included in the best-fit model, narrow features are still visible in the residuals, primarily below 2 keV. We interpreted these features as due to ionized gas along the line of sight (warm absorber), or scattering of the primary continuum by ionized gas into the line of sight (warm emitter). Warm absorbers were modeled using multiplicative table models generated using a photo-ionisation code. We followed an iterative process to finally generate a WA model. In the following section, we describe briefly the generation of the warm absorber model grids.
5 CLOUDY grids
We used the photoionisation simulation code CLOUDY (version 08.00, Ferland et al., 1998) to calculate the absorption of continuum photons by a partially ionized medium. CLOUDY uses an extensive atomic database to predict the absorption and emission spectrum through and from a cloud. The clouds are assumed to have a uniform spherical distribution around the central source and are photoionised by the source. For a cloud we approximate a plane parallel geometry by making the distance of the cloud very large compared to the thickness of the cloud. CLOUDY performs the simulations by dividing a cloud into thin concentric shells referred to as zones. The thickness of the zones are chosen small enough for the physical conditions across each zone to be nearly constant. For each zone the simulations are carried out by simultaneously solving the equations that account for ionisation and thermal balance. The model predicts the absorption and emission from such clouds in thermal and ionisation equilibrium. We have assumed a Solar abundance for the chemical composition of the gas (Grevesse & Sauval, 1998). The turbulent velocity was frozen to a value of while generating the model. We discuss our choice of turbulent velocity in appendix B.
The physical condition of the photoionised gas are dependant on the SED in the energy band (Nicastro et al., 1999; Laha et al., 2013). Hence the input continuum required by CLOUDY should be as close to the observationally obtained SED as possible for each source (in the said band). A brief description of the procedure for generating the SED is given in section 5.1.
5.1 Generating the SED
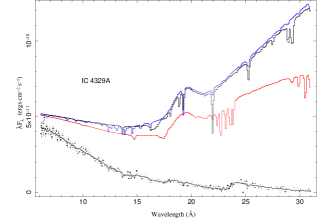
In order to characterize the UV-to-X-ray SED, we need to specify three components: the “UV bump”, the X-ray “soft-excess” and the hard X-ray power-law component.
We assumed that the UV bump in the SED of Seyferts is characterised by Shakura & Sunyaev (1973) thin disk emission which has a multi-temperature disk black body spectrum. The inner disk temperature is determined by the black hole mass obtained from previous studies assuming a accretion rate with respect to the Eddington rate, and an accretion disk extending to 6 Rg (gravitational radius). The typical values of the temperature of the inner radius of the disk-blackbody ranges from (see Table 3). The integrated model flux was then obtained from the OM observational data points, once corrected for Galactic reddening as described in Sect. 3.
The X-ray band spectral shape is determined from the model which best fits the EPIC-pn data. This model is then extrapolated to lower energies down to the energy where it meets the UV bump. We use the nthcomp model in XSPEC (Magdziarz & Zdziarski, 1995) to characterize the X-ray powerlaw and bbody model for the SE. We did not include other components in the X-ray SED such as the Compton reflection hump or the Fe K line, because they have a negligible impact on the warm absorber’s properties due to their comparative weakness. However to obtain the correct SED in the X-ray we followed an iterative procedure. In the first iteration we fitted the dataset with a generic CLOUDY WA model and obtained the best fit continuum. This continuum is then used along with the UV bump as mentioned above and we generated the ’realistic’ WA model. This model was then used to fit the EPIC-pn X-ray data. See table 5 for the best fit broad band continuum parameters.
6 X-ray spectral analysis: high resolution
After the determination of the best-fit X-ray broadband model (Sect. 4) and the UV-to-X-ray SED (Sect. 5.1), a simultaneous fit was made of the EPIC-pn, RGS1 and RGS2 spectra. The RGS spectra were fitted in the energy range of where they are well calibrated. We allowed the relative normalisation to vary among the datasets of the three instruments. We used the Cash statistics (Cash, 1979) as a goodness-of-fit test, because it properly treats spectra whose count distribution is not (or cannot be) well approximated by a Gaussian distribution. We added warm absorber components and narrow Gaussian emission lines to the baseline broadband model calculated with the EPIC-pn spectra alone, whenever their inclusion improved the value of the Cash statistic by at least , corresponding to the confidence level for 3 interesting parameters (Lampton et al., 1976). Further, we eye-inspected the residuals for any unaccounted features. The errors on the warm absorber parameters were calculated using the Levenberg-Marquardt grid search method (in ISIS) with all the discrete as well as continuum parameters free to vary in the simultaneous fit. The best fit WA parameters from the simultaneous fits of the EPIC-pn and the RGS are listed in Table 6. For the sources where we did not detect statistically significant WA components we calculated the corresponding upper/lower limits on their ionisation and column density parameters following a procedure similar to those sources showing WA detections. We added a CLOUDY WA component to the continuum best-fit model anf fit simultaneously the EPIC and RGS spectra. Using the grid search method used in ISIS (as mentioned above) we calculated the confidence ranges on the WA parameters. This yielded strict upper/lower limits on the WA parameters for five sources and unconstrained limits for four sources. The results are reported in Table 6.
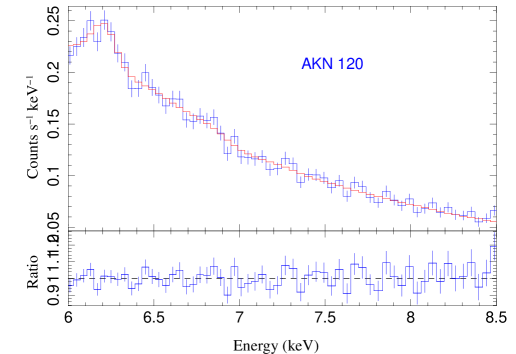
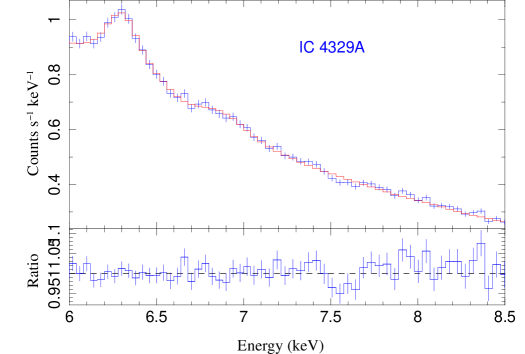
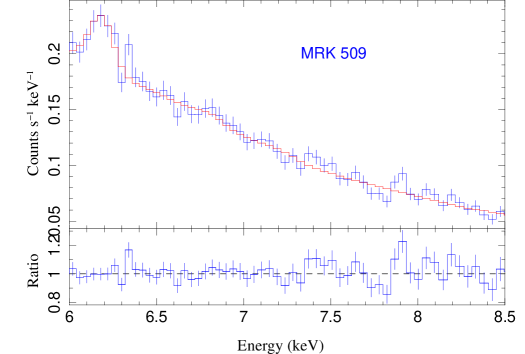
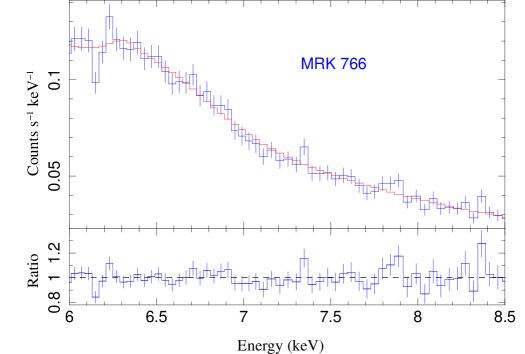
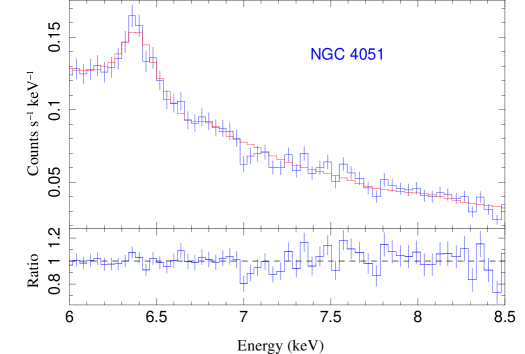
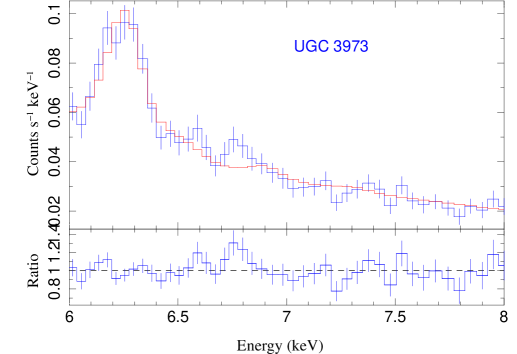
We used CLOUDY WA table models to fit narrow and weak FeK absorption features at energies . However, in no source we could find any evidence for a high and high velocity absorption phase, which would be the ultra fast outflows (UFOs) found by e.g., Tombesi et al. (2010) in some of the WAX sources. This is evident from the residuals of the best fit plot using EPIC-pn data (Fig. 13). There are no visible absorption features in the energy range after we obtain the best fit. We discuss further this issue in Section 7.4. We confirmed the lack of UFO detections by fitting the data with XSTAR table models (Kallman et al., 2004) encompassing the ionisation parameter range of and column density of .
7 Results
7.1 The broadband spectral shape
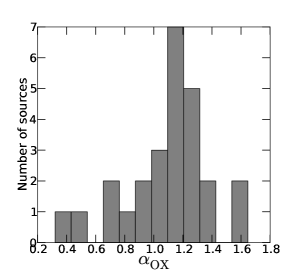
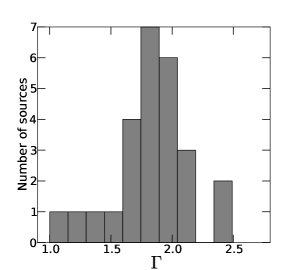
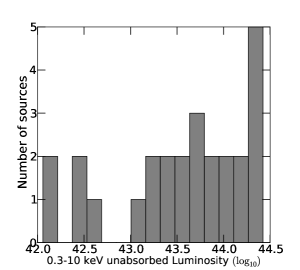
The broad band continuum as well as discrete spectral properties of the sources obtained in the WAX sample are typical of Seyfert 1 galaxies. The best-fit parameters resulting from the spectral modeling of the EPIC-pn data are shown in Table 5. In Fig. 2 we show the distribution of , photon index, and absorption-corrected luminosity, where is given by the expression (Tananbaum et al., 1979). The best fit spectral slope of the continuum for the WAX sample ranged from , with a mean value of 1.8 and a standard deviation of , consistent with previous studies (Bianchi et al. 2009). Slopes as flat as found in our sample are, however, unusual in Seyfert galaxies. There are two such cases, NGC 3516 and UGC 3973, where the sources exhibited a very low flux state during their XMM-Newton observations. This low flux state is often associated with (disk) reflection-dominated phases in the light bending scenario proposed by Miniutti & Fabian (2004).
All the sources in the sample exhibit narrow Fe K emission lines. These lines are mostly neutral, but, in some cases we additionally detect ionised Fe K emission lines with rest frame central energies lying in the range . Such ionized lines were found in 16 sources with equivalent widths ranging from (see Table 4). The narrow neutral Fe K lines were modeled simultaneously with the distant neutral reflection component. We find that values of the reflection coefficient R (ratio of the reflected and the primary flux) obtained in our study are consistent with those obtained by Winter et al. (2012) in the broad band study with XMM-Newton and Suzaku observatories. This reflection component is statistically required for 17 sources in the sample. For the sources Fairall 9, NGC 4051, IRAS 050278+1626, Mrk 279, and MCG–6–30–15 the reflection coefficient is large () indicating a more complex geometry than a simple plane-parallel infinite slab subtending an isotropic source.
For 11 sources in our sample we found broad Fe K emission line profiles which were also detected by de La Calle Pérez et al. (2010) in their sample. Table 7 enumerates all the best fit parameters obtained for the broad line components. They are emitted mostly by ionised disks as the best fit rest frame line energies are . The high emissivity profiles in all cases indicate that the bulk of the emission comes from a few gravitational radii. The inclination angles of degrees are consistent with those expected for Seyfert 1 galaxies. As a special case where XMM-Newton captured the source NGC 3516 in a low flux state, we detected a large equivalent width of the broad Fe K emission line (), in agreement with the light bending scenario. In the case of Mrk 766 the broad emission profile could not be modeled either with diskline or laor models, whereupon we used a broad Gaussian to describe it. In our sample not all sources exhibiting broad Fe K emission lines have statistical detection of warm absorbers, for e.g., ESO 511-G030 and ARK 120. Also, the neutral reflection coefficient is not correlated with the presence of broad emission lines, indicating that the two emission features arise from distinctly different regions.
The soft-excess is nearly ubiquitous (25/26) in our sample, confirming the finding of Winter et al. (2012) who detected soft-excess in 45 out of 48 sources in their sample. The blackbody temperatures required to describe the soft-excess ranges from , which is similar to the range found in previous studies (e.g., 0.1-0.25 keV, Gierliński & Done, 2004). The unabsorbed flux for each source are listed in Table 8.
7.2 The EPIC-pn and RGS joint fit
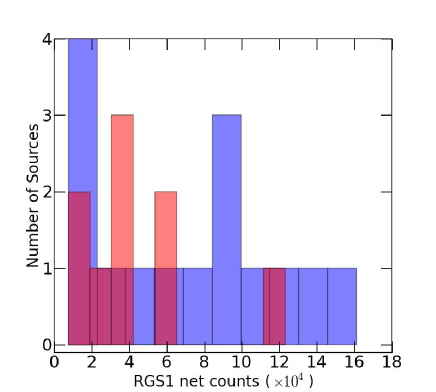
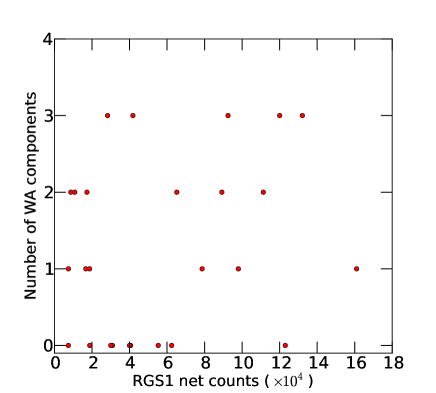
The best fit parameters obtained from the simultaneous fit of high and medium resolution spectra are reported in Table 6. The WAX sample is constituted by 26 X-ray type 1 AGN out of which 17 () sources have at least one warm absorber component. In 11 sources we detect upto three components. The WAX sample probes the column density of , ionisation parameter of , and outflow velocity of . While the sample is by construction flux-limited (with a completeness fraction of ), the observations discussed in this paper were taken in the framework of observational programs with largely diverse scientific goals. Consequently, the statistical quality of the spectra presented in this paper is very different for different sources. It is in principle possible that the detection fraction reflects more the statistical quality of the data rather than the intrinsic properties of the sample. In Fig. 3 right panel, we plot the number of detected warm absorbed components as a function of the net count rates in the RGS spectrum. We use the latter quantity as a proxy for the statistical quality of the XMM-Newton observations. We find that even for high SNR objects a WA is not present. This may indicate that the absence of WA is not solely driven by the statistical quality of the data.
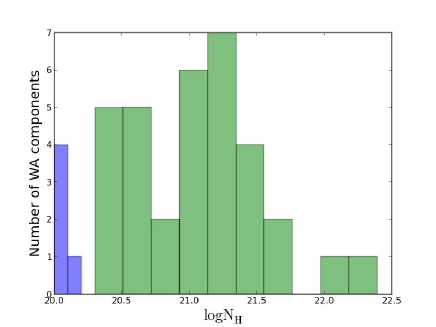
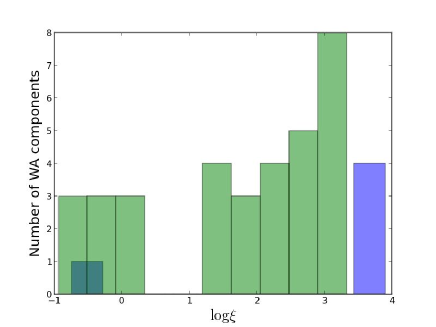
In Figure 4 we compare the distribution of column density and ionization parameter for all the sources in the WAX sample. The green histograms correspond to all the warm absorber components detected in WAX; the blue histograms indicate ionization parameter (column density) lower (upper) limit for the sources where no warm absorber component was detected. Upper/lower limits were calculated following the procedure described in Sec. 6 and are reported in Table 6. The distribution of the WA measurements and that of the censored data are different. However, a KS test could not be performed to confirm the result as the sample size of the no-WA sources is too small to derive any meaningful statistical conclusion. From Fig. 4 we find that there is gap in the space in the range , which we will discuss in Section 8.3.
7.3 Correlation analysis
We tested for correlations between the three WA parameters: , and and also between these and the continuum parameters of the sources. The results of the non-parametric Spearman rank correlation test are reported in Table 9. We find that the WA column density is correlated with the ionisation parameter with a correlation coefficient of 0.64 with confidence. We obtain correlations at a confidence level between the outflow velocity of the absorbers and the column density or the ionisation parameter (see Table 9). To test the linear dependence of the parameters in the log-log space we carried out linear regression analysis between the WA parameters following the method presented by Akritas & Bershady (1996) and using their public code to carry out the analysis. In this method the errors in both variables defining a data point are taken into account, as is any intrinsic scatter that may be present in the data, in addition to the scatter produced by the random variables. We quote the results of the analysis in Table 10 and Figure 5. A detailed comparison of these results with those obtained by T13 is reported in Section 8.5. To deal with censored data (lower limits)on the outflow velocity we used a method adapted from Schmitt (1985). We generated 1000 Monte-Carlo simulations, where each of the censored data points was replaced by a randomly extracted number from a flat distribution in the range to . For each of the simulated datasets we calculated the best-fit parameters, and the correlation coefficient. The results in Table 10 represents the average of the values obtained in the simulations. In addition we note that there are three data points where the outflow velocity is consistent with . In comparing the WAX sample results with the prediction of outflow models, we have ignored those data points from the analysis.
The correlation between the WA parameters and the continuum parameters is not straight forward, as we need to consider the inherent degeneracy in the WA parameters for a particular source. For e.g., if we consider a source which has three WA components, then for the given value of its blackhole mass there will be three values of in the - space. A possible solution to the problem would be to take average of the WA parameters for a given source, as in Blustin et al. (2005). However given the unknown structure of the WA clouds, different components of the WA for the same source may actually reflect different properties of the clouds which are stratified in nature. Therefore the average values may not be an unbiased estimate of the outflow properties. We have instead considered correlation between warm absorbers and source and continuum parameters after selecting one component for each source (e.g., that with the highest/lowest column density, ionization parameter, outflow velocity). In all the cases we found that there are no strong correlations between WA parameters and source and continuum parameters (See Table 11). We have also tested for correlations in the - separately for each source having multiple WA components. This is motivated from the fact that different sources may have different driving mechanisms for the WA clouds. If for a particular source a single driving mechanism is in operation, we should expect a correlation. We still find no correlation between these two parameters, indicating that even for a single source the outflow physics is not determined by a single process. Interestingly we do not find any correlation between the black hole mass and the corresponding WA outflow velocity. A correlation would vindicate the direct role of the black hole as the primary driver of the WA outflows. The lack of a correlation indicates that the simple virial arguments may not be used for estimating the distances of the WA from the central source, as the black hole may not have a direct influence on the outflows.
7.4 UFOs in the WAX sample
T10 in their analysis found the presence of ultra-fast-outflows (UFOs) in 15 sources out of which six sources are also in the WAX list. These are MRK 509, ARK 120, UGC 3973, NGC 4051, MRK 766, and IC 4329A. We do not detect UFOs in any of the sources of our sample. The lack of detection of UFOs in the six sources could be due to the different statistical thresolds and methods used in the spectral analysis. We investigate this discrepancy in this section.
T10 fitted the EPIC-pn spectra from only. However, the soft X-ray WA which they ignored in their analysis may also show some opacity in the hard X-rays especially near the Fe K band if their ionisation parameter as well as the column density are high enough. Limiting the fit to the hard X-ray band may lead to an erroneous estimate of the standard WA contribution to the opacity above , where UFO observational features are detected.
Secondly, limiting the spectral fitting to the hard X-ray band yields larger sytematic uncertainties in the determination of the underlying continuum. They might affect the detection of weak absorption features at the CCD resolution in a band where additional spectral complexity (Compton reflection, partial covering obscuration, recombination lines from highly ionised plasma) may take place at least in some sources. Figure 13 shows that there are no statistically significant negative residuals after a full band modeling has been done as enumerated in Sections 4 and 6.
Lastly, we also note that none of the previous individual studies done on the six common sources between T10 and our work found any UFO. See for e.g., Smith et al. (2007); Vaughan et al. (2004); Gallo et al. (2011); Krongold et al. (2008); Mason et al. (2003); Steenbrugge et al. (2005) for MRK 509, ARK 120, UGC 3973, NGC 4051, MRK 766, and IC 4329A, respectively. Ponti et al. (2013) in a long 600 ks XMM-Newton campaign of the source MRK 509 found no statistically significant highly ionised, high velocity outflows.
7.5 WA parameter ranges probed by WAX
As mentioned in Section 7.2, the WAX sample probes the column density of , ionisation parameter of , and outflow velocity of . In this Section, we discuss the possibility that the lack of the shallow WA components with low ionisation parameters and low column density in the ranges and is driven by the statistical quality of our data. The lack of components with low ionisation parameter and high column density is a consequence of the WAX sample definition. We carried out simulations of the bright WAX source Ark 120 as well as a less luminous source ESO 511-G030, showing no WA features. We added a CLOUDY WA model component with with to the best fit continuum of AKN 120 and ESO 511-G030 and generated fake EPIC-pn as well as RGS datasets using the fakeit command in ISIS. We fitted these fake datasets with a model consisting of continuum parameters only to statistically detect the presence of the WA in the data. We found that the fit worsened by for both the cases. This indicates that the non-detection of such WA components in the WAX sample is not instrument limited.
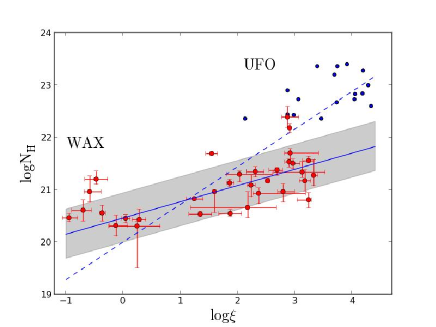
In the right panel of Figure 5 we compare the column density versus the ionisation parameter relation for the warm absorber components for WAX data points with the extrapolation of the correlation of the same parameters for the UFOs in T13 (dashed line). We observe a relative dearth of measurements in the central part of this plot. To investigate possible observational biases, we have performed simulations similar to those described above assuming pairs of values with and with for both the sources. In all cases we found that the quality of the fit of the simulated datasets worsened with respect to the real data by indicating that the observed gap in the column density versus ionisation parameter plane is not an instrumental bias.
8 Discussion
In this paper, we have performed a systematic high resolution spectral study of a sample of Seyferts and studied the WA properties in detail. The sample consists of bright nearby Seyfert 1 galaxies which have XMM-Newton data. We discuss below the findings of our study.
8.1 Detection fraction of warm absorbers
The best fit parameters for the WA components are shown in Table 6. We detect warm absorber components in 17 sources out of 26 WAX sources. In four sources the values of the WA column density and the ionisation parameters cannot be constrained. The quality of these data is therefore insufficient to address whether these sources host a WA. For the remaining five sources the lower limit on the ionisation parameter and the upper limit on the column density are inconsistent with the distribution of these quantities in detected WAX components (see Figure 4). We interpret these objects as bona fide WA-bare AGN.
The WA detection fraction in the WAX sample is (17 out of 22 sources with definite detections) with a statistical error of , which is calculated using a binomial distribution for the occurrence of WA in the parent sample. Taking into account further uncertainties yielded by the 4 objects whose spectra do not have sufficient statistical quality, a further systematic error of [] has to be added to the estimate of the detection fraction. Our sample is only complete at , so an error of is added futher. This gives an upper limit of detection of . On the other hand the most conservative lower limit on the occurence of WA is (17 out of 34 sources). This indicates that at least of the Seyferts in nearby universe should have WA.
Our study yields a detection fraction which is broadly consistent with the previous sample studies on AGN WA with ASCA, Chandra, and XMM-Newton. Blustin et al. (2005) obtained a detection fraction of . The study by Winter et al. (2012) on the other hand has put the upper limit to although they claim that WA are ubiquitous in AGN. The comparative advantage of our study is that we have investigated a flux limited sample of AGN with a known (and comparably small) incompleteness, as opposed to the sparse collections or largely incomplete samples used in previous studies. Lacking any direct estimate of the X-ray WA covering fraction, , we assume hereafter a value comparable to the detection fraction in our sample, . However we need to keep in mind a couple of caveats in the context of calculating a conservative upper limit on the detection fraction. Firstly, the source Mrk 279 does not show any WA in WAX analysis. We have used a single exposure ( ks) dataset. Costantini et al. (2010) studied the same source and have combined 3 other datasets to effectively have exposure. They could detect two weak WA componets. However for no other WAX sources this is the case. Secondly, WA features could be transient, as recently discovered in Mkn 335 (Longinotti et al., 2013)
8.2 The driving mechanisms of the WA
There are primarily three existing models for driving mechanisms of the WA outflows. The first scenario is the radiatively driven wind where the radiation pressure is mainly accounted for by the UV absorption lines (Proga & Kallman, 2004). However, if the cloud is highly ionised then the UV and X-ray line opacities may not be sufficient to drive the clouds. In such a case Compton scattering can provide the necessary momentum to the outflow (King & Pounds, 2003; King, 2010). In the radiatively driven wind scenario a simple scaling relation holds: .
The second scenario is that the WA are accelerated by magneto hydrodynamically driven (MHD) processes (Blandford & Payne, 1982; Everett & Ballantyne, 2004; Fukumura et al., 2010). This possibility stems from the fact that some of the most important AGN nuclear phenomenon like the accretion disk viscosity and the existence of a corona can be explained by MHD mechanisms. Fukumura et al. (2010) suggested that MHD winds could be fundamental to the AGN outflows and suggested few scaling relations between obervable WA parameters (, and ). These relations can be reduced roughly to (Kazanas et al., 2012). However, in this model there are certain limitations, for e.g., the authors consider the disk as a boundary only, while in a realistic situation the accretion physics should also be taken in to account.
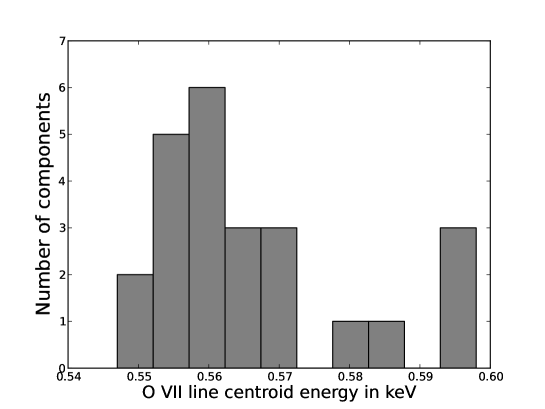
The third scenario is that of the thermally driven wind (Begelman et al., 1983; Krolik & Kriss, 2001; Netzer, 2006). The flux of the central source irradiates the accretion disk and heats it up to some larger radius where the heating produced locally is negligible compared to the radiative heating. The rate of heating is proportional to the flux of the incident radiation but the cooling rate is dependent on collisional cooling, whereby it declines with density as we move away from the equatorial plane of the accretion disk. The AGN central radiation is sufficiently hard to heat the gas to K by the Compton process. This temperature is very high compared to the internal temperatures of the outer part of the accretion disk. Hence, if one focusses on a thin layer above the outer parts of the accretion disk, the gas forms a tenuous plasma with the thickness exceeding that of the disk. If the sound speed in this heated gas is higher than the escape speed from the system at a given radius, the gas will escape resulting in a wind which is thermally driven. As enumerated by Begelman & McKee (1983), for a Compton heated wind we would observe: (1) an extended source of scattered X-rays, (2) X-ray polarisation, (3) X-ray line emission due to reprocessing of incident X-rays by the disk, and (4) in the UV the spectrum will differ from the simple blackbody scaling. (1), (2), and (4) are beyond the observational capability of our sample. We discuss here briefly the possibility that the emission lines ubiquitously associated to WA features in the WAX sample could be the signature of a hot disk atmosphere in this scenario. The He like triplet lines of O vii are the most commonly detected emission lines in the energy band of RGS and they serve as the most important tool in plasma diagnostics of the emitting medium. The three emission lines: resonant (r), intercombination (i), and forbidden (f) for the O vii He like ion have rest frame energies of respectively. The resonant line is mostly emitted by a collisionally ionised plasma while the forbidden line is emitted by colder low density photo-ionised plasma. Figure 7 shows the distribution of the detected line centroid energies of the O vii triplet. We find that the distribution is mostly clustered around the rest frame energy of the forbidden line indicating that the emission lines are possibly emitted from a photo-ionised plasma instead of a collisionally ionised, high-temperature thermal plasma. If these emission lines are emitted by the same clouds which show warm absorption, we can rule out the origin of WA from a thermally driven wind. However a detailed study of the warm emission lines will be carried out in a future study.
From our study we find the linear regression slope between the two parameters is . Our measurements on the whole sample do not follow the simple scaling relations predicted by either radiation-driven or MHD-accelerated winds. The WA winds expand as it moves out and hence its volume density decreases which has to be taken into account in a geometrical framework to consider any driving mechanism. We cannot rule out the presence of other mechanisms or the combination of the above mentioned ones. Even for individual sources with multiple components of WA we find that the linear regression slope between the and do not conform with the predictions of the above driving mechanisms.
8.3 The gap in the distribution
From Fig. 4 we find that there is a gap in the distribution of the ionisation parameter in the range . This gap has been previously observed in many of the studies on individual sources (Sako et al., 2001; Krongold et al., 2003, 2005). For the first time we have confirmed the absence of particular ionic states in high resolution data, for a uniformly analysed sample of 26 Seyfert galaxies. The gap could therefore be a universal feature which disfavours a continuous distribution of ionisation parameter (see for e.g., Krongold et al., 2005). However, as a caveat we should remember that the exact values of the fitted ionisation parameter depend on the assumed values of the cloud metallicity and the source SED. Nevertheless, such a gap in the distribution of is intriguing. There are two possible reasons for it. Firstly, it may be due to the absence of strong ionic transitions in that energy range with weak lines being undetected in our data. Secondly, it could be that clouds inherently fail to have those states, for e.g, if the clouds are thermally unstable in that range of ionisation parameter.
The first reason can be ruled out from the simulations carried out in Section 7.5 which showed that a WA component of and is detectable by our present instrument and data quality. Therefore, the only reason for this gap could be thermal instability of the gas in that regime of ionisation parameter.
Holczer et al. (2007) studied the absorption measure distribution (AMD), defined as d/d, for two bright sources (IRAS 13349+2438 and NGC 3783) showing warm absorption. Both the sources showed a double peak distribution of the AMD with a deep minimum in the range , which is nearly same as the range in which we find a gap in the distribution of the ionisation parameter. Holczer et al. (2007) believe that this minimum is due to thermal instability. A systematic stability curve analysis will be carried out in a future paper.
One other interesting feature is the large distribution range of the ionisation parameters for individual sources. For sources like MRK 704, NGC 4051, NGC 3227, MCG-6-30-15, IC 4329A, we have detected ionisation parameters ranging over almost three decades. Behar (2009) pointed out that the AMD slopes for such sources could be a tool for density diagnostic of the clouds. A systematic study of AMD for WAX sources will be taken up by us in the future.
8.4 Relation between outflows and relativistic spectral features
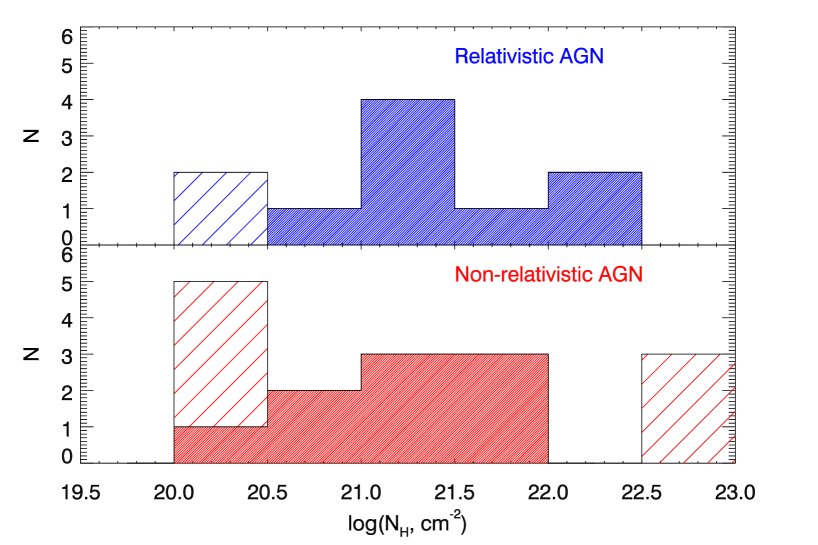
It has been suggested that the broad profiles of the Fe K fluorescent line detected in the X-ray spectra of nearby Seyfert galaxies (Nandra et al., 2007; de La Calle Pérez et al., 2010) could be an artifact of fitting multiple layers of partial covering, ionised absorption with a relativistically smeared disk reflection continuum. To test this hypothesis, we plot the WA column density distributions for sources where our analysis suggests the presence/absence of a relativistically broadened K profile (Fig. 6). For sources with multiple WA components, we plot the highest column density, as this is likely to yield the largest spectral impact on iron line modeling. The distributions are indistinguishable. This rules out that an adequate modelling of the WA opacity is the main driver underlying the detection of relativistically broadened spectral components, in particular of the Fe K red wing (Fabian et al., 1989).
8.5 Are WA and UFOs different manifestations of the same physical system?
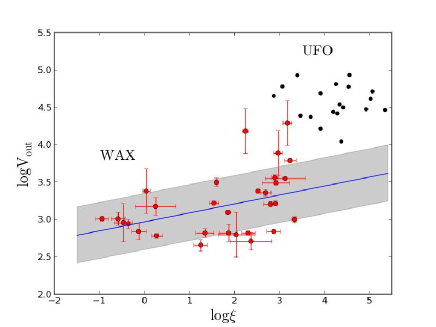
It is still a matter of debate whether the UFOs and the WA are different manifestations of the same physical system or not. T13 have concluded that in the parameter space spanned by , and , WA and the UFOs lie at the extreme ends of the same correlation, pointing to a common nature of the two types of outflows. To test this hypothesis, we compare the locus occupied by the WAX (UFO) points in the parameter spaces defined by the warm absorber observables with the extrapolation of the regression fit on the UFO (WAX) data points.
Figure 5 left panel shows the linear regression fit in the - space for both the WAX sample and the UFOs (T13). We find that the UFOs do not lie on the extrapolated linear regression fit of the WAX sample. On the other hand we find that the regression analysis of the UFOs predict a large span of - space, which includes the WAX data points. The right panel of figure 5 shows the linear regression fit in the - space where we find that the UFOs do not lie on the extrapolated linear regression fit of the WAX sample. We therefore conclude that our results are inconsistent with the warm absorbers and UFOs occupying extreme loci of the same correlation between the wind observables. They do not directly indicate a common origin between UFOs and the WAs.
9 Summary and conclusions
In this paper we analyse for the first time a hard X-ray flux-limited sample of nearby Seyfert galaxies, using broad-band EPIC-pn and high resolution RGS X-ray data. The primary goals of our study are: a) to estimate the incident rate of ionised outflows in nearby, X-ray bright Seyfert galaxies; b) To constrain their acceleration mechanism; and c) their relation with high-velocity UFOs.
The main conclusions of the paper are:
-
•
WA do not appear ubiquitously in our sample. The detection fraction of WA in the WAX parent population is constrained between . However we could put a strict lower limit on the detection fraction which indicates that at least half of all the Seyfert galaxies in the nearby Universe exhibits warm ionised outflows.
-
•
We find a gap in the distribution of the ionisation parameter in the range which we interpret as a thermally unstable region for WA clouds. This may point towards discrete and clumpy configuration of WA clouds as against a continuous medium.
-
•
WA parameters (, and ) do not show any significant correlation between themselves except for , . They also do not correlate with any of the X-ray broad band continuum parameters.
-
•
Our results are inconsistent with the correlation between the outflow velocity and the ionisation parameter predicted either by Compton-scattering driven (King 2003, ) or MHD driven (Fuzukawa et al. 2010, ) winds. The linear regression between and on the whole sample is . A similar discrepancy occurs if the independent components of each individual source are separately considered.
-
•
The presence of WA are not related to the presence of relativistic Fe K features as we find sources without WA but with a broad Fe K line. The detection of the broad line features in the X-rays are not influenced by the WA modeling.
-
•
The UFOs and the WA may not be the same physical system. The correlations among gas observables obtained in our paper do not extend to the UFO regime. However, given the poor statistical quality of UFO data points, the linear regression line in the UFO parameter space encompasses the WA data points as well.
| No. | Object | Seyfert | V | Redshift | Lum dist | |||
|---|---|---|---|---|---|---|---|---|
| name | type | mag | (Mpc) | |||||
| 1. | NGC4593 | 1 | 11.67 | 0.009 | 42.0 | 6.77 | 1.9 | |
| 2. | MRK 704 | 1.2 | 15.38 | 0.029 | 127.2 | 7.62 | 2.9 | |
| 3. | ESO511-G030 | 1 | 13.30 | 0.022 | 97.0 | 8.4 | 4.69 | |
| 4. | NGC 7213 | 1.5 | 11.01 | 0.0058 | 21.2 | 8.3 | 1.06 | |
| 5. | AKN 564 | LINER | 14.55 | 0.024 | 98.6 | 6.7 | 5.34 | |
| 6. | MRK 110 | 1 | 15.6 | 0.035 | 151 | 7.4 | 1.30 | |
| 7. | ESO198-G024 | 1 | 15.36 | 0.045 | 192 | 8.1 | 2.93 | |
| 8. | Fairall-9 | 1 | 13.5 | 0.047 | 199 | 8.6 | 3.16 | |
| 19. | UGC 3973 | 1.5 | 13.9 | 0.022 | 94.4 | 8.1 | 5.27 | |
| 10. | NGC 4051 | 1.5 | 10.83 | 0.002 | 12.7 | 6.3 | 1.32 | |
| 11. | MCG-2-58-22 | 1.5 | 14.6 | 0.046 | 194 | 7.36 | 2.91 | |
| 12. | NGC 7469 | 1.2 | 13.0 | 0.016 | 62.7 | 7.1 | 4.45 | |
| 13. | MRK 766 | 1.5 | 13.7 | 0.0129 | 57.7 | 7.5 | 1.71 | |
| 14. | MRK 590 | 1.2 | 13.85 | 0.026 | 107 | 8.6 | 2.65 | |
| 15. | IRAS05078+1626 | 1.5 | 15.6 | 0.017 | 74.3 | 7.86 | 2.20 | |
| 16. | NGC3227 | 1.5 | 11.1 | 0.003 | 20.4 | 7.4 | 2.15 | |
| 17. | MR2251-178 | 1 | 14.36 | 0.063 | 271 | 8.5 | 2.42 | |
| 18. | MRK 279 | 1.5 | 14.57 | 0.030 | 129 | 7.5 | 1.52 | |
| 19. | ARK 120 | 1 | 15.3 | 0.032 | 138 | 8.4 | 9.78 | |
| 20. | MCG+8-11-11 | BLSY | 15 | 0.02 | 85.8 | 8.48 | 1.84 | |
| 21. | MCG-6-30-15 | 1.5 | 13.7 | 0.007 | 35.8 | 7.0 | 3.92 | |
| 22. | MRK 509 | 1.2 | 3.0 | 0.034 | 141 | 8.3 | 4.25 | |
| 23. | NGC 3516 | 1.5 | 12.5 | 0.008 | 37.5 | 7.7 | 3.45 | |
| 24. | NGC 5548 | 1.5 | 13.3 | 0.017 | 74.5 | 8.1 | 1.55 | |
| 25. | NGC 3783 | 1 | 12.64 | 0.009 | 44.7 | 7.8 | 9.91 | |
| 26. | IC 4329A | 1.2 | 14.0 | 0.016 | 70.6 | 8.2 | 4.61 |
The blackhole masses are obtained from de La
Calle Pérez et al. (2010) and Winter et al. (2012). The Redshift, V band magnitude, Luminosity distance, Seyfert classification are obtained from NED. The are obtained from HEASARC.
The source identification numbers listed in column one are uniformly used in all places throughout this paper.
| No. | Object | Obs | Date | Total | RA | Dec |
|---|---|---|---|---|---|---|
| name | id | of obs | exposure | (Degrees) | (Degrees) | |
| (DD-MM-YY) | (Ks) | |||||
| 1. | NGC4593 | 0109970101 | 02-07-2000 | 28 | 189.914 | |
| 2. | MRK 704 | 0502091601 | 03-05-2008 | 98 | 139.608 | 16.305 |
| 3. | ESO511-G030 | 0502090201 | 05-08-2007 | 112 | 214.843 | –26.644 |
| 4. | NGC 7213 | 0605800301 | 11-11-2009 | 132 | 332.317 | –47.166 |
| 5. | AKN 564 | 0206400101 | 05-01-2005 | 101 | 340.663 | 29.725 |
| 6. | MRK 110 | 0502090201 | 15-11-2004 | 47 | 141.303 | 52.286 |
| 7. | ESO198-G024 | 0305370101 | 04-02-2006 | 122 | 39.581 | –52.192 |
| 8. | Fairall-9 | 0605800401 | 09-12-2009 | 130 | 20.940 | –58.805 |
| 9. | UGC 3973 | 0502091001 | 26-04-2008 | 89 | 115.636 | 49.809 |
| 10. | NGC 4051 | 0109141401 | 16-05-2001 | 122 | 180.790 | 44.531 |
| 11. | MCG-2-58-22 | 0109130701 | 01-12-2002 | 20 | 346.181 | –8.685 |
| 12. | NGC 7469 | 0112170101 | 30-11-2000 | 18 | 345.815 | 8.874 |
| 13. | MRK 766 | 0109141301 | 20-05-2001 | 130 | 184.610 | 29.812 |
| 14. | MRK 590 | 0201020201 | 04-07-2004 | 112 | 33.639 | –0.766 |
| 15. | IRAS05078+1626 | 0502090501 | 21-08-2007 | 61 | 77.689 | 16.498 |
| 16. | NGC3227 | 0400270101 | 03-12-2006 | 107 | 155.877 | 19.865 |
| 17. | MR2251-178 | 0012940101 | 18-05-2002 | 65 | 343.524 | –17.581 |
| 18. | MRK 279 | 0302480401 | 15-11-2005 | 60 | 208.264 | 69.308 |
| 19. | ARK 120 | 0147190101 | 24-08-2003 | 112 | 79.047 | –0.149 |
| 20. | MCG+8-11-1 | 0201930201 | 09-04-2004 | 38 | 88.723 | 46.439 |
| 21. | MCG-6-30-15 | 0029740701 | 08-02-2001 | 130 | 203.973 | –34.295 |
| 22. | MRK 509 | 0306090201 | 19-10-2005 | 86 | 311.040 | –10.723 |
| 23. | NGC 3516 | 0107460701 | 09-11-2001 | 130 | 166.697 | 72.568 |
| 24. | NGC 5548 | 0089960301 | 09-07-2001 | 96 | 214.498 | 25.136 |
| 25. | NGC 3783 | 0112210501 | 19-12-2001 | 138 | 174.757 | –37.738 |
| 26. | IC 4329A | 0147440101 | 06-08-2003 | 136 | 207.330 | –30.309 |
Obtained from Heasarc and XSA.
.
| No. | Object | Filter1 | Flux observed | Corrected flux | |||
| name | used | Galactic | |||||
| extinction | |||||||
| 1. | NGC4593 | UVW2 | 9.99 | 0.191 | 11.91 | 26.42 | |
| 2. | MRK 704 | UVW1 | 7.3 | 0.150 | 8.3 | 16.20 | |
| 3. | ESO511-G030 | UVW2 | 14.58 | 23.8 | 10.34 | ||
| 4. | NGC 7213 | UVW1 | 6.5 | 0.079 | 6.99 | 10.95 | |
| 5. | AKN 564 | UVW1 | 7.06 | 0.312 | 9.4 | 27.51 | |
| 6. | MRK 110 | UVW2 | 25 | 0.100 | 27.4 | 18.38 | |
| 7. | ESO198-G024 | UVM2 | 5.06 | 0.270 | 6.49 | 12.3 | |
| 8. | Fairall-9 | UVW1 | 17.74 | 0.141 | 20.20 | 9.21 | |
| 9. | UGC 3973 | UVW2 | 9.9 | 0.549 | 16.4 | 12.29 | |
| 10. | NGC 4051 | UVW2 | 15.2 | 0.101 | 16.6 | 34.63 | |
| 11. | MCG-2-58-22 | UVW1 | 6.3 | 0.218 | 7.7 | 18.81 | |
| 12. | NGC 7469 | UVW2 | 33.5 | 0.535 | 54.8 | 21.85 | |
| 13. | MRK 766 | UVW2 | 0.132 | 0.152 | 0.151 | 17.36 | |
| 14. | MRK 590 | UVW2 | 1.56 | 0.290 | 2.03 | 9.21 | |
| 15. | IRAS05078+1626 | UVW2 | 0.32 | 2.36 | 2.7 | 14.11 | |
| 16. | NGC3227 | UVW1 | 9.0 | 0.118 | 10.0 | 18.38 | |
| 17. | MR2251-178 | UVW2 | 8.05 | 0.303 | 10.6 | 9.76 | |
| 18. | MRK 279 | UVW2 | 24.32 | 0.123 | 26 | 17.36 | |
| 19. | ARK 120 | UVW2 | 35.8 | 0.996 | 89.6 | 10.34 | |
| 20. | MCG+8-11-11 | UVW1 | 8.02 | 1.136 | 22.8 | 9.87 | |
| 21. | MCG-6-30-15 | U Band | 0.38 | 0.267 | 0.478 | 23.15 | |
| 22. | MRK 509 | UVW2 | 38 | 0.446 | 57.3 | 10.95 | |
| 23. | NGC 3516 | UVW2 | 19.1 | 0.329 | 25.8 | 15.47 | |
| 24. | NGC 5548 | U BAND | 13.1 | 0.088 | 14.2 | 12.29 | |
| 25. | NGC 3783 | UVW2 | 26.15 | 0.925 | 61.3 | 14.60 | |
| 26. | IC 4329A | UVW1 | 1.38 | 0.459 | 2.1 | 11.60 |
1 U Band- , UVW1- , UVM2- , UVW2- .
2 is the Galactic extinction correction magnitude.
3 is the blackbody temperature of the accretion disk emission as calculated in Section 5.1
| No. | Source | Fe K | Fe K | Fe K | |||
|---|---|---|---|---|---|---|---|
| norm | Line centroid energy () | Line width () | |||||
| () | |||||||
| 1. | NGC4593 | ||||||
| 2. | MRK 704 | ||||||
| 3. | ESO511 G030 | ||||||
| 4. | NGC 7213 | ||||||
| 5. | AKN564 | ||||||
| 6. | MRK110 | ||||||
| 7. | ESO198-G24 | ||||||
| 8. | Fairall 9 | ||||||
| 9. | UGC3973 | ||||||
| 10. | NGC4051 | ||||||
| 11. | MCG-2-58-22 | ||||||
| 12. | NGC7469 | ||||||
| 13. | MRK766 | ||||||
| 14. | MRK590 | ||||||
| 15. | IRAS050278 | ||||||
| 16. | NGC3227 | ||||||
| 17. | MR2251-178 | ||||||
| 18. | MRK279 | ||||||
| 19. | ARK 120 | ||||||
| . |
Table 4 continued
| No. | Source | Fe K | Fe K | Fe K | ||
|---|---|---|---|---|---|---|
| norm | Line centroid energy () | Line width () | ||||
| () | ||||||
| 20. | MCG+8-11-11 | |||||
| 21. | MCG-6-30-15 | |||||
| 22. | MRK509 | |||||
| 23. | NGC 3516 | |||||
| 24. | NGC5548 | |||||
| 25. | NGC3783 | |||||
| 26. | IC4329A | |||||
| No. | Source | EPIC-pn | 1zwabs | Fe K | Fe K | 5Reflection | ||||
|---|---|---|---|---|---|---|---|---|---|---|
| counts | () | centroid energy | 2Eqw | (R) | ||||||
| () | () | () | () | ( | () | |||||
| 1. | NGC4593 | — | — | — | ||||||
| 2. | MRK 704 | — | ||||||||
| 3. | ESO511G030 | — | ||||||||
| 4. | NGC 7213 | — | ||||||||
| 5. | AKN564 | |||||||||
| 6. | MRK110 | — | ||||||||
| 7. | ESO198-G24 | — | — | — | — | |||||
| 8. | Fairall 9 | — | ||||||||
| 9. | UGC3973 | — | — | |||||||
| 10. | NGC4051 | 18 | — | — | ||||||
| 11. | MCG-2-58-22 | — | — | |||||||
| 12. | NGC7469 | — | ||||||||
| 13. | MRK766 | — | ||||||||
| 14. | MRK590 | — | — | — | — | |||||
| 15. | IRAS050278 | — | ||||||||
| +1626 | ||||||||||
| 16. | NGC3227 | — | — | |||||||
| 17. | MR2251-178 | — | — | — | ||||||
| 18. | MRK279 | — | ||||||||
| 19. | ARK 120 | — | — |
1The intrinsic neutral absorption by the host galaxy
2The equivalent width of the Fe K emission line.
The best fit blackbody temperatures.
5 The Neutral reflection coefficient as defined in section 4.
Table 5 continued
| No. | Source | EPIC-pn | 1zwabs | Fe K | Fe K | 5Reflection | ||||
|---|---|---|---|---|---|---|---|---|---|---|
| counts | () | centroid energy | 2Eqw | (R) | ||||||
| () | () | () | () | ( | () | |||||
| 20. | MCG+8-11-11 | — | ||||||||
| 21. | MCG-6-30-15 | |||||||||
| 22. | MRK509 | — | — | |||||||
| 23. | NGC 3516 | — | — | |||||||
| 24. | NGC5548 | — | — | — | ||||||
| 25. | NGC3783 | – | — | — | ||||||
| 26. | IC4329A |
1The intrinsic neutral absorption by the host galaxy
2The equivalent width of the Fe K emission line.
The best fit blackbody temperatures.
5 The Neutral reflection coefficient as defined in section 4.
| No. | Source | RGS | WE line | WE line | WA | WA- | WA-velocity | |
| Counts | centroid Energy | norm | ||||||
| () | () | ( | ||||||
| 1. | NGC4593 | -23 | ||||||
| -42 | ||||||||
| 2. | MRK 704 | -55 | ||||||
| -45 | ||||||||
| -53 | ||||||||
| 3. | ESO511 G030 | — | — | |||||
| 4. | NGC 7213 | — | — | — | — | |||
| 5. | AKN 564 | -163 | ||||||
| 6. | MRK 110 | — | — | |||||
| 7. | ESO198-G24 | 0 | — | — | ||||
| 8. | Fairall 9 | — | — | |||||
| 9. | UGC3973 | -93 | ||||||
| 10. | NGC 4051 | -161 | ||||||
| -458 | ||||||||
| 11. | MCG-2-58-22 | — | — | — | — | |||
| 12. | NGC 7469 | -117 | ||||||
| 13. | MRK 766 | -256 | ||||||
| -22 | ||||||||
| -120 | ||||||||
| 14. | MRK 590 | — | — | |||||
| 15. | IRAS050278 | -17 | ||||||
| -18 | ||||||||
| 16. | NGC 3227 | -240 | ||||||
| -32 | ||||||||
| -161 | ||||||||
| 17. | MR2251-178 | -12 | ||||||
| -185 | ||||||||
| 18. | MRK 279 | — | — | — | — | |||
| 19. | ARK 120 | — | — |
Table 6 continued
| No. | Source | RGS | WE line | WE line | WA | WA- | WA-velocity | |
|---|---|---|---|---|---|---|---|---|
| Counts | centroid Energy | norm | ||||||
| () | () | ( | ||||||
| 20. | MCG-8+11+11 | -23 | ||||||
| 21. | MCG-6-30-15 | -116 | ||||||
| -187 | ||||||||
| -162 | ||||||||
| 22. | MRK 509 | -181 | ||||||
| 23. | NGC 3516 | -230 | ||||||
| 24. | NGC 5548 | -347 | ||||||
| -836 | ||||||||
| 25. | NGC 3783 | |||||||
| 26. | IC4329A | -51 | ||||||
| -46 | ||||||||
| -235 |
| Source | Profile | Line centroid | Eqw | 1Betor10 | 1 Index | Inclination |
|---|---|---|---|---|---|---|
| (model) | () | (diskline) | (Laor) | |||
| ESO 511-G030 | Laor | — | ||||
| UGC 3973 | Diskline | — | ||||
| NGC 4051 | Laor | — | ||||
| NGC 3227 | Diskline | — | ||||
| ARK 120 | Diskline | — | ||||
| MCG-6-30-15 | Diskline | — | ||||
| MRK 509 | Laor | — | ||||
| NGC 3516 | Laor | — | ||||
| NGC 3783 | Laor | — | ||||
| IC 4329A | Diskline | — |
1 The emissivity profiles for the broad emission lines.
.
| No. | Source | ||||||
|---|---|---|---|---|---|---|---|
| 1 | NGC4593 | ||||||
| 2 | MRK704 | ||||||
| 3 | ESO511-G030 | ||||||
| 4 | NGC7213 | ||||||
| 5 | AKN564 | ||||||
| 6 | MRK110 | ||||||
| 7 | ESO198-G24 | ||||||
| 8 | Fairall 9 | ||||||
| 9 | UGC 3973 | ||||||
| 10 | NGC 4051 | ||||||
| 11 | MCG-2-58-22 | ||||||
| 12 | NGC 7469 | ||||||
| 13 | MRK766 | ||||||
| 14 | MRK 590 | ||||||
| 15 | IRAS05078 | ||||||
| 16 | NGC 3227 | ||||||
| 17 | MR2251-178 | ||||||
| 18 | MRK 279 | ||||||
| 19 | ARK 120 | ||||||
| 20 | MCG+8-11-11 | ||||||
| 21 | MCG-6-30-15 | ||||||
| 22 | MRK 509 | ||||||
| 23 | NGC 3516 | ||||||
| 24 | NGC 5548 | ||||||
| 25 | NGC 3783 | ||||||
| 26 | IC 4329A |
1 The ionising luminosity is calculated over the energy range of .
| Quantity | WA- | WA- | WA-velocity |
|---|---|---|---|
| WA- | 1 | (0.64,) | (0.33,) |
| WA- | (0.64,) | 1 | (0.36,) |
| WA-velocity | (0.33,) | (0.36,) | 1 |
| Dev | Dev | ||||||
|---|---|---|---|---|---|---|---|
stands for the Spearman rank correlation coefficient.
| Quantity | MBH | |||||
|---|---|---|---|---|---|---|
| WA-highest | (0.05,0.84) | (0.40,0.11) | (0.23,0.37) | (0.04,0.87) | (-0.01,0.97) | |
| WA-lowest | (-0.34,0.174) | (-0.35,0.15) | (-0.48,0.05) | (0.10,0.68) | (0.11,0.66) | |
| WA-highest | (0.10,0.68) | (0.40,0.10) | (0.43,0.08) | (0.16,0.53) | (0.018,0.94) | |
| WA-lowest | (-0.03,0.89) | (-0.19,0.45) | (-0.32,0.19) | (0.09,0.71) | (-0.11,0.65) | |
| WA-highest-velocity | (0.25,0.33) | (0.23,0.36) | (0.16,0.53) | (-0.14,0.56) | (0.14,0.58) | |
| WA-lowest-velocity | (0.29,0.25) | (0.036,0.88) | (-0.08,0.75) | (-0.29,0.24) | (-0.04,0.87) |
Appendix A Figures.
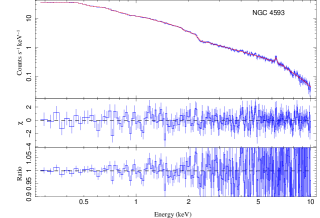
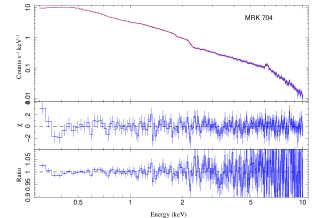
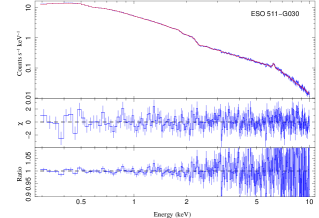
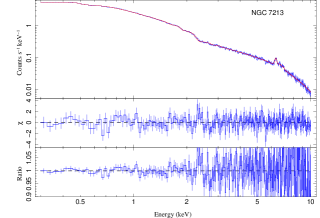
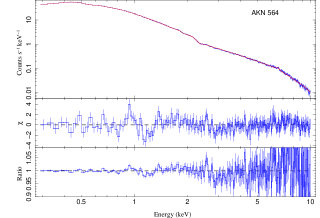
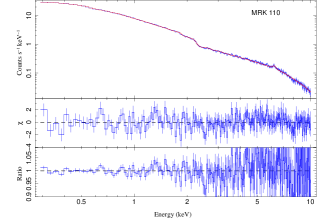
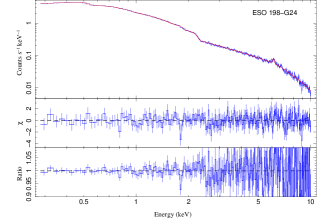
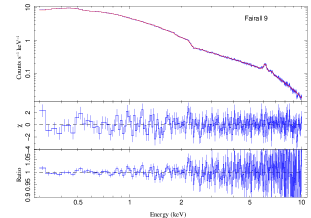
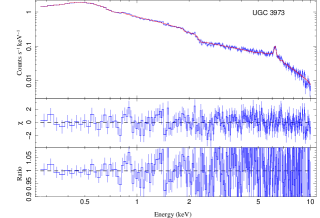
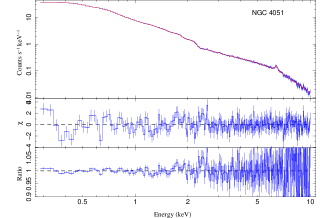
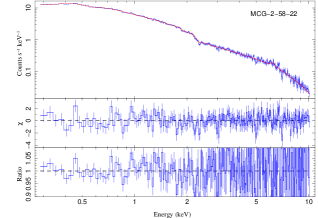
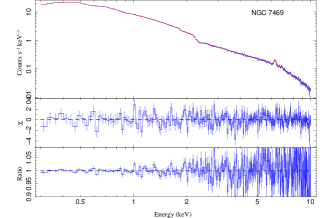
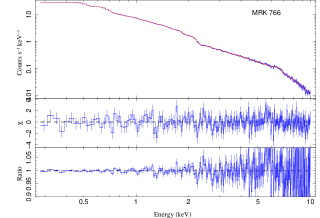
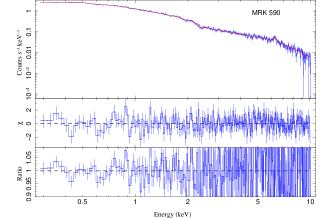
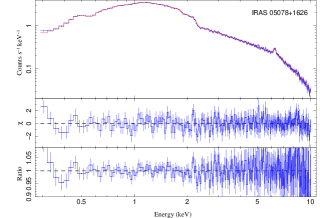
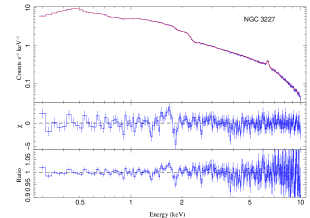
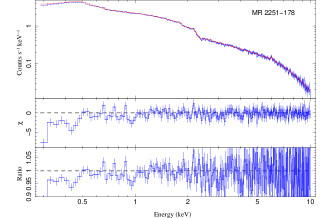
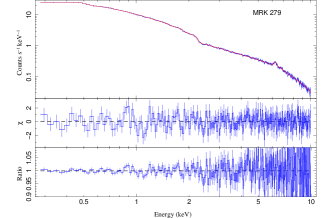
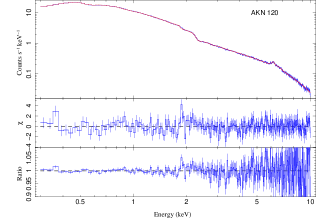
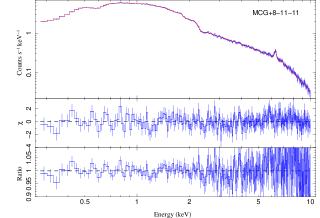
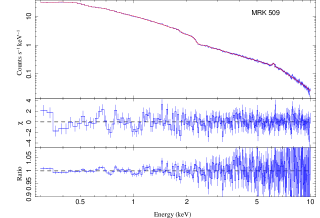
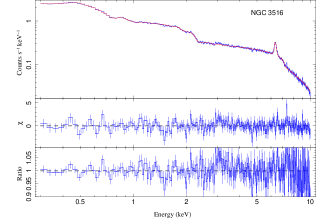
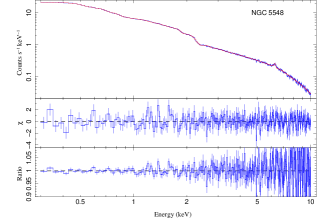
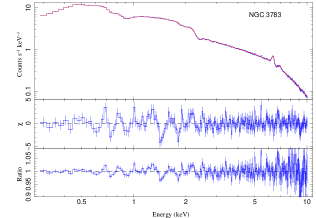
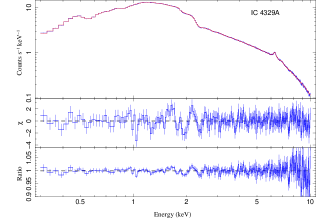
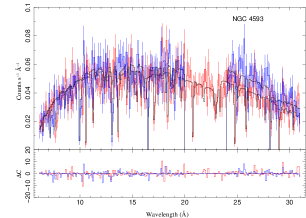
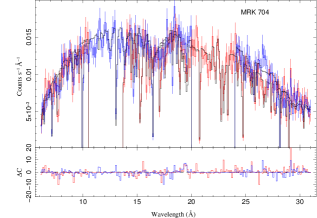
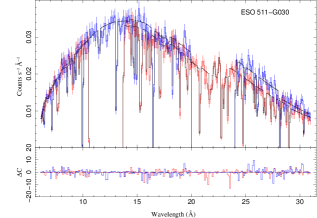
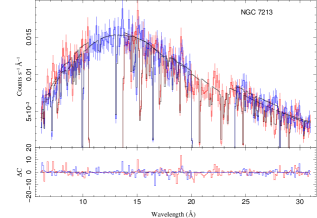
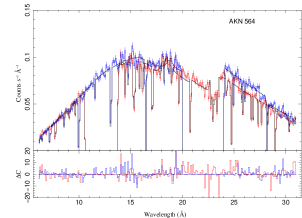
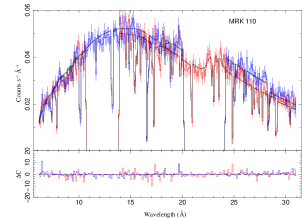
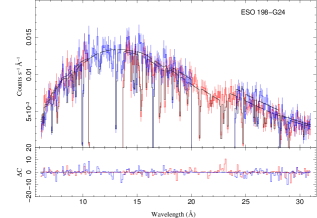
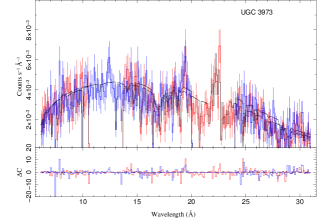
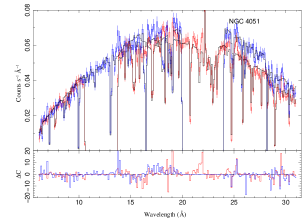
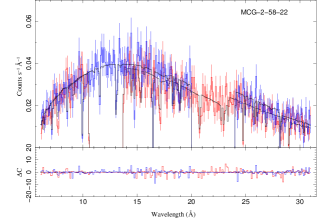
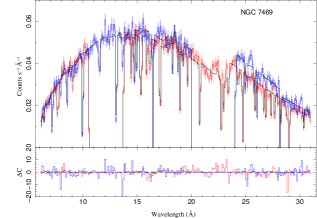
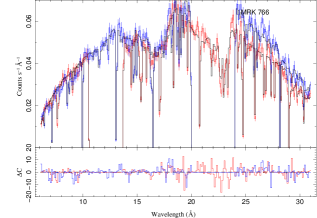
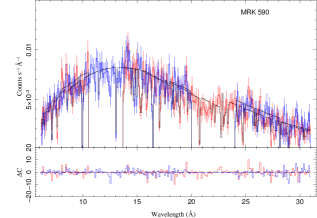
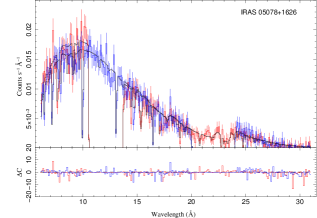
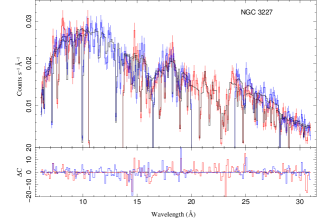
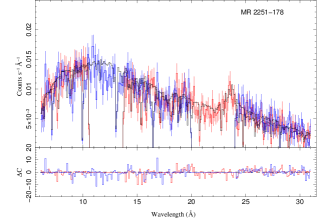
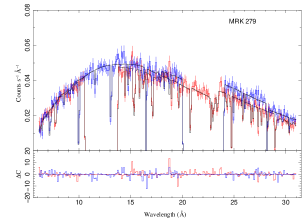
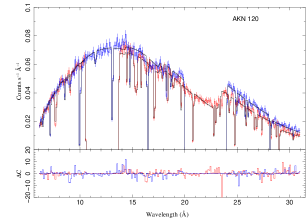
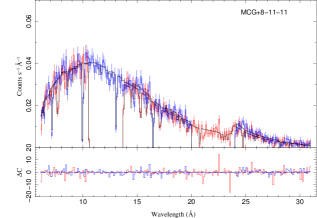
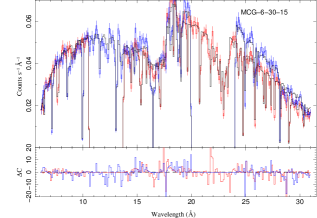
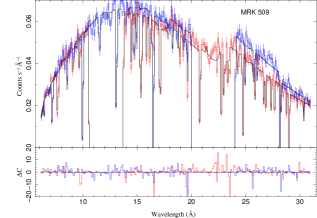
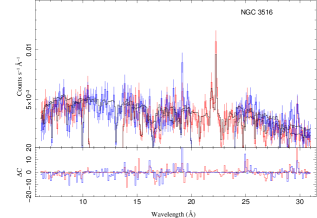
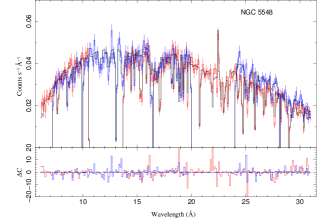
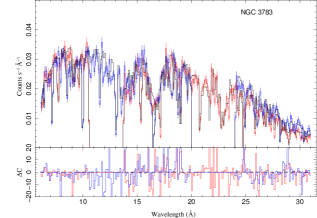
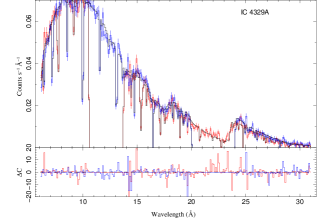
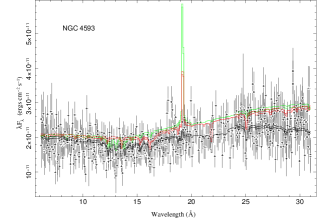
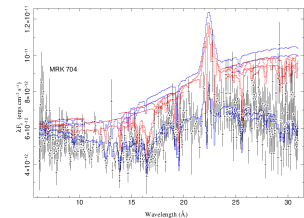
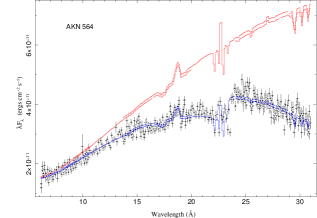
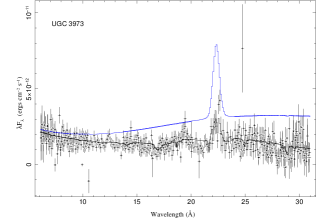
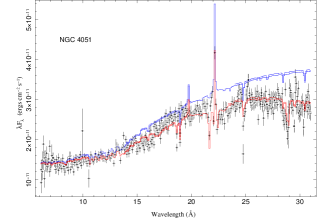
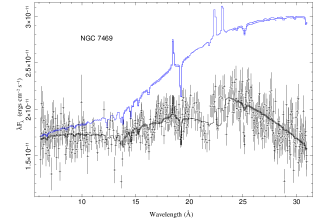
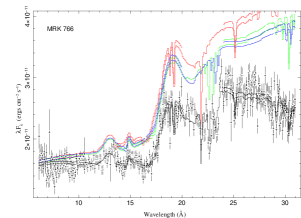
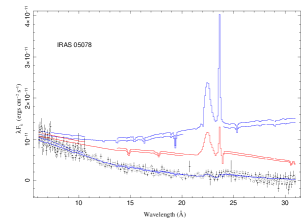
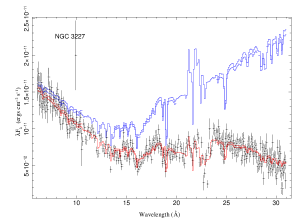
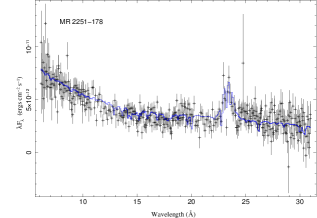
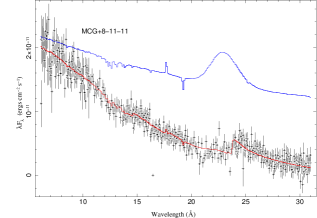
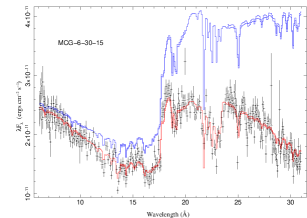
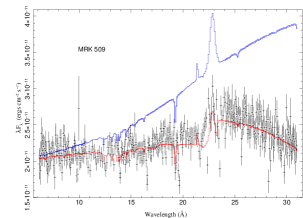
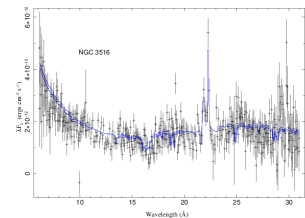
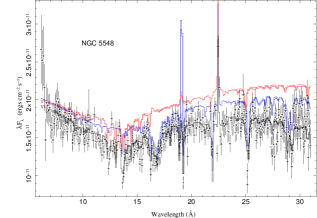
We show in this Section: a) the SED of the WAX sample (cf. § 5.1) in Figs. 8 to 10; b) the EPIC-pn spectra (upper panels) and the residuals in units of data/model ratio (lower panels) in Figs. 11 to 12; c) the RGS spectra (upper panels) and the residuals in units of contribution to the Cash statistics (lower panels) in Figs. 14 to 15; d) the best-fit WA components superposed to the RGS spectra in Figs. 16 to 17


Appendix B Effects of turbulent velocity on WA parameters.
The micro-turbulent velocity is an important parameter of the WA clouds. The thermal motions of the electrons as well as contributions from other broadening effects yield a turbulent velocity of the cloud. Typically, in most studies the turbulent velocity is fixed to , as the limited data statistics do not allow us to constrain the intrinsic width of the absorption lines. However, in some cases with enough SNR, individual line widths have yielded constraints on the turbulent velocity typically to the range (Sako et al., 2001; Lee et al., 2013). The turbulent velocity sometimes affects the column density measurements of the WA.
Lee et al. (2013) in their study of a bright Seyfert galaxy IRAS 13349+2438 using high resolution Chandra data found that the turbulent velocities measured for different ionic species were different. However, they did not find any statistical difference in their measured values of ionic column densities when the turbulent velocity was frozen to compared to that when it was left free to vary during the fit. We have carried out an exercise to verify how changes in turbulent velocity affect the measured ionisation parameter and the column density. We have considered three sources (AKN 564, NGC 5548, MCG-6-30-15) from the WAX sample for the purpose, which have one, two and three WA components respectively, and also sufficient SNR. Our intention was also to check whether the turbulent velocities affect multi-component WAs similarly as they affect a single WA component. We created WA table models with the respective SEDs as enumerated in Section 5. While creating each of the models we froze the turbulent velocities to , , and . With these WA models we fitted the EPIC-pn and RGS datasets simultaneously as enumerated in Section 6. Table 12 shows that for all cases the column densities are consistent within errors. However, the best fit statistic is different mostly for the case of MCG-6-30-15. For MCG-6-30-15 the statistic becomes worse gradually as the turbulent velocity is increased which means that the data prefer a lower turbulent velocity. As the column density and the ionisation parameter remain unchanged with velocity, a turbulent velocity of is a reasonable assumption for the sample study.
| Source | WA component | WA parameters | ||||
|---|---|---|---|---|---|---|
| AKN 564 | WA-1 | |||||
| C/dof | ||||||
| NGC 5548 | WA-1 | |||||
| WA-2 | ||||||
| C/dof | ||||||
| MGC-6-30-15 | WA-1 | |||||
| WA-2 | ||||||
| WA-3 | ||||||
| C/dof |
The three sources were chosen so that they have one, two and three components of WA respectively.
Appendix C Multiple observations of the WAX sources
Most of the sources in the WAX sample have multiple observations at various epochs with different exposure times. To characterise the spectral properties of the sources better, one should use as many datasets as possible in the analysis. However, combining the datasets corresponding to different X-ray spectra may hamper the detection of weak warm absorber features, because in principle a) the underlying continuum cannot any longer be described by the phenomenological model adopted in this paper, b) different WA states may mix, confusing the interpretation of the results111 This applies also for the variability during an observation. We believe that this effect does not have a major impact on the global WA properties mentioned in the paper. A discussion of the inter-observation WA variability is deferred to a future paper..
Most of the AGN in the WAX sample have exhibited spectral variability as shown in Figures 18 and hence cannot be added. The criterion used to determine whether a source has varied between the observations is as follows: we have simultaneously fitted the EPIC-pn datasets of all the observations of a given source, in the energy band with a powerlaw and relative-normalisations between the datasets which are free to vary. The relative-normalisation takes into account the flux variability, if any, between the observations. If the datasets have different spectral shapes (powerlaw slope or soft-excess shape) a common will not be able to describe them which will lead to deviations between the datasets in the residual plots (see Fig. 18). We consider a source to exhibit spectral variability whenever we find the deviations in the data to model ratios between the datasets is . Figure 19 show that the sources AKN 564, MRK 279, MRK 509, NGC 7469, and MR 2251-178 have at least two observations where the data have not shown spectral variability.
For each source exhibiting spectral variability, we have decided to use the EPIC and RGS spectra extracted from the longest observation, so as not to introduce any bias associated with the source flux or spectral state. Each source is therefore associated with a unique set of warm absorber components in the discussion of the global properties of the warm absorber present in the paper.
For the five sources mentioned above, which do not show spectral variability, we have combined the non-varied datasets. Table 13 shows the datasets which have been combined for the five sources. It should be noted that AKN 564 and MR 2251-178 have also been observed in 2011, i.e after the WAX sample was finalised. The EPIC-pn datasets of these sources are combined using the commands addascaspec and the RGS datasets are combined using rgscombine and are simultaneously fitted as enumerated in Section 6. Table 14 shows the best fit WA parameters of these five sources for the two cases: First, the longest observation case, and second, the new combined datasets. We see that the best fit WA parameters are significantly different in the two cases. However, our aim is to find out whether the newly derived parameters alter our global conclusions inferred from the correlation results derived in Section 7.3 and Fig. 5. Table 15 and 16 show that that the correlation and linear regression results are similar to those obtained earlier in Tables 9 and 10. Our global inferences are therefore not affected by our choice of the datasets of these five non-varied sources. So we have considered the present (longest) datasets of the sources as a representative sample (statistical realisation) of the parent population of the datasets of the sources in our sample.
| Number | Source | observation id | observation date | Total exposure | Combined exposure |
|---|---|---|---|---|---|
| (dd/mm/yyyy) | in ks | in ks | |||
| 1 | AKN 564 | 0670130201 | 24-05-2011 | 60 | 366 |
| 0670130501 | 11-06-2011 | 67 | |||
| 0670130601 | 17-06-2011 | 61 | |||
| 0670130701 | 25-06-2011 | 64 | |||
| 0670130801 | 29-06-2011 | 58 | |||
| 0670130901 | 01-07-2011 | 56 | |||
| 2 | MR 2251-178 | 0670120201 | 11-11-2011 | 133 | 394 |
| 0670120301 | 13-11-2011 | 128 | |||
| 0670120401 | 15-11-2011 | 133 | |||
| 3 | NGC 7469 | 0112170301 | 26-12-2000 | 25 | 110 |
| 0207090101 | 30-11-2004 | 85 | |||
| 4 | MRK 279 | 0302480401 | 15-11-2005 | 60 | 98 |
| 0302480601 | 19-11-2005 | 38 | |||
| 5 | MRK 509 | 0601390701 | 07-06-2009 | 63 | 240 |
| 0601390801 | 10-11-2009 | 61 | |||
| 0601390401 | 23-10-2009 | 61 | |||
| 0601391001 | 18-11-2009 | 66 |
For the three sources AKN 564, MR 2251-178 and MRK 509 the observations quoted above are near simultaneous and hence added together. For the first two cases, the datasets were not available publicly when the WAX project had started.
| Number | Source | WA component | WA parameters | Longest observation | Combined datasets |
|---|---|---|---|---|---|
| 1 | AKN 564 | WA-1 | |||
| 2 | NGC 7469 | WA-1 | |||
| 3 | MR 2251-178 | WA-1 | |||
| WA-2 | |||||
| 4 | MRK 279 | WA-1 | — | — | |
| — | — | ||||
| — | — | ||||
| 5 | MRK 509 | WA-1 | |||
| Quantity | WA- | WA- | WA-velocity |
|---|---|---|---|
| WA- | 1 | (0.62,) | (0.33,) |
| WA- | (0.62,) | 1 | (0.36,) |
| WA-velocity | (0.33,) | (0.36,) | 1 |
| Dev | Dev | ||||||
|---|---|---|---|---|---|---|---|
stands for the Spearman rank correlation coefficient.
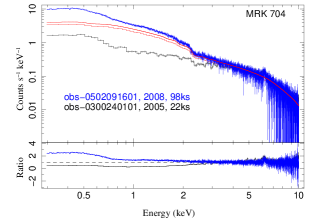
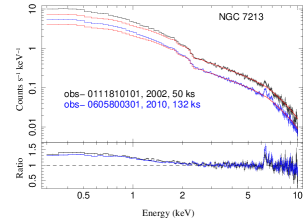
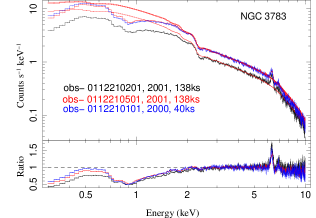
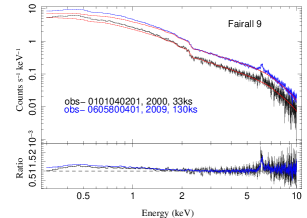
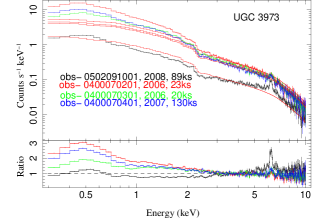
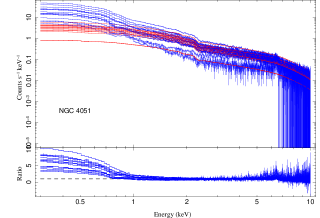
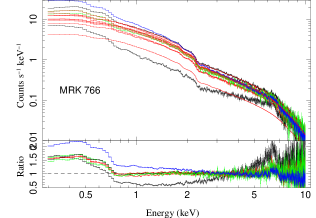
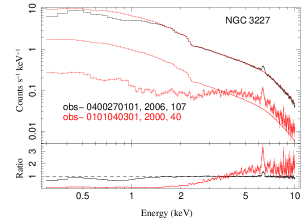
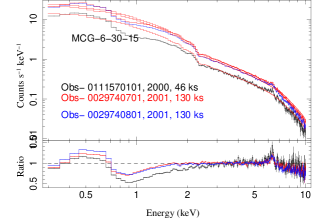
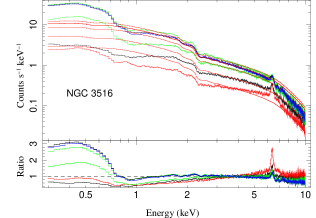
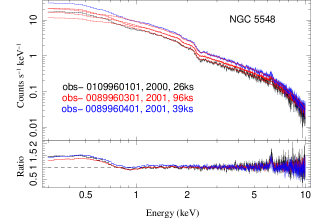
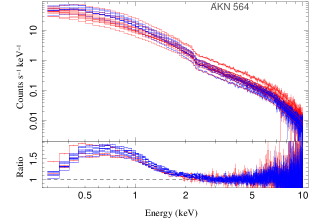
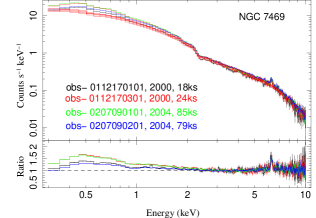
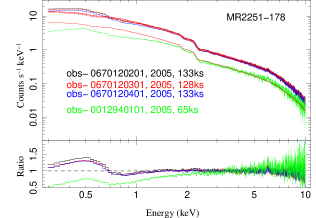
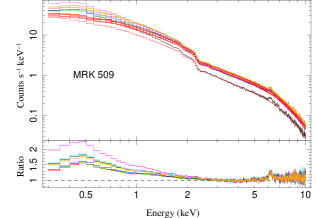
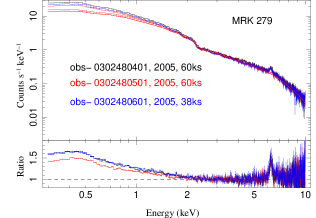
Appendix D Comparison with previous studies
Our spectral results are in general agreement with the previous studies as far as the broadband continuum as well as the WA properties are concerned. Below we list individually each source wherever we find any differences in the measured properties of soft X-ray spectra and the WA compared to our studies.
-
•
NGC 4593- Steenbrugge et al. (2003) mentioned that the ionisation state is hard to constrain using the RGS dataset for this source. They have found a large spread in the ionisation parameter using the slab model in XSTAR. In our analysis we could detect two discrete components of WA.
-
•
Mrk 704- Laha et al. (2011) have found two discrete WA components with and . Both these ionisation states and the ouflow velocities are comparable with our detections. In our analysis we detect an additional component of WA with . Laha et al. (2011) had detected a partially covering neutral absorber.
-
•
AKN 564- This source was stuided by Smith et al. (2008). All the four datasets from 2001 and one from 2005 (100 ks) were combined to obtain the final RGS spectrum. We have used only 2005 (100 ks) data set. They detected 5 emission lines and 3 WA components. , , and , , and , . We however detect only one WA component.
-
•
NGC 4051- This same dataset has been studied multiple times (Krongold et al., 2008; Ponti et al., 2006; Ogle et al., 2004). Ponti et al. (2006) find that the ions cover nearly 4 decades of ionisation parameter. They also find relativistic O 8 emission lines. We detect two discrete WA components of ionisation parameters and .
-
•
NGC 7469 - Blustin et al. (2003) have combined two datasets to obtain a total of exposure. They found a continuous distribution of WA ionisation parameter with . We detect a single WA component of ionisation parameter of .
-
•
MRK 766- Studied by Mason et al. (2003). They found WA with a large range in as well as broad relativistic emission lines in the soft X-rays at , , and . We have detected similar emission lines in the soft X-rays. We detect WA primarily in low ionisation states from .
-
•
IRAS05078+1626- Svoboda et al. (2010) found a single component of WA with an ionisation parameter of , and . We found two components of WA and the highest column density is that of .
-
•
NGC 3227- This is a Seyfert 1.5 galaxy and have been studied by Markowitz et al. (2009). The and the intrinsic neutral absorption column is . There are two WA components. , , and , . We also detect a similar neutral absorption column but we find three discrete WA components.
-
•
MR2251-178 -This same dataset had been studied by Kaspi et al. (2004). However they have combined it with other datasets. The . They detected two warm absorber components , , and , . Note that they have used Tartar’s definition of ionisation parameter (represented by U) and there is no direct conversion until we know the appropriate SED. We also detected two WA components.
-
•
MRK 279-Costantini et al. (2010) studied the same dataset () but they have combined 3 other datasets to make . Very poor quality of the RGS dataset. They found two WA. , , and , . We have not detected any WA in this source and have found strict upper and lower limits on column density and ionisation parameters.
-
•
MCG+8-11-11 - This source have been studied by Matt et al. (2006). The slope . The single component warm absorber . There is an absorption edge in soft-Xrays with . We too detect one WA component but with a much higher ionisation parameter.
-
•
MRK 509 - Smith et al. (2007) have studied this dataset and found three WA components, with , , and . The slope . We detected two WA components.
-
•
NGC 3516 - Turner et al. (2003) detected large range of ionisation states for WA in this source. We detected just one WA component.
-
•
NGC 3783 -Behar et al. (2003) studied the same dataset as ours but also added another dataset taken almost simultaneously. The slope and the WA . We detected two WA components.
-
•
IC 4329A - Steenbrugge et al. (2005) studied the same dataset. The source is heavily absorbed. The slope . There are four components of WA, , , , and . We detected three WA components, which are nearly similar to these.
The authors are grateful to the anonymous referee for insightful comments which improved the quality of the paper. Author SL is grateful to Ehud Behar, Gerard Kriss, Smita Mathur, Gary Ferland and Ryan Porter for insightful discussion on various aspects of this paper. Author SL is grateful to the ESAC faculty of the European Space Agency for its grants to allow him to visit ESAC for collaboration work. MG acknowledges financial support from the IUCAA (Pune). Author SL is grateful to CSIR, Government of India for supporting this work. SC wants to acknowledge the use of facilities at Harvard University, Cambridge, MA, USA and Max Planck Institute for Radio Astronomy, Bonn, Germany. This research has made use of the NASA/IPAC Extragalactic Database (NED) which is operated by the Jet Propulsion Laboratory, California Institute of Technology, under contract with the National Aeronautics and Space Administration.
References
- Akritas & Bershady (1996) Akritas M. G., Bershady M. A., 1996, ApJ, 470, 706
- Begelman & McKee (1983) Begelman M. C., McKee C. F., 1983, ApJ, 271, 89
- Begelman et al. (1983) Begelman M. C., McKee C. F., Shields G. A., 1983, ApJ, 271, 70
- Behar (2009) Behar E., 2009, ApJ, 703, 1346
- Behar et al. (2003) Behar E., Rasmussen A. P., Blustin A. J., Sako M., Kahn S. M., Kaastra J. S., Branduardi-Raymont G., Steenbrugge K. C., 2003, ApJ, 598, 232
- Bianchi et al. (2009) Bianchi S., Guainazzi M., Matt G., Fonseca Bonilla N., Ponti G., 2009, A&A, 495, 421
- Blandford & Payne (1982) Blandford R. D., Payne D. G., 1982, MNRAS, 199, 883
- Blustin et al. (2003) Blustin A. J., Branduardi-Raymont G., Behar E., Kaastra J. S., Kriss G. A., Page M. J., Kahn S. M., Sako M., Steenbrugge K. C., 2003, A&A, 403, 481
- Blustin et al. (2005) Blustin A. J., Page M. J., Fuerst S. V., Branduardi-Raymont G., Ashton C. E., 2005, A&A, 431, 111
- Braito et al. (2007) Braito V., Reeves J. N., Dewangan G. C., George I., Griffiths R. E., Markowitz A., Nandra K., Porquet D., Ptak A., Turner T. J., Yaqoob T., Weaver K., 2007, ApJ, 670, 978
- Calderone et al. (2013) Calderone G., Ghisellini G., Colpi M., Dotti M., 2013, MNRAS, 431, 210
- Cash (1979) Cash W., 1979, ApJ, 228, 939
- Costantini et al. (2010) Costantini E., Kaastra J. S., Korista K., Ebrero J., Arav N., Kriss G., Steenbrugge K. C., 2010, A&A, 512, A25
- Crenshaw & Kraemer (2012) Crenshaw D. M., Kraemer S. B., 2012, ApJ, 753, 75
- Crummy et al. (2006) Crummy J., Fabian A. C., Gallo L., Ross R. R., 2006, MNRAS, 365, 1067
- Dadina & Cappi (2004) Dadina M., Cappi M., 2004, A&A, 413, 921
- Dasgupta et al. (2005) Dasgupta S., Rao A. R., Dewangan G. C., Agrawal V. K., 2005, ApJ, 618, L87
- de La Calle Pérez et al. (2010) de La Calle Pérez I., Longinotti A. L., Guainazzi M., Bianchi S., Dovčiak M., Cappi M., Matt G., Miniutti G., Petrucci P. O., Piconcelli E., Ponti G., Porquet D., Santos-Lleó M., 2010, A&A, 524, A50
- Den Herder et al. (2001) Den Herder J. W., Brinkman A. C., Kahn S. M., Branduardi-Raymont G., Thomsen 2001, A&A, 365, L7
- Dewangan et al. (2007) Dewangan G. C., Griffiths R. E., Dasgupta S., Rao A. R., 2007, ApJ, 671, 1284
- Elvis et al. (1994) Elvis M., Wilkes B. J., McDowell J. C., Green R. F., Bechtold J., Willner S. P., Oey M. S., Polomski E., Cutri R., 1994, ApJS, 95, 1
- Everett & Ballantyne (2004) Everett J. E., Ballantyne D. R., 2004, ApJ, 615, L13
- Fabian et al. (1989) Fabian A. C., Rees M. J., Stella L., White N. E., 1989, MNRAS, 238, 729
- Ferland et al. (1998) Ferland G. J., Korista K. T., Verner D. A., Ferguson J. W., Kingdon J. B., Verner E. M., 1998, PASP, 110, 761
- Fitzpatrick (1999) Fitzpatrick E. L., 1999, PASP, 111, 63
- Fukumura et al. (2010) Fukumura K., Kazanas D., Contopoulos I., Behar E., 2010, ApJ, 715, 636
- Gallo et al. (2011) Gallo L. C., Miniutti G., Miller J. M., Brenneman L. W., Fabian A. C., Guainazzi M., Reynolds C. S., 2011, MNRAS, 411, 607
- George & Fabian (1991) George I. M., Fabian A. C., 1991, MNRAS, 249, 352
- George et al. (1998) George I. M., Turner T. J., Netzer H., Nandra K., Mushotzky R. F., Yaqoob T., 1998, ApJS, 114, 73
- Gierliński & Done (2004) Gierliński M., Done C., 2004, MNRAS, 349, L7
- Grevesse & Sauval (1998) Grevesse N., Sauval A. J., 1998, SSRv, 85, 161
- Haardt & Maraschi (1991) Haardt F., Maraschi L., 1991, ApJ, 380, L51
- Halpern (1984) Halpern J. P., 1984, ApJ, 281, 90
- Holczer et al. (2007) Holczer T., Behar E., Kaspi S., 2007, ApJ, 663, 799
- Houck & Denicola (2000) Houck J. C., Denicola L. A., 2000, in Manset N., Veillet C., Crabtree D., eds, Astronomical Data Analysis Software and Systems IX Vol. 216 of Astronomical Society of the Pacific Conference Series, ISIS: An Interactive Spectral Interpretation System for High Resolution X-Ray Spectroscopy. p. 591
- Jansen et al. (2001) Jansen F., Lumb D., Altieri B., Clavel J., Ehle M., Erd C., Gabriel C., Guainazzi M., Gondoin P., Much R., Munoz R., Santos M., Schartel N., Texier D., Vacanti G., 2001, A&A, 365, L1
- Kaastra et al. (2000) Kaastra J. S., Mewe R., Liedahl D. A., Komossa S., Brinkman A. C., 2000, A&A, 354, L83
- Kallman et al. (2004) Kallman T. R., Palmeri P., Bautista M. A., Mendoza C., Krolik J. H., 2004, ApJS, 155, 675
- Kaspi et al. (2000) Kaspi S., Brandt W. N., Netzer H., Sambruna R., Chartas G., Garmire G. P., Nousek J. A., 2000, ApJ, 535, L17
- Kaspi et al. (2004) Kaspi S., Netzer H., Chelouche D., George I. M., Nandra K., Turner T. J., 2004, ApJ, 611, 68
- Kazanas et al. (2012) Kazanas D., Fukumura K., Behar E., Contopoulos I., 2012, in Chartas G., Hamann F., Leighly K. M., eds, AGN Winds in Charleston Vol. 460 of Astronomical Society of the Pacific Conference Series, X-ray Absorbers, MHD Winds, and AGN Unification. p. 181
- King (2010) King A. R., 2010, MNRAS, 402, 1516
- King & Pounds (2003) King A. R., Pounds K. A., 2003, MNRAS, 345, 657
- Krolik & Kriss (2001) Krolik J. H., Kriss G. A., 2001, ApJ, 561, 684
- Krongold et al. (2003) Krongold Y., Nicastro F., Brickhouse N. S., Elvis M., Liedahl D. A., Mathur S., 2003, ApJ, 597, 832
- Krongold et al. (2008) Krongold Y., Nicastro F., Elvis M., Brickhouse N., Jiménez-Bailón E., Binette L., Mathur S., 2008, in Revista Mexicana de Astronomia y Astrofisica Conference Series Vol. 32 of Revista Mexicana de Astronomia y Astrofisica, vol. 27, Can Ionized Outflows in AGN Produce Important Feedback Effects? The Case of NGC 4051. pp 123–127
- Krongold et al. (2005) Krongold Y., Nicastro F., Elvis M., Brickhouse N. S., Mathur S., Zezas A., 2005, ApJ, 620, 165
- Laha et al. (2013) Laha S., Dewangan G. C., Chakravorty S., Kembhavi A. K., 2013, ApJ, 777, 2
- Laha et al. (2011) Laha S., Dewangan G. C., Kembhavi A. K., 2011, ApJ, 734, 75
- Lampton et al. (1976) Lampton M., Margon B., Bowyer S., 1976, ApJ, 208, 177
- Laor (1991) Laor A., 1991, ApJ, 376, 90
- Lee et al. (2013) Lee J. C., Kriss G. A., Chakravorty S., Rahoui F., Young A. J., Brandt W. N., Hines D. C., Ogle P. M., Reynolds C. S., 2013, MNRAS, 430, 2650
- Longinotti et al. (2009) Longinotti A. L., Bianchi S., Ballo L., de La Calle I., Guainazzi M., 2009, MNRAS, 394, L1
- Longinotti et al. (2013) Longinotti A. L., Krongold Y., Kriss G. A., Ely J., Gallo L., Grupe D., Komossa S., Mathur S., Pradhan A., 2013, ApJ, 766, 104
- Magdziarz & Zdziarski (1995) Magdziarz P., Zdziarski A. A., 1995, MNRAS, 273, 837
- Markowitz et al. (2009) Markowitz A., Reeves J. N., George I. M., Braito V., Smith R., Vaughan S., Arévalo P., Tombesi F., 2009, ApJ, 691, 922
- Mason et al. (2003) Mason K. O., Branduardi-Raymont G., Ogle P. M., Page M. J., Puchnarewicz E. M., Behar E., Córdova F. A., Davis S., Maraschi L., McHardy I. M., O’Brien P. T., Priedhorsky W. C., Sasseen T. P., 2003, ApJ, 582, 95
- Mason et al. (2001) Mason K. O., Breeveld A., Much R., Carter M., Cordova F. A., Cropper M. S., Fordham J., Huckle H., Ho C., Kawakami H., Kennea J., Kennedy T., Mittaz J., Pandel D., Priedhorsky W. C., Sasseen T., Shirey R., Smith P., Vreux J.-M., 2001, A&A, 365, L36
- Mathur et al. (1995) Mathur S., Elvis M., Wilkes B., 1995, in Bulletin of the American Astronomical Society Vol. 27 of Bulletin of the American Astronomical Society, Associated Absorption in X-rays. pp 875–+
- Matt et al. (2006) Matt G., Bianchi S., de Rosa A., Grandi P., Perola G. C., 2006, A&A, 445, 451
- Matt et al. (1991) Matt G., Perola G. C., Piro L., 1991, A&A, 247, 25
- McKernan et al. (2007) McKernan B., Yaqoob T., Reynolds C. S., 2007, MNRAS, 379, 1359
- Murphy & Yaqoob (2009) Murphy K. D., Yaqoob T., 2009, MNRAS, 397, 1549
- Nandra et al. (2007) Nandra K., O’Neill P. M., George I. M., Reeves J. N., 2007, MNRAS, 382, 194
- Nandra et al. (2006) Nandra K., O’Neill P. M., George I. M., Reeves J. N., Turner T. J., 2006, Astronomische Nachrichten, 327, 1039
- Nandra & Pounds (1994) Nandra K., Pounds K. A., 1994, MNRAS, 268, 405
- Netzer (2006) Netzer H., 2006, ApJ, 652, L117
- Nicastro et al. (1999) Nicastro F., Fiore F., Matt G., 1999, ApJ, 517, 108
- Ogle et al. (2004) Ogle P. M., Mason K. O., Page M. J., Salvi N. J., Cordova F. A., McHardy I. M., Priedhorsky W. C., 2004, ApJ, 606, 151
- Panessa et al. (2007) Panessa F., Barcons X., Bassani L., Cappi M., Carrera F. J., Ho L. C., Pellegrini S., 2007, A&A, 467, 519
- Piconcelli et al. (2005) Piconcelli E., Jimenez-Bailón E., Guainazzi M., Schartel N., Rodríguez-Pascual P. M., Santos-Lleó M., 2005, A&A, 432, 15
- Ponti et al. (2013) Ponti G., Cappi M., Costantini E., Bianchi S., Kaastra J. S., De Marco B., Fender R. P., 2013, A&A, 549, A72
- Ponti et al. (2006) Ponti G., Miniutti G., Cappi M., Maraschi L., Fabian A. C., Iwasawa K., 2006, MNRAS, 368, 903
- Porquet et al. (2004) Porquet D., Reeves J. N., O’Brien P., Brinkmann W., 2004, A&A, 422, 85
- Porter et al. (2006) Porter R. L., Ferland G. J., Kraemer S. B., Armentrout B. K., Arnaud K. A., Turner T. J., 2006, PASP, 118, 920
- Proga & Kallman (2004) Proga D., Kallman T. R., 2004, ApJ, 616, 688
- Reeves et al. (2003) Reeves J. N., O’Brien P. T., Ward M. J., 2003, ApJ, 593, L65
- Revnivtsev et al. (2004) Revnivtsev M., Sazonov S., Jahoda K., Gilfanov M., 2004, A&A, 418, 927
- Reynolds (1997) Reynolds C. S., 1997, MNRAS, 286, 513
- Risaliti & Elvis (2004) Risaliti G., Elvis M., 2004, in Barger A. J., ed., Supermassive Black Holes in the Distant Universe Vol. 308 of Astrophysics and Space Science Library, A Panchromatic View of AGN. p. 187
- Rybicki & Lightman (1979) Rybicki G. B., Lightman A. P., 1979, Radiative processes in astrophysics
- Sako et al. (2001) Sako M., Kahn S. M., Behar E., Kaastra J. S., Brinkman A. C., Boller T., Puchnarewicz E. M., Starling R., Liedahl D. A., Clavel J., Santos-Lleo M., 2001, A&A, 365, L168
- Sanders et al. (1989) Sanders D. B., Phinney E. S., Neugebauer G., Soifer B. T., Matthews K., 1989, ApJ, 347, 29
- Schmitt (1985) Schmitt J. H. M. M., 1985, ApJ, 293, 178
- Schurch & Done (2006) Schurch N. J., Done C., 2006, MNRAS, 371, 81
- Shakura & Sunyaev (1973) Shakura N. I., Sunyaev R. A., 1973, A&A, 24, 337
- Smith et al. (2007) Smith R. A. N., Page M. J., Branduardi-Raymont G., 2007, A&A, 461, 135
- Smith et al. (2008) Smith R. A. N., Page M. J., Branduardi-Raymont G., 2008, A&A, 490, 103
- Steenbrugge et al. (2003) Steenbrugge K. C., Kaastra J. S., Blustin A. J., Branduardi-Raymont G., Sako M., Behar E., Kahn S. M., Paerels F. B. S., Walter R., 2003, A&A, 408, 921
- Steenbrugge et al. (2005) Steenbrugge K. C., Kaastra J. S., Sako M., Branduardi-Raymont G., Behar E., Paerels F. B. S., Blustin A. J., Kahn S. M., 2005, A&A, 432, 453
- Strüder et al. (2001) Strüder L., Briel U., Dennerl K., Hartmann R., Kendziorra E., 2001, A&A, 365, L18
- Svoboda et al. (2010) Svoboda J., Guainazzi M., Karas V., 2010, A&A, 512, A62
- Tananbaum et al. (1979) Tananbaum H., Avni Y., Branduardi G., Elvis M., Fabbiano G., Feigelson E., Giacconi R., Henry J. P., Pye J. P., Soltan A., Zamorani G., 1979, ApJ, 234, L9
- Titarchuk (1994) Titarchuk L., 1994, ApJ, 434, 570
- Tombesi et al. (2013) Tombesi F., Cappi M., Reeves J. N., Nemmen R. S., Braito V., Gaspari M., Reynolds C. S., 2013, MNRAS, 430, 1102
- Tombesi et al. (2010) Tombesi F., Cappi M., Reeves J. N., Palumbo G. G. C., Yaqoob T., Braito V., Dadina M., 2010, A&A, 521, A57
- Turner et al. (2001) Turner M. J. L., Abbey A., Arnaud M., Balasini M., Barbera M., Belsole E., Bennie P. J., Bernard J. P., 2001, A&A, 365, L27
- Turner et al. (2003) Turner T. J., Kraemer S. B., Mushotzky R. F., George I. M., Gabel J. R., 2003, ApJ, 594, 128
- Turner & Miller (2009) Turner T. J., Miller L., 2009, AAPR, 17, 47
- Vasudevan & Fabian (2007) Vasudevan R. V., Fabian A. C., 2007, MNRAS, 381, 1235
- Vaughan et al. (2004) Vaughan S., Fabian A. C., Ballantyne D. R., De Rosa A., Piro L., Matt G., 2004, MNRAS, 351, 193
- Winter et al. (2012) Winter L. M., Veilleux S., McKernan B., Kallman T. R., 2012, ApJ, 745, 107
- Yaqoob & Padmanabhan (2004) Yaqoob T., Padmanabhan U., 2004, ApJ, 604, 63