A semi-analytic model comparison: testing cooling models against hydrodynamical simulations
Abstract
We compare predictions of cooled masses and cooling rates from three stripped-down Semi-Analytic Models (SAMs) of galaxy formation with the results of N-body+SPH simulations with gas particle mass of , where radiative cooling of a gas of primordial composition is implemented. We also run a simulation where cooling is switched on at redshift 2, in order to test cooling models in a regime in which their approximations are expected to be valid. We confirm that cooling models implemented in SAMs are able to predict the amount of cooled mass at to within 20 per cent. However, some relevant discrepancies are found. (i) When the contribution from poorly resolved halos is subtracted out, SAMs tend to under-predict by 30 per cent the mass that cools in the infall-dominated regime. (ii) At large halo masses SAMs tend to over-predict cooling rates, though the numerical result may be affected by the use of SPH. (iii) As found in our previous work, cooling rates are found to be significantly affected by model details: simulations disfavour models with large cores and with quenching of cooling at major mergers. (iv) When cooling is switched on at , cold gas accumulates very quickly in the simulated halos. This accumulation is reproduced by SAMs with varying degrees of accuracy.
keywords:
galaxies: evolution – galaxies: formation – galaxies: cooling flows1 Introduction
The formation of galaxies within the CDM cosmological model involves a large number of physical processes, many of which are still poorly understood. The hierarchical build-up of DM halos, resulting from the non-linear evolution of primordial perturbations under their own gravity, provides the backbone of the whole process of galaxy formation. Thanks to advances in N-body techniques and to the very accurate constraints available on cosmological parameters (e.g., Planck Collaboration et al., 2013), the evolution and properties of DM halos can be computed with very good accuracy (e.g. Reed et al., 2013). Despite baryonic processes are known to affect the build-up of DM halos to some extent (e.g. Stanek et al., 2009; Duffy et al., 2010; Saro et al., 2010; Cui et al., 2012), the modeling of baryonic physics still provides the major source of uncertainty. A purely collisionless simulation thus remains a good starting point for a galaxy formation model.
Galaxy formation in the cosmological context has been historically addressed with two main tools. SAMs are applied to the backbone of DM halo merger trees, taken from an N-body simulation or equivalent tools (e.g. Monaco et al., 2013). They use a set of simplified or phenomenological models to describe the various processes that involve baryons. Hydrodynamic simulations consist of numerically solving the equations of motion of DM and gas particles in a realization of a cosmological volume. Two fundamental processes take place on scales that are within reach of presently available simulations. Gravity and hydrodynamic forces are responsible for infalling of gas and heating to the halo virial temperature. Radiative cooling down to K, which is computed based on the density and temperature of the heated gas, is responsible for the condensation of gas into the inner regions of the halo. There, the gas can fragment into stars and thus form a galaxy, but star formation and all the processes triggered by it (stellar feedback, chemical evolution, galaxy winds, black hole seeds), not to mention the accretion of gas onto black holes, take place at much smaller scales. To properly follow these processes, the range of scales that must be resolved (from sub-pc scale of star formation to cosmological scales) is so vast and the involved physics so complex that their effects need to be treated through simplified, sub-resolution models.
The modeling of cooling in SAMs is based on the assumption that the gas settles into a hot atmosphere in hydrostatic equilibrium within the potential well of the DM halo. This allows the computation of a cooling time as a function of radius. Whenever the central cooling time is longer than the halo dynamical time (“cooling-dominated regime”; Rees & Ostriker, 1977; Binney, 1977; White & Frenk, 1991), the deposition of cold gas into the central galaxy is assumed to be regulated by cooling; otherwise, the timescale for gas to condense into the galaxy is assumed to be of the order of the halo dynamical time (“infall-dominated regime”). Using hydrodynamical simulations that included radiative cooling and star formation (but no efficient stellar feedback), Kereš et al. (2005) reported that at , or at any redshift for halos smaller than M⊙ (see also Dekel & Birnboim, 2006), gas tends not to shock to the virial temperature but to condense directly into the galaxy via a cold flow. As a caveat, the deposition of gas through cold flows is known to depend on the hydrodynamic scheme (Nelson et al., 2013) and to be affected by feedback processes connected to galaxy formation (Benson & Bower, 2011; Murante et al., 2012).
To check to what level the two techniques, SAMs and hydrodynamical simulations, give a consistent description of the deposition of cold mass into the “galaxies”, many authors (Benson et al., 2001; Yoshida et al., 2002; Helly et al., 2003; Cattaneo et al., 2007; Viola et al., 2008; Saro et al., 2010; Lu et al., 2011; Hirschmann et al., 2012) performed comparisons of the predictions of SAMs and simulations. All of these papers presented comparisons performed using stripped-down SAMs, where all processes beyond gas cooling were switched off and simulations where either no star formation or no (effective) feedback from star formation was present. The first papers (Benson et al., 2001; Yoshida et al., 2002; Helly et al., 2003; Cattaneo et al., 2007) compared one SAM with simulations and reported that SAMs are able to reproduce the gas mass that cools in DM halos to a level, to cite Benson et al. (2001), “better than a pessimist might have expected”. More recent papers focused on some discrepancies between the two kinds of modeling. Viola et al. (2008) simulated cooling in isolated, hydrostatic DM halos and compared the resulting cooling mass with two models: an implementation from Cole et al. (2000) and the one used in the MOdel of the Rise of Galaxies And Agn (MORGANA Monaco et al., 2007). They found that the former model underestimates the amount of cooled mass when cooling is suddenly switched on, while the latter model produced a much better fit. Saro et al. (2010) compared the galaxy populations in a massive galaxy cluster predicted by SPH simulations with those from the SAM described in De Lucia & Blaizot (2007). Both models included gas cooling and a simple prescription for star formation (as we will do in this study). The resultant object-by-object comparison revealed important differences between the two methods. In particular, the star formation history of BCGs in the SPH simulations is characterized by a more prominent high redshift peak and lower level of recent star formation with respect to predictions from the SAM. As noticed by Saro et al. (2010), this is due to the assumption of an isothermal gas density distribution for the hot gas in the SAM, which differs from the actual gas distribution in the simulation.
In De Lucia et al. (2010, hereafter Paper I) we compared the results of stripped-down versions of three independently developed SAMs, “Durham” (Cole et al., 2000; Benson et al., 2001), “Munich” (De Lucia & Blaizot, 2007; Saro et al., 2010) and Morgana (Monaco et al., 2007). We ran them on the same set of merger trees taken from the Millennium simulation (Springel et al., 2005). We concentrated on two mass scales, selecting 100 halos as massive as the Milky Way at and 100 as abundant as SCUBA galaxies at . We found that the resulting cold masses and cooling rates were in good agreement at the Milky Way mass scale, but we noticed that the “Durham” model predicted systematically lower cooling rates in halos of the SCUBA set. We showed that this difference is again due to different assumptions on the gas profile, which is isothermal in the “Munich” model and cored in the “Durham” model. A comparison of the results of the same models in a configuration where star formation and stellar feedback is active was presented in Fontanot et al. (2013).
More recently, Lu et al. (2011) compared the results of several implementations of semi-analytic cooling models with 1D simulations of both an isolated halo and an accreting halo, and with a simulation of a cosmological volume including inefficient stellar feedback. They reported that different models give predictions of gas accretion rates that can vary by up to a factor of 5. With respect to simulations, semi-analytic models under-predict gas accretion rates in small halos and over-predict them in massive halos. They also showed that the predicted cooling-dominated and infall-dominated regimes do not closely correspond to the regimes where cold flows or hot atmospheres were found to dominate in their simulation. A similar setting was used in Hirschmann et al. (2012), with the aim of comparing the predictions of simulations and SAMs when feedback and star formation are used. They used a set of resimulations of dark-matter halos (see Oser et al., 2010) run with the gadget code, but they implemented primordial cooling and inefficient stellar feedback, and compared the results with several versions of the model of Somerville et al. (2008), including a stripped-down one with no stellar feedback. This work shows that, while stripped-down SAMs and simulations agree rather well (with some discrepancies consistent with those found in the papers cited above), SAMSs predict that the deposition of cold gas takes place mostly in the cooling-dominated regime, while the contribution from simulated cold flows is significant at all redshifts and dominant at .
To perform an accurate comparison of simulations with SAMs, the SAMs should be run on merger trees extracted from the same simulation, as was done in Yoshida et al. (2002), Helly et al. (2003), Cattaneo et al. (2007), Saro et al. (2010) and Hirschmann et al. (2012) but not in Benson et al. (2001) and Lu et al. (2011). Proper time sampling of merger trees is also relevant: Benson et al. (2012) demonstrated that a SAM gives a convergent description of the formation of galaxies if merger trees are sampled at least times, a factor of two higher than, e.g., the time sampling of the Millennium simulation. Finally, the condensation of gas into the central “galaxy” is governed not only by cooling but also by the time required for progenitor halos to merge with the central object. As demonstrated in Paper I, different SAMs do not use consistent predictions of galaxy merging times, and this should be properly taken into account.
A further important issue is related to the runaway nature of cooling of self-gravitating gas. When no feedback from stars is present, gas (over-)cools in the small DM halos that form at high redshift, so cooling takes place in poorly resolved halos, and in the infall-dominated regime where the cooling models we are aiming to test do not apply. Increasing the resolution would imply resolving smaller halos at higher redshift, thus worsening the over-cooling problem. Results showing a reasonable agreement of SAMs and simulations at may simply reflect the fact that both predict that most baryons have (over-)cooled.
We are convinced that a satisfactory numerical test of semi-analytic cooling models is still missing. An ideal test should have the following characteristics: (i) the study should be limited to cooling in well resolved halos; (ii) a clear assessment of the accumulation of cold gas in the cooling-dominated regime, independent of (over-)cooling at high redshift, should be performed; (iii) the analysis should include several SAMs; (iv) SAMs should be run on merger trees extracted from the same simulation; (v) time sampling should be fine enough to guarantee convergence of SAM predictions; (vi) measured cooling rates should be independent of the accuracy with which merger times are predicted by SAMs. In this paper we present a comparison of SAMs and numerical (SPH) simulations that meets all the above criteria.
Finding a numerical solution of cooling in cosmological halos is not a straightforward task. To face this problem we use the gadget Tree-PMSPH code. The specific implementation used in this paper is shortly described in Section 2.1. While this project was in progress, Kereš et al. (2012) published a comparison of gadget with the new moving-mesh code arepo (Springel, 2010), run on the same initial conditions and with a setting similar to that of Lu et al. (2011), though at higher resolution. They reported that galaxy stellar mass functions obtained with the two hydrodynamic schemes tend to be quite similar in the low-mass end but exhibit significant differences in the high mass end. They traced the origin of this difference to the different efficiencies of dissipative heating from gas accretion onto halos, which cause cooling to be partially offset in SPH with respect to the moving–mesh hydrodynamic scheme. The issue was readdressed by Nelson et al. (2013), who showed that the strucuture of cold filaments penetrating into hot halos is very different for the two hydro solvers. While a detailed comparison of different hydrodynamical schemes is beyond the aims of this paper, we stress that some of our results might be affected by the use of SPH. We will comment on this below.
As in Paper I, we use here three stripped-down SAMs. The model of De Lucia & Blaizot (2007), denoted the Munich model in Paper I, will be called here delucia, while morgana of Monaco et al. (2007) will retain its acronym. In place of the Durham model we use the highly modular galacticus model of Benson (2012) in a configuration that closely resembles that of Bower et al. (2006). We run the three SAMs on merger trees extracted from a collisionless N-body simulation, and compare them with the results of a simulation run on the same initial conditions but including gas hydrodynamics and radiative cooling for a primordial composition. We set merger times to zero in SAMs, and compute cooled masses in simulations by summing over all substructures in simulated FoF halos. We run the hydrodynamical simulation in two configurations: we allow cooling to be active from the start, or we run the simulation without radiative cooling down to redshift , and then switch cooling on. This second configuration allows us to test cooling models exactly in the range of redshift and halo mass where their approximations are expected to be valid: when cooling is switched on, no (over-)cooling has taken place in the infall-dominated regime and all the baryons associated with halos are in hot atmospheres; the contribution of cooling from small halos (that are poorly resolved and where gas mostly cools in the infall-dominated regime) is much smaller.
We use a relatively small box (36 on a side, 50 Mpc for ) sampled with DM particles and an equal number of gas particles, and use a force resolution of 1.5 comoving . With these choices, we prioritize resolution over statistics and test for the first time cooling at a resolution that is sufficient to resolve the morphology of a galaxy when star formation and feedback are properly taken into account (e.g. Scannapieco et al., 2012). The DM halo masses we test range from small galaxies () to rich galaxy groups (). Merger trees have been sampled at 128 time-steps (uniformly in the log of scale factor; Benson et al., 2012), with the time interval between two snapshots roughly corresponding to half the dynamical time of DM halos. Moreover, following Viola et al. (2008) and Saro et al. (2010) we use a “star formation” algorithm to remove cooled gas particles from hydrodynamics, with the result of speeding up the simulation and strongly reducing numerical artifacts at the interface of cold and hot phases.
We will be mainly concerned with cooling rates and cooled masses, neglecting for the time being whether gas has cooled on the main substructure of the halo or on a satellite. Other important issues, like the density profiles of gas in cooling halos, the quantification of cooling on non-central galaxies, or the delineation between cold-flow and hot-flow modes, will be addressed in future works. This paper is organized as follows. Section 2 describes the simulations run for this project and the post-processing analysis used to obtain cooling rates and cooled masses. Section 3 presents the three SAMs used in the paper. Section 4 reports the comparison of results from simulations and SAMs. Finally, Section 5 compares the results with those presented in previous papers, and Section 6 gives a summary of the main results and a discussion.
2 Simulations
2.1 The code
The simulations in this paper were performed with version 3 of the gadget code (Springel, 2005), a massively parallel TreePM+SPH code with fully adaptive time-step integration. To describe the hydrodynamical evolution of gas, the code adopts the SPH formulation of gadget2 where entropy is explicitly conserved (Springel, 2005). Whenever a Lagrangian SPH code is used, cooling of hot gas at the interface with a cold condensation is affected by a numerical bias, due to the fact that density estimates of hot particles are affected by the many cold SPH neighbors. As shown by Yoshida et al. (2002) and Tornatore et al. (2003), the entropy-conserving formulation of SPH limits the importance of this numerical effect. Another way to limit it is to avoid the formation of cold clumps using a “star formation” recipe to transform cooled particles in collisionless ones (Viola et al., 2008; Saro et al., 2010); this is described below. Radiative cooling of a plasma with primordial composition is computed as in Katz et al. (1996), assuming an ionizing UV background switched on at and evolving with redshift as suggested in, e.g., Haardt & Madau (1996).
In the absence of heating from star formation, following the evolution of gas subject to runaway cooling is computationally expensive, as most time is devoted to integrating the hydrodynamics of over-cooled and unresolved gas condensations with sizes that are much smaller than the gravitational softening. Since cooling is irreversible in these conditions, it is convenient to transform cooled particles into collisionless “stars”. We thus used a “star formation” algorithm where every gas particle with overdensity higher than (with respect to the average gas density) and temperature lower than K is instantaneously transformed into a collisionless “star” particle. This causes a dramatic speed-up of the code; moreover, the absence of overcooled gas condensations helps in reducing numerical overcooling at the interface of cold and hot gas. This choice has modest drawbacks: the lack of pressure from the cold gas will influence the profile of the hot particles in some way (but in any case the pressure of over-cooled gas blobs is unphysical), and collisionless particles will slowly scatter into a “diffuse light” component.
We stress that this “star formation” prescription is not meant to describe the formation of stars but it only represents a convenient numerical shortcut to treat particles that have undergone runaway cooling. In the following, we will call refer to “star” particles as cooled particles.
Using a small 9 box with DM and gas particles and with the same mass and force resolution as the simulations presented here, we performed four test simulations using values of , , and an effectively infinite value to reproduce to the case of no star formation. Comparing the results of the simulations at (where the simulation without star formation slowed down dramatically), we checked that the density and temperature profiles of hot gas were reasonably stable for changes in , with being a good value to preserve hot gas profiles while achieving significant speedup. Furthermore, we checked that, for the three runs with star formation, the mass of cooled gas changes by no more than per cent at all redshifts, higher thresholds giving slightly lower values of cooled mass as expected.

2.2 Runs
Initial conditions were created using the public N-GenIC code of V. Springel111 http://www.mpa-garching.mpg.de/gadget/right.html , which uses the Zel’dovich approximation to displace particles from a regular cubic grid. We assumed a CDM cosmological model with , , , km s-1 Mpc, , . We generated initial conditions for a box of 36 (50 Mpc) sampled with DM and gas particles. The initial redshift was set equal to 199, where the r.m.s. particle displacement for the large box is 30 per cent of the grid spacing. Particle masses are for DM and for gas. With this choice, a halo is resolved with 50000 DM particles. The assumed value for the gravitational softening is 1.5 comoving . These values were found in Viola et al. (2008) to be adequate to fully resolve the cooling region of a halo.
We run this simulation in four configurations. (i) PUREDM: a pure N-body simulation, where all gas particles are treated as collisionless particles. This was used to create merger trees for the SAMs. (ii) NOCOOL: a simulation with gas hydrodynamics but without radiative cooling and UV heating. (iii) COOL: a simulation with radiative cooling, UV heating and “star formation”. (iv) COOLZ2: a simulation with the same physics as COOL, using a snapshot of the NOCOOL simulation at as initial conditions. In this paper we present results based on the PUREDM, COOL and COOLZ2 simulations; the NOCOOL simulation will be used in future papers.
To have a proper time sampling of the merger trees (Benson et al., 2012), halo and substructure-finding were performed 128 times, uniformly spaced in the logarithm of the scale factor from to . In this way, a halo is sampled roughly two times per dynamical time. This “post-processing” was performed on-the-fly and included a standard friends-of-friends (FoF) halo finder algorithm as well as the substructure finder algorithm SUBFIND (Springel et al., 2001). To limit storage requirements, snapshots were saved only 64 times, At , there are 16 halos more massive than in the PUREDM simulation, 159 more massive than and 302 more massive than . This mass roughly corresponds to 20000 DM particles, and we set it as a lower limit for the mass of the main progenitor. The number of halos that we find is sufficient to span two orders of magnitude in halo mass and perform averages over many halos.
Halos in the COOL and COOLZ2 simulations were matched to those of PUREDM simulation by checking positions and masses. A few ambiguous cases were found whenever pairs of nearby halos were classified as merged in one simulation and separated in the other; these halos were removed from the catalog.
2.3 Merger trees and halo masses
The construction of merger trees is affected by a number of issues described, for instance, in Fakhouri & Ma (2008) or Tweed et al. (2009) (see also Srisawat et al., 2013). Of the three SAMs used here, the delucia and galacticus models run by default on merger trees based on dark matter substructures, while morgana runs only on FoF-based trees. In Paper I, all models were run on FoF-based trees, so as to carry out a fair comparison; this choice was tested and discussed there. We adopt the same approach in this paper.
We constructed FoF-based merger trees by directly matching pairs of progenitor/descendant FoF halos in consecutive outputs. We set a minimum mass of 100 particles for the smallest progenitor considered. Halo pairs were matched when they overlapped by more than 50 per cent of particles, with respect to either the progenitor or the descendant. When substructures are neglected, the main issue is the splitting of halos, i.e. the case of FoF halos having two or more descendants. This can be due to either (i) artificial bridging of two separated halos in one snapshot, which is a byproduct of the FoF algorithm; or (ii) highly eccentric orbits of substructures that lead them temporarily out of their main halo. Assuming that a halo at the output i splits into halos and at ( being the largest descendant), we recognize as an artificially bridged halo (case i) if it verifies these relatively conservative criteria: (1) both and overlap by at least 75 per cent (of their particles) with two separate halos and in output ; (2) the mass of is at least 1 per cent of that of ; (3) contains at least 300 particles; (4) the mass of is not lower than 90 per cent of that of . Splitting is then solved by creating a new halo that takes part of the mass of , descends from and is progenitor of . Because bridged halos are likely to merge in the future, the risk of adopting too conservative criteria is to anticipate the merging time in some cases; we think that this is more acceptable than attempting to separate halos that have truly merged. When these criteria are not fulfilled, the halos are considered to belong to case (ii), that is solved by absorbing the split (smaller) halo back into the main halo , then iterating the procedure for all descendants of .
Idealized merger trees obey two further conditions: halo masses should never decrease with time and, after each merger, the mass of the remnant should be larger than that of the merging halos. Merger trees extracted from simulations do not follow these rules. In SAMs, the amount of baryons associated with a halo is computed as the halo mass multiplied by the universal baryon fraction, so if the former decreases the SAM would lose baryons. In reality, a decrease in halo mass is typically due to a readjustment of the halo profile after a merger, so it is realistic to assume, as we did in Paper I, that whenever halo mass decreases the baryonic mass available to the halo remains constant. The amount of baryons is thus determined as the cosmic baryon fraction times the largest value of the halo mass reached along the main progenitor branch, including the mass of merging progenitors.
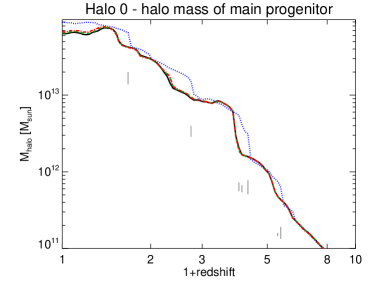
As for the halo mass, we use , computed as the mass within a sphere (of radius ) such that its overdensity is 200 times the critical density of the Universe, . This quantity is computed by the SubFind code, using as center of the sphere the most bound particle of the main substructure of the FoF halo. Fig. 1 shows the mass accretion history of the main progenitor of the most massive halo in the PUREDM simulation, hereafter named halo 0. At this halo has . In this figure the black continuous and the blue dotted lines correspond to and of the main progenitor in the PUREDM simulation. The vertical black dashes mark the times corresponding to major mergers, i.e. mergers of halos with mass ratios larger than 1:10. The length of the dash is proportional to the mass ratio. The two masses grow similarly in time, with the difference that, at major mergers, responds more slowly than to the increase of mass. By visual inspection, we verified that the FoF algorithm merges two halos when they start to overlap, but the mass of the smaller progenitor significantly overlaps with the sphere only towards the end of the relaxation process, which lasts halo dynamical times. The difference in the two growth curves is a reflection of the fact that there is no obvious definition of “mass” for a halo undergoing a major merger.
Fig. 1 also shows the mass accretion histories (defined via ) of the same halo in the COOL (green dashed line) and COOLZ2 (red dot-dashed line) simulations. Because cooling concentrates baryonic matter in the halo center, the masses in the cooling runs are slightly larger – per cent – than in the PUREDM run. Apart from this, the merger trees are very similar. This degree of similarity is observed in most halos, with a few exceptions in cases where, at high redshift (), two merging halos have very similar masses and the most massive progenitor is not the same in the two simulations. These results confirm that using merger trees from a collisionless simulation induces only small differences in model results.
2.4 Computation of cooled masses
The cooled mass of a halo can be simply computed as the total mass of “star” particles. These particles cool in the deepest regions of potential wells, but then, as noticed in, e.g., Saro et al. (2010), they are subject to tidal forces, if not to two-body heating, and scatter away from the substructure in which they were born to form a “diffuse stellar component”. Some of these stars can scatter beyond , thus making the computation of cooled mass more complicated. The cooling rate onto a halo can then be computed by taking the difference of cooled masses between two consecutive outputs; in this case it is necessary to subtract the contribution from gas that cooled in other progenitors and then entered the halo via merging. With post-processing performed on time intervals smaller than the halo dynamical time, we resort to an alternative computation of cooled masses, which avoids the difficulties mentioned above and allows us to easily subtract out the contribution from insufficiently resolved halos.
GADGET assigns to each cooled particle (“star”) an “age”, equal to the scale factor at “star formation”. Because particles retain their ID number, we identify for each cooled particle the FoF halo it belonged to at the last output where it was still a gas particle. We find that only 0.3 and 0.4 per cent of particles in the COOL and COOLZ2 simulations did not belong to any FoF halo at the last output before cooling. The cooling rate of a halo at a given output is then computed as the mass of all cooled particles that were gas particles in the previous output and belonged to the halo main progenitor, divided by the time interval between the two outputs. Cold masses are computed by summing cooling rates over all progenitors along the merger tree.
This approach allows us to subtract out the contribution coming from poorly resolved halos. In previous work (e.g. Benson et al., 2001; Yoshida et al., 2002; Helly et al., 2003), based on simulations at much poorer resolution, this limit was often estimated by requiring that the halo has at least as many gas particles as the number of neighbors used to compute the density (64 in our case). For our simulation, this would give . This is a very optimistic estimate, because cooling takes place in the inner region of the halo, whose size is of order of the scale radius. To quantify the mass scale above which the cooling region is well resolved in our simulations, we use the 9 box already discussed in Section 2.1, run with the same setting as the COOL simulation (identical conclusions are reached using the full COOL and COOLZ2 simulation). We show in the upper panels of Fig. 2, for all progenitors of all halos more massive than and for three redshifts (, and ), the ratio between cooled mass and total gas mass in the halo. At small masses, below roughly M⊙, cooled fractions begin to drop to low values. This behavior is specific to the simulation and is not observed in SAM predictions. This drop is in part an effect of heating due to the UV background. To subtract out this effect, the lower panels report the same quantities for a simulation run without a UV background. In this case cooled masses change significantly below M⊙, but the change of trend with halo mass at is still present and has to be ascribed to limited numerical resolution.
A halo of mass is sampled by 10000 DM particles, and at it has a virial radius of kpc; for a concentration of , the scale radius is kpc, times the gravitational softening. This is a good, conservative, lower limit for the mass of the smallest halo where cooling is properly resolved in this simulation.
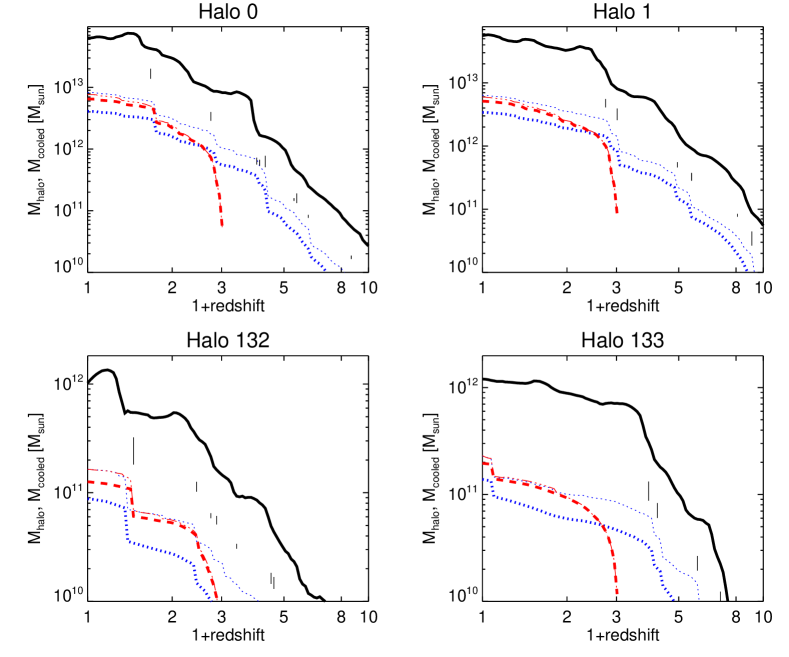
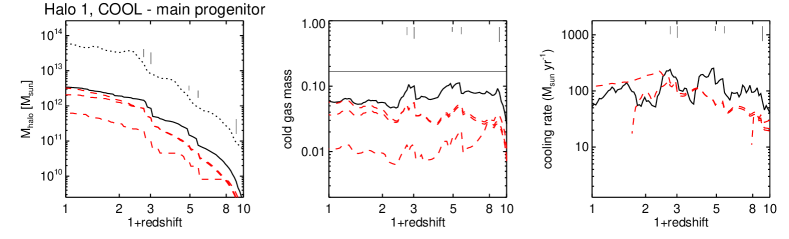
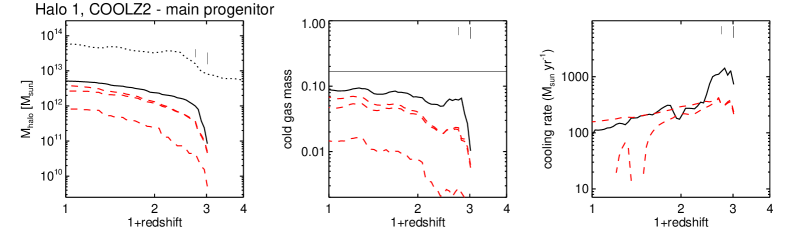
From now on, unless otherwise specified, cooled masses will be computed by summing cooling rates on all progenitors more massive than . In Fig. 3 we show the cooled mass found in the main progenitor of four example halos that will be used in the following analysis. Two of these are the most massive halos in the simulation, halo 0 and halo 1, with the former suffering a major merger below and the second having a more quiet merger history at late times. The other two halos have masses , with halo 132 suffering a recent major merger and halo 133 having a quiet mass accretion history. For each halo, we show results from the COOL (dotted blue lines) and COOLZ2 (red dashed lines) simulations. Thick lines give cooled masses computed as described above while thin lines give the total mass of cooled particles in the halos; accordingly, the differences between the thin and thick lines give the contributions of poorly resolved halos. This is very significant in all cases for the COOL simulation, amounting to roughly a factor of two, while it is much more limited for in the COOLZ2 simulation. It is worth reminding that this increase of cooled mass is contributed both by cooling and by mergers.
This figure demonstrates the ability of COOLZ2 to suppress over-cooling in poorly resolved progenitors. In the COOL simulation the fraction of cold mass that has cooled in well-resolved progenitor halos is roughly constant with redshift (and of order of ), because small halos continually bring cold gas into the main progenitor through mergers. The COOLZ2 simulation produces total cooled masses (the thin lines) that by have converged to those of the COOL simulation. This is expected, because the fraction of the residual hot gas will be roughly determined by the density at which cooling times become equal to the Hubble time. But in COOLZ2 most gas cools in haloes with , since high- overcooling at high redshift is removed and the hot gas density at is higher than in COOL. We thus conclude that in this simulation the numerical description of cooling is less affected by poor resolution than in the COOL run.
The computation of hot masses is affected by an uncertainty related to the definition of halo mass: models use to compute the total amount of available baryons, so the output of the post-processing gives the mass of hot gas within the FoF halo. Then, a comparison of models with simulations is affected by the scatter between and . This problem affects the computation of cooled mass described above to a much smaller extent, since particles that suffer runaway cooling are located well within . We have verified that the behavior of hot masses is entirely predictable from that of cooled masses, so for sake of simplicity we will restrict our analysis to cold masses and cooling rates.
3 Semi-analytic models
We compare the results of the simulations described above with predictions from the three stripped-down SAMs galacticus, morgana and delucia as defined in the Introduction. All models have been adapted to run on the FoF merger trees of the simulation. In all cases, the only baryonic processes implemented are shock heating, cooling and infall of gas onto the central galaxy. Cooling times are computed using the Sutherland & Dopita (1993) cooling functions assuming zero metallicity. Merger times are set to zero so that galaxy mergers immediately follow the merging of DM halos. Predictions for the COOLZ2 simulation are obtained by switching on gas cooling only after . As for the cooling rates, we compute them as the cold mass accumulated on the central galaxy between two snapshots, divided by the time interval between them. We verified that these cooling rates are very similar to the instantaneous cooling rates evaluated at the time of the later snapshot. The cooling and infall models embedded in these SAMs are described at length in the original papers and in Paper I, so we give only a short summary of their main properties here.
3.1 The delucia model
The rate of gas cooling is computed following the model originally proposed by White & Frenk (1991), with the specific implementation following that of Springel et al. (2001). The hot gas within dark matter halos is assumed to follow an isothermal profile:
| (1) |
At each output, the total amount of hot gas available for cooling in each halo is estimated as follows:
| (2) |
where is the universal baryon fraction and is the cold mass associated to the halo. Eq. 2 can provide, in a few cases, a negative number (this occurs typically after important halo mergers). In this case, the amount of hot gas is set to zero, and no cooling is allowed in the remnant halo.
The equations for the evolution of gas are solved using time-steps between each pair of simulation snapshots. The cooling time is defined as the ratio of gas specific thermal energy and cooling rate per unit volume:
| (3) |
In the above equation, is the mean particle mass, is the electron density, is the Boltzmann constant, and represents the cooling function for a zero metallicity gas. The virial temperature of the halo is computed as:
| (4) |
where is the mass of the hydrogen atom, and is the mean molecular mass.
A ‘cooling radius’ is then computed as the radius at which the local cooling time is equal to the halo dynamical time. If the cooling radius is smaller than the virial radius of the halo under consideration, the gas is assumed to cool quasi-statically, and the cooling rate is modeled by a simple inflow equation:
| (5) |
At early times, and for low-mass halos, the formal cooling radius can be much larger than the virial radius. In this infall-dominated regime, the infalling gas is assumed not to reach hydrostatic equilibrium and the accretion rate on the galaxy is determined by the halo dynamical time:
| (6) |
where .
3.2 The galacticus model
The highly modular galacticus code has been configured so as to reproduce the behavior of the Durham model of Cole et al. (2000), Benson et al. (2003) and Bower et al. (2006).
The hot gaseous component in dark matter halos is assumed to have a density profile described by the -model:
| (7) |
where is the density at the center of the halo, is the radius of the core, and is a parameter that sets the slope of the profile at . The model assumes ; the standard choice of core radius is . The temperature profile of the gas is assumed to be isothermal at the virial temperature (Eq. 4)
Evolution is integrated between each pair of simulation snapshots using an adaptive timestep integrator set to maintain a tolerance of 1 part in in all evolved quantities. Halo masses are linearly interpolated between their values at successive snapshots when needed as input to the integrator.
When the mass of a halo is increasing with time, , the hot halo gains mass at a rate
| (8) |
In cases where the the halo is decreasing in mass with time, , this mass loss is instead accumulated to a quantity, :
| (9) |
while remains constant (or decreases if cooling is occurring). Once the halo begins to grow once more, the accretion rate onto the halo becomes
| (10) | |||||
| (11) |
such that the mass of hot gas does not begin to significantly grow until this halo exceeds the previous maximum value of .
The cooling time is defined using Eq. 3. The cooling radius is computed by equating the radial-dependent cooling time with the dynamical time of the halo. The cooling rate is then given by Eq. 5 if or by Eq. 6 if . The mass of the hot halo is decreased at this rate, and is integrated between each pair of simulation snapshots to find the mass of gas that flows onto the central galaxy.
3.3 The morgana model
The cooling model implemented in morgana is described in Monaco et al. (2007) and Viola et al. (2008). The hot halo phase is assumed to be in hydrostatic equilibrium in a NFW halo, to fill the volume between the cooling radius and the virial radius of the halo, and to be subject to a polytropic equation of state with index . Under these assumptions, one obtains:
| (12) |
| (13) |
where is a function of halo concentration (), and is the halo scale radius. and are the values of density and temperature extrapolated to , while and .
The cooling rate is computed by integrating the contribution to cooling from all mass shells:
| (15) | |||||
where is computed using the central density and the temperature of the gas at .
At each output, the mass of gas that falls onto the halo is computed as:
| (16) |
where the sum extends over all progenitors of the halo other than the main one, and is the maximum value of the virial mass along the main progenitor branch. The evolution of the system is followed with a Runge-Kutta integrator with adaptive time steps, and the equilibrium configuration of the hot halo gas is re-computed at each time-step.
By equating the mass cooled in a time interval with the mass contained in a shell , one obtains the evolution of the cooling radius, which is treated as a dynamical variable in this model:
| (17) |
where is the sound speed computed at , and is added to the right hand side of the above equation to allow the ‘cooling hole’ to close at the sound speed.
The calculation of cooling rate is started when a halo appears for the first time, with , and is reset after each halo major merger. Cooling is then assumed to be quenched for dynamical times after each merger, plus one cooling time, to mimic the time needed by the merging system to relax into the new configuration and start cooling again. We use the standard value of .
4 Results
As in Paper I, we illustrate the behavior of models both by considering the predicted cooled masses and cooling rates for all halos more massive than at some relevant redshifts, and by showing detailed predictions for the four example halos selected in Section 2.4. We recall that halos 0 and 132 experience major mergers below , while halos 1 and 133 have more quiet merging histories. To present a more organic discussion, we show all the main results before discussing them.
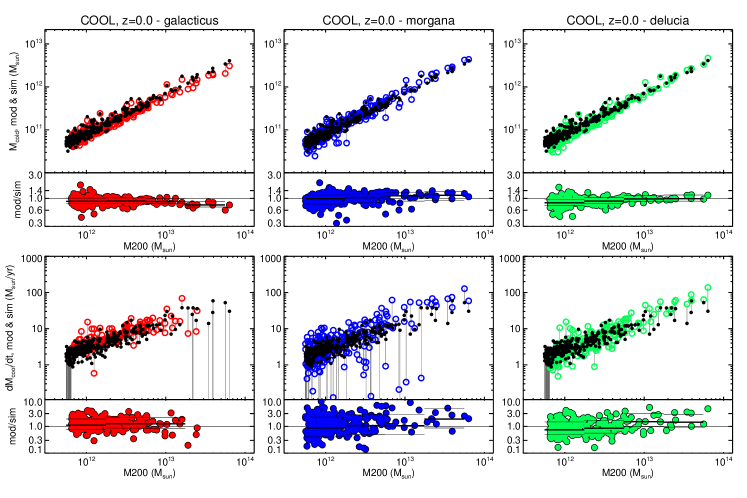
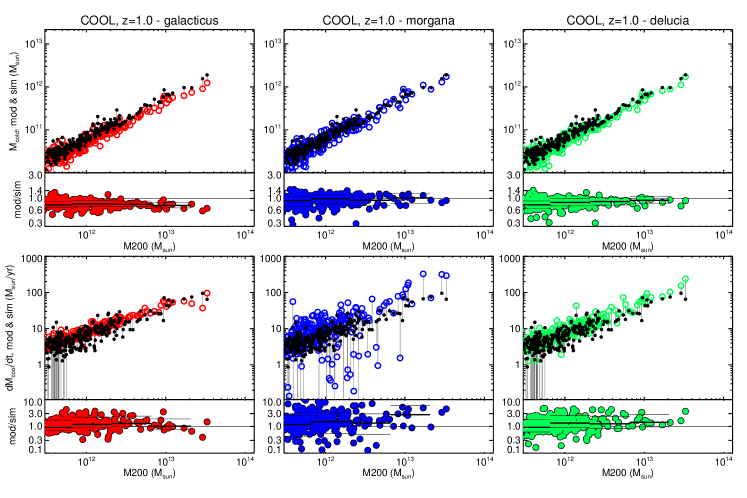
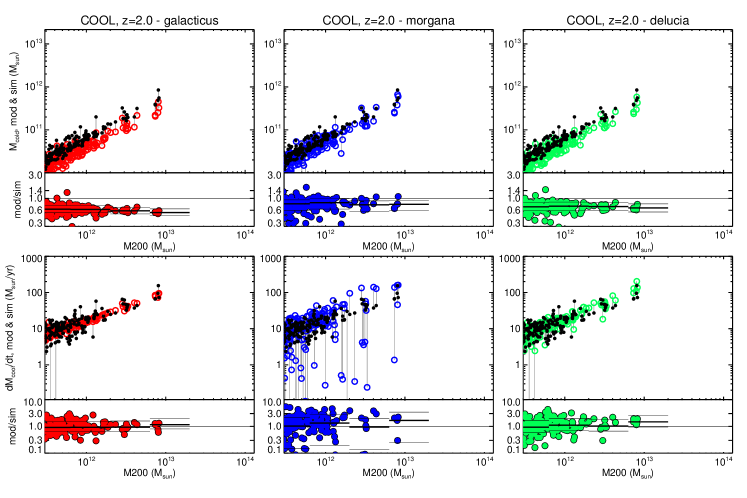
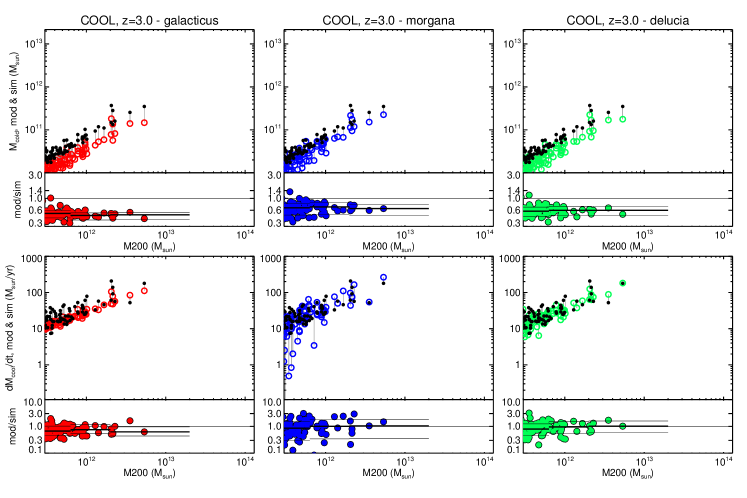
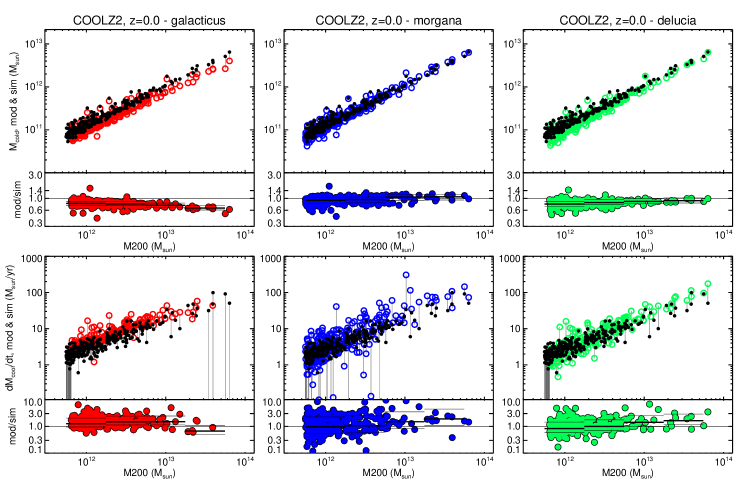
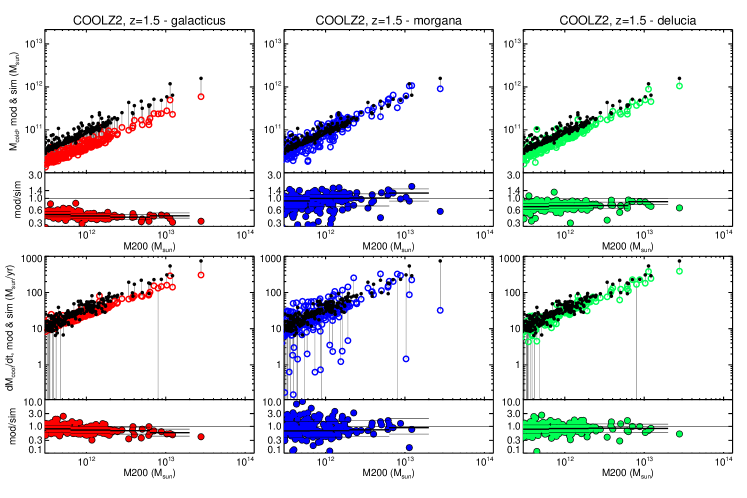
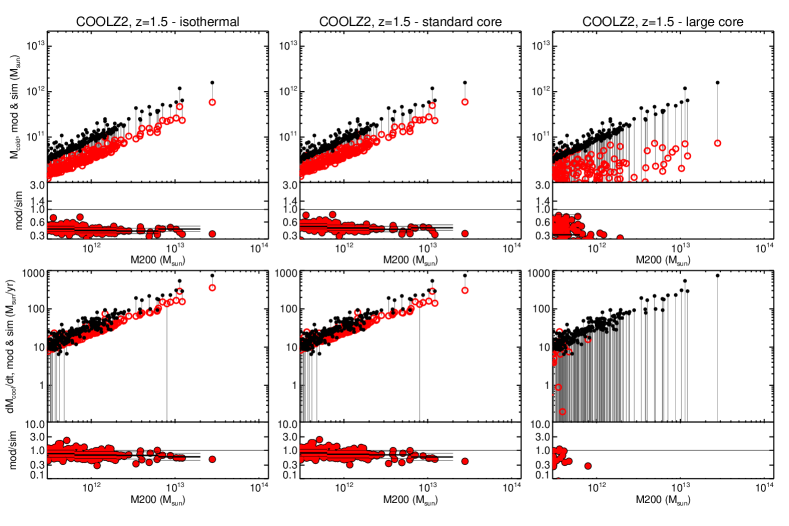
Figs. 4 (COOL simulation) and 5 (COOLZ2 simulation) show, for each halo or its main progenitor, a comparison between model predictions and simulation results. Starting from the upper panels, we give results at for the three models separately; galacticus is shown in red, morgana in blue, delucia in green. For each set of panels, the upper panels report the cooled masses, the lower panels the cooling rates. Pairs of points corresponding to the same halo are connected by a thin black line; this allows to highlight the cases in which SAM predictions lie beyond the limits of the plot. In all panels, the lower part reports the ratio between SAM and simulation results, thick lines show median values of the points in mass bins of 0.5 dex, while thin lines correspond to the 16 and 84th percentiles computed as follows: calling the ratio of model and simulation predictions for halo , we compute for each mass bin the median value and the quantity , then compute the 16 and 84th percentiles of the set of for all halos and show these percentiles scaled with the median value. Results are given at , , and for COOL (Fig. 4), and for COOLZ2 (Fig. 5).
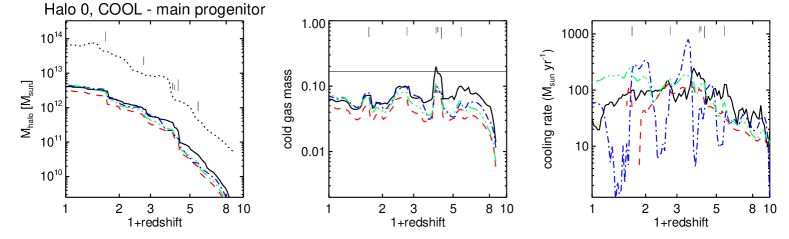
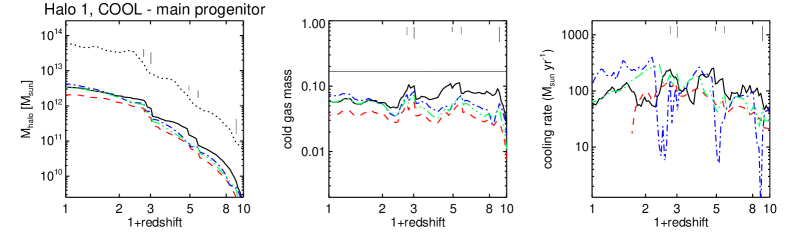
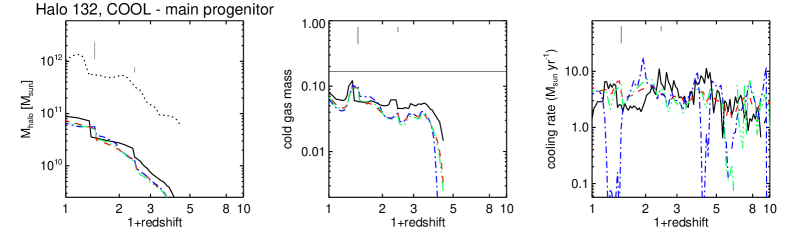
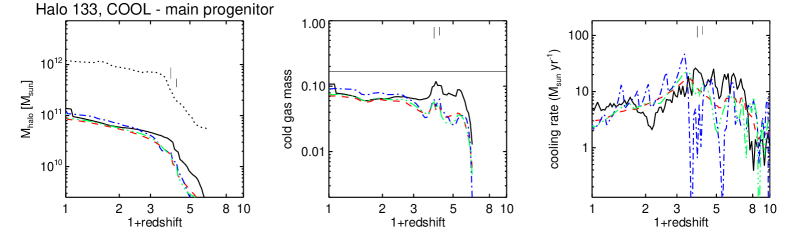
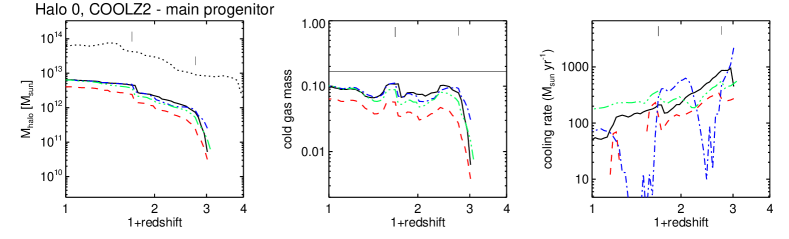
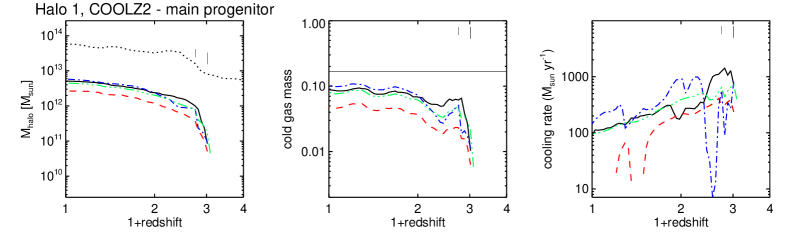
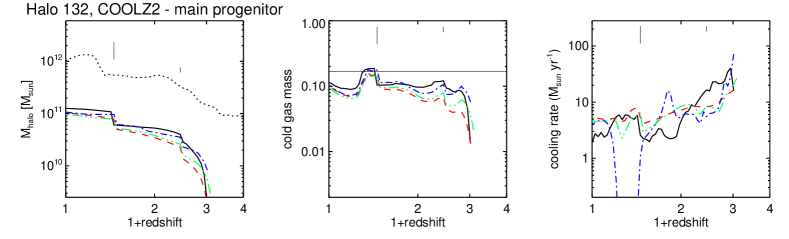
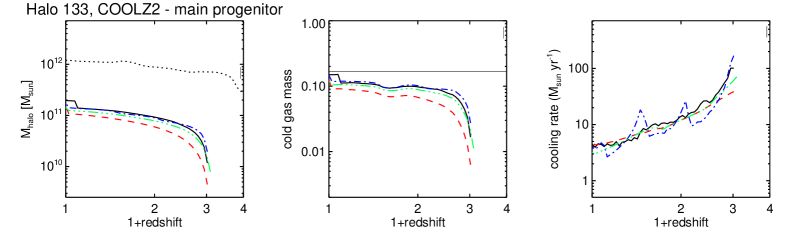
The detailed evolution of the four example halos is shown in Figs. 6 (COOL simulation) and 7 (COOLZ2 simulation). For each halo we show its mass accretion history for DM and cold gas, cold gas fraction and cooling rate of the main progenitor. Simulation results are shown in black; color coding for the models is the same as in the previous figures.
We confirm that cooling models embedded in SAMs are able to follow relatively well the accumulation of cooled mass obtained in the simulation. As far as cooled masses are concerned, average differences are smaller than 30 per cent, with some exceptions that will be commented on later (Figs. 4 and 5), and only a few halos show values that are discrepant by more than a factor of two. Cooled masses are also recovered with a relatively small scatter, typically less than 20 per cent. Cooling rates are recovered in a much noisier way, with average discrepancies and scatter being typically within a factor of two for galacticus and delucia, within a factor of three for morgana. The same level of agreement is achieved in the detailed history of example halos (Figs. 6 and 7). Beyond this overall agreement, a number of interesting discrepancies are evident.
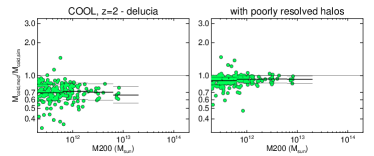
(i) Cooled mass and cooling rates predicted by SAMs are typically below the corresponding results from the COOL simulation at . This is apparent both in the histories of the four example halos (Fig. 6) and in the and panels of Fig. 4, where cooled masses are below simulated ones by per cent, while cooling rates are in much better agreement. This implies that models are slow in accumulating cooled mass in the infall-dominated regime. This result is evident only when the mass cooled on unresolved halos is subtracted out. Fig. 8 shows how the cooled mass is recovered by one of the models (delucia) when the contribution from poorly resolved halos is (left) or is not (right) subtracted out both in the model and in the simulation. Model results are in better agreement with simulations in the second case, but this agreement is due to the fact that the numerical underestimate of cooled gas happens to roughly compensate the model underestimate. Similar results are obtained for the other two models.
(ii) For massive halos, the galacticus model underestimates cooled masses and cooling rate relative to simulations. This is clearly visible for halos 0 and 1, for which the galacticus prediction of cooling rates drops to zero at . Fig. 4 and 5 shows that at , cooling rates for the most massive halos () are systematically below simulation values and approach 0 in several cases.
(iii) morgana reproduces the simulated cooling rates with much more scatter than the other two models: the fraction of halos discrepant by more than a factor of 10 ranges from 13 to 20 per cent (10 to 15 per cent for the other models). As apparent in Figs. 6 and 7, this is connected to the behavior of the model at major mergers: cooling is quenched for a period that corresponds to dynamical times plus one cooling time, while no such behavior is seen in simulations. Cooling rates then peak to high values and compensate the underestimate, thus providing on average correct values for the cooled mass, though the scatter with respect to simulated values is a higher than the other models.
(iv) At low redshift, both delucia and morgana tend to overestimate cooling rates in massive halos. This is consistent with the finding of Saro et al. (2010) of higher cooling rates at low redshift in a galaxy cluster. In that paper this discrepancy was shown to be due to the isothermal profile assumed for the gas in the delucia model. The same trend is, however, present at very similar level in morgana, that assumes a hydrostatic density profile with a shallow inner slope closer to the actual gas profile found in the simulations. We will come back to this issue later.
(v) Switching on cooling at has the effect of triggering quick deposition of cooled mass and high cooling rates. From Fig. 7 we see that, while delucia and especially morgana follow this transient well and quickly converge to the cooled mass of the simulation, galacticus predicts lower cooling rates and is slower in converging to the correct gas fraction; in massive halos, it always remains below the simulation value. Looking at Fig. 5, we see that morgana gives a good fit of simulated cooled fractions already at , though with substantial scatter, where delucia is biased low by per cent and galacticus by a factor of two.
4.1 The role of gas profile
Point (ii) is in line with the finding in Paper I that the cored gas profile assumed in the durham model is mainly responsible for the under-prediction of cooling rate with respect to the delucia model, that assumes an isothermal gas density profile. In paper I, we verified that, when a similar assumption is made for the gas profile in the durham model, results from the two SAMs are much closer. Point (v) is in line with the results of Viola et al. (2008), who found that their implementation of “classical cooling”, very similar to the cooling model of galacticus for the case of a static halo, underestimates cooling rates when cooling is suddenly switched on. In that case the gas profile was computed assuming a hot atmosphere in hydrostatic equilibrium (as in morgana, Eqs. 12 and 13), and the resulting profile gave a good fit to the simulated one before cooling was switched on.
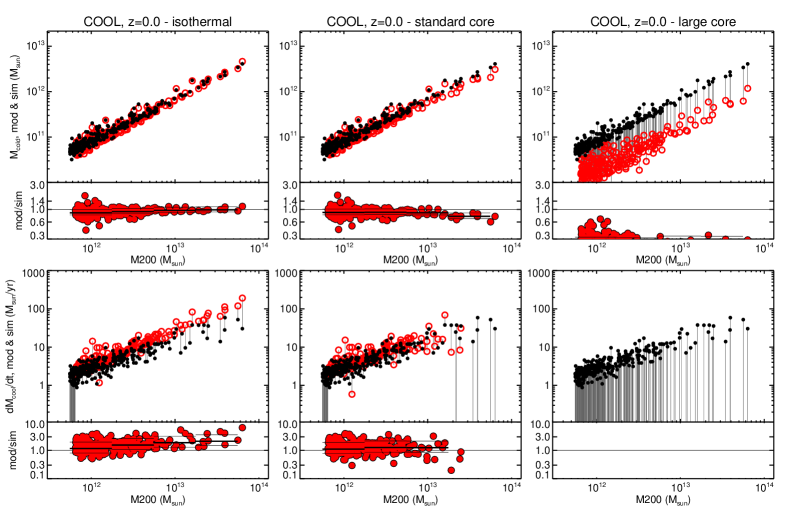
To understand the influence of the assumption of gas profiles in the cooling model, we run the galacticus model with a singular isothermal profile or a cored profile with a much larger core radius, of 0.42 times the virial radius. Figs. 9 and 10 show some relevant results. As an example for this case, we chose halo 1, which has a more quiet merging history. Fig. 9 shows for the COOL and COOLZ2 simulations the evolution of halo 1 for the three galacticus models, Fig. 10 shows cooled masses and cooling rates for all halos; for the COOL simulation, we show results at , while for COOLZ2, we show results at (recall that cooling was switched on at in this run). In agreement with results discussed in Paper I, we find that using an isothermal gas density profile brings SAM predictions in much better agreement with results from the COOL simulation at low redshift. In this case, significant cooling rates are obtained in large halos at , while results are very similar for smaller halos. In fact, this model behaves very similarly to delucia, which assumes the same gas density profile; this similarity includes the tendency of cooling rates higher than simulated ones in massive halos.
However, when the COOLZ2 simulation is considered, the assumption of an isothermal gas density does not increase significantly the fraction of cold gas at late times (Fig. 9). As visible in the lower panels of Fig. 10, cooled masses at are as low (50 per cent lower than the simulation) as in the standard core model, while the delucia model is lower by 30 per cent only (5). This is in line with Viola et al. (2008), where it was shown that the slow accumulation of cooled mass in the “classical model” is due to the assumption, implicit in Eq. 5, that each gas shell cools on a cooling time computed using the initial density and temperature, while the evolution of gas elements is at increasing density and roughly constant temperature, and this leads to catastrophic cooling on a shorter time scale. The different results of delucia and galacticus show that the result is sensitive to the precise integration scheme of Eq. 5, however.
The results discussed above show that simulations disfavour the use of a very large core for the gas profile in the galacticus model, at least in this setting where gas density profile is not affected by any source of feedback. Clearly, feedback is going to influence gas profile and may increase the core size but, whenever the halo is well within the cooling-dominated regime, feedback from star formation will be triggered by cooling itself, so it would be difficult to sustain a very large core radius if this has such a large negative impact on the cooling rate.
Another parameter related to the halo density profile is the polytropic index of the morgana cooling model (Eqs. 12 and 13). Because this quantity is constrained both by simulations and, for galaxy clusters, by observations, there is no much freedom to vary it. We ran the model assuming and , and found that the two new realizations were giving slightly larger discrepancies with respect to the simulations, consistently with being the optimal value.
4.2 Behavior during major mergers
One reason why morgana produces a large scatter in the predicted cooling rates is that it assumes that cooling is switched off in major mergers. The rationale behind this idea is the deep reshuffling of phase space that takes place at these events. Indeed, looking at Figs. 6 and 7, no obvious decrease in cooling rates is visible at or after major mergers in simulations. We looked for correlations between the ratio of progenitor masses in two consecutive outputs and the ratio of cooling rates before the merger and after outputs, with varying from 1 to a few. The first quantity is large when a major merger takes place, so if major mergers quench cooling then we would expect the second quantity to be negatively correlated with the first one. We did not find any such correlation.
The lack of any quenching of cooling at major mergers is plausibly connected to the persistence of strong condensations at the center of DM halos. In the case of runaway cooling studied here, the resulting condensations deepen the halo potential well and thus cause an enhancement of hot gas density and then of radiative cooling around them. In other words, they act as seeds for cooling of hot gas. These condensations are simulated as clumps of collisionless stars, and are so compact that large-scale tides are ineffective at disrupting them. The effect of merging-induced shock waves on the hot gas that collects around such condensations will be to some extent affected by the hydro solver, but this should be a further-order effect. It would be very interesting to test this idea with a Eulerian simulation that uses the same setting.
Conversely, when the whole physics of galaxy formation is taken into account, “condensations” will not represent unphysical condensations but true galaxies. In this case, further heating will be provided by energetic feedback from massive stars and AGN. This heating source will be able to limit the accumulation of mass in galaxies and to flatten the density profile of hot gas around them, keeping it to a higher adiabat and making it easier to heat. In these conditions, major mergers may still cause a quenching of cooling. Of course AGN feedback would likely be more effective in this regard.
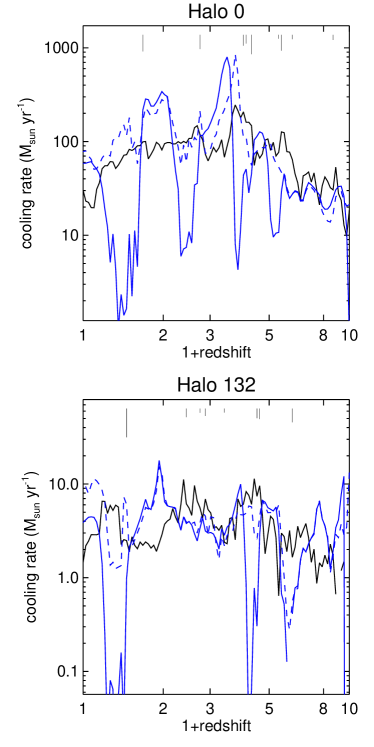
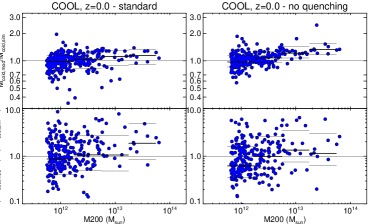
It is interesting to see what happens to morgana when quenching of cooling at major mergers is not applied. Fig. 11 shows, for the COOL simulation, the cooling rates of the two example halos that suffer major mergers at late times (0 and 132). The continuous line shows the standard cooling model, while the dashed line shows a model with no quenching. Here the cooling radius is still reset to zero at major mergers; we have verified that dropping this condition does not lead to significant changes. The model without quenching removes some troughs in the cooling rates. In Fig. 12 we show the cooled gas and the cooling rates predicted with the two models for all halos. Left and right panels give the results of the standard and no quenching model respectively. As expected, the number of halos where cooling rates differ from the simulation values by more than a factor of 10 is less in the no quenching model, but several cases are still present and the scatter does not decrease significantly. Because of the systematically higher cooling rates, the cooled masses are now biased high by per cent at high masses.
One more possibility to investigate is to remove the term in Eq. 17 that decreases the cooling radius at the sound speed. This term is peculiar to the morgana cooling model, where the cooling radius is treated as a dynamical variable. This term helps the gas to drift towards the halo center, so it causes higher cooling rates at late times after a reset of the cooling radius. We have verified that if we drop this term in the model with no quenching we obtain slightly lower cooling rates, that limit the overestimate of cooled mass with respect to the simulation, but the resulting cooled masses are biased low by 30 per cent at low masses.
5 Comparison with previous results
With respect to previous papers that performed similar tests based on SPH (Benson et al., 2001; Yoshida et al., 2002; Helly et al., 2003; Cattaneo et al., 2007; Lu et al., 2011), our simulations improve significantly in terms of mass and force resolution. Hirschmann et al. (2012) worked at a resolution and in a mass range analogous to the one used in this paper, while Saro et al. (2010), presented results for a galaxy cluster at a resolution that is analogous to ours for that mass scale. Together with our good time sampling, good mass resolution has allowed us to limit the computation of cooled masses to those halos that are resolved with more than particles. Our conservative limit is much higher than what has commonly been used, and guarantees a proper sampling of the central region where cooling takes place. This high value of also removes the contribution to cooling from those halos that are affected by the UV background. As an example of the importance of this effect, we showed (Figure 8) that the underprediction of the amount of cold baryons in the infall-dominated regime (also reported in other papers, see below), can be compensated for by the effect of poor resolution when much cooling takes place at high redshift.
A detailed comparison of our results to the most recent papers (Saro et al., 2010; Lu et al., 2011; Hirschmann et al., 2012) is complicated by the different treatment of merging times and resolution effects. All papers agree in identifying, beyond a general broad agreement, a trend of underestimation of cooled masses at high redshift or small halo mass and overestimation at low redshift or high halo mass, trends that we find also in our analysis. The high-redshift/low mass trend was explained by Lu et al. (2011) and Hirschmann et al. (2012) as an effect of the more extended dominance of cooling-dominated regime with respect to SPH simulations, where cold flows are found to easily penetrate the hot halos and quickly deposit their mass into the central galaxy. The low-redshift overestimation was interpreted by Saro et al. (2010) as an effect of their assumption of a singular isothermal profile for the hot gas, that is at variance with the flatter profile found in simulations. To this last conclusion we can add that the assumption of a cored profile in galacticus leads to an underestimation of cooled masses, while the assumption of hydrostatic equilibrium profile in morgana leads to a similar overestimation. This shows how the details of the implementation are of great importance.
The only analogue of our COOLZ2 simulation is the simulation of static halos performed by Viola et al. (2008). Our results are fully consistent with those presented in that paper and they extend the same conclusions in the much more realistic environment of full dark matter merger trees: following the quick onset of cooling is a challenge for cooling models. The poor performance of a model, like galacticus, based on Cole et al. (2000) was explained in that paper by showing that Eq. 5 is strictly valid as long as a mass element cools to low temperatures in a time equal to the cooling time computed using its initial density and temperature, but gas elements evolve at roughly fixed temperature and increasing density, and thus cool more quickly. While all models use some version of Eq. 5 for computing the cooling rate, the specific implementations makes the results very different for this test.
The difference between gadget and the moving-mesh code arepo, reported by Kereš et al. (2012) and Nelson et al. (2013), raises the worry that our results may be affected by the use of a specific hydro solver. Again, the results presented in Kereš et al. (2012) refer to the central galaxy and make no attempt to subtract out the contribution of poorly resolved halos, so a straightforward comparison is not possible. However, we computed at the mass of central cooled gas concentrations (using the “star” particles within of the virial radius) and compared it with the galaxy mass/halo mass relation of Kereš et al. (2012) (their figure 4), finding within the statistics a good agreement with the SPH result of that paper. We also checked density and temperature profiles of halos, and found them to be roughly consistent with what presented in Figures 8 and 9 of that paper, and inconsistent with the drop in temperature found in arepo halos. As expected, despite the different “star formation” algorithms used, and in absence of effective thermal feedback, we obtain very similar results when we use the same code.
Intriguingly, both arepo and SAMs predict, with respect to SPH, higher cooled masses and cooling rates at low redshift/large halo mass. We find that SAMs overpredict cooling rates by a factor of and cooled masses by a much smaller factor, while Kereš et al. (2012) report much larger differences between the two codes. However, for a proper comparison one should check what is the difference when merging is neglected and the contribution from poorly resolved halos is subtracted out. Regardless, a conclusive assessment of the accuracy of different implementations of hydrodynamics is necessary before firm conclusions on the behavior of cooling in massive halos can be reached.
6 Summary and discussion
We have tested cooling models embedded in three widely used SAMs (Benson, 2012; Monaco et al., 2007; De Lucia & Blaizot, 2007) by comparing their predictions to N-body hydrodynamical (SPH) simulations of radiative cooling in cosmological DM halos. With respect to previous papers that performed similar tests (Benson et al., 2001; Yoshida et al., 2002; Helly et al., 2003; Cattaneo et al., 2007; Viola et al., 2008; Saro et al., 2010; Lu et al., 2011; Hirschmann et al., 2012), our simulations are improved in several ways: (i) we used a mass and force resolution sufficient to fully resolve the cooling region in all halos larger than ; (ii) we computed cooling rates and cooled masses subtracting out the contribution of cooling in poorly resolved halos; (iii) by also running a simulation where cooling is switched on at , we were able to test cooling models exactly in the redshift range where they are expected to be valid, with no influence from high-redshift over-cooling; (iv) using a suitable formulation of SPH and a “star formation” algorithm (as in Viola et al., 2008; Saro et al., 2010) to treat cooled particles as collisionless, we were able to limit numerical cooling and speed up the simulation considerably. As a word of caution, we recall that the simulations that we compare to SAMS have been carried out using an SPH hydrodynamical solver. Significant differences have been reported for the amount of star formation predicted by a simulation based on the arepo code that uses an Eulerian scheme (Kereš et al., 2012; Nelson et al., 2013), so some of our results, especially those relative to massive halos, may be affected by the specific hydro solver we use.
We confirm that, overall, cooling models are able to approximately predict the correct amount of cooled mass. When cooling is active since the start of the simulation (the COOL simulation), median values are recovered at to within 20 per cent and with a similar scatter. At higher redshift, median values agree to within 40 per cent. For individual halos, the worst discrepancies are rarely larger than a factor of two. However, when the cooled mass in the COOL simulation is limited to properly resolved halos, cooling models in SAMs underestimate the amount of cooled mass in the infall-dominated regime by per cent at . This difference is much less visible when the contribution of poorly resolved halos is included, as the numerical underestimate happens to compensate the theoretical one.
In some models (delucia and morgana, and galacticus when an isothermal gas profile is used), cooled masses for more massive halos tend to be higher than those found in the simulations at . While this difference is found in the same range of halo masses where Eulerian and Lagrangian codes give different results (Kereš et al., 2012), this confirms the findings of Saro et al. (2010) (see also Hirschmann et al. (2012)), who compared predictions from the delucia model with cooling rates from a simulation with very similar setting as our COOL simulation. This is a very relevant point: late cooling in massive halos deposits mass in the central galaxy, which is typically a bright elliptical galaxy. The stellar populations of these galaxies are observed to be very old (e.g. Thomas et al., 2005), so quenching this cooling is necessary for any successful galaxy formation model. AGN feedback in the so-called radio mode (Croton et al., 2006; Bower et al., 2006) it typically advocated to produce this quenching; however, the fraction of galaxies with detectable radio emission associated with the AGN activity necessary to perform this quenching is higher than what it is observed and shows the wrong dependence as a function of halo mass (Fontanot et al., 2011). As noticed also in Paper I, a cooling model that produces too strong a cooling flow at late times would require stronger AGN feedback to maintain quenching. For the delucia model, Saro et al. (2010) showed that the higher cooling rates with respect to results from simulations are due to the assumption of isothermal gas density profile. The same trend is shown by morgana, which assumes a hydrostatic density profile with a shallow inner slope. Clearly, the different type of integration used in the morgana cooling model causes the same trend without assuming a singular profile. However, before reaching a firm conclusion on this point it is necessary to fully understand the role of the hydrodynamic scheme.
Consistently with the results of Paper I, the galacticus model with a cored gas profile under-predicts cooling flows in massive halos at late times with respect to simulations. This prediction depends significantly on the assumed gas density profile: using an isothermal gas density profile generates predictions that are very similar to the delucia model and in much better agreement with the simulation, while large core radii are strongly disfavoured.
Cooling rates found in the simulations are recovered in the models with larger scatter, about a factor of two. Scatter is larger for the morgana model, and part of it is due to the assumption in morgana that cooling is quenched during major mergers. We find no such trend in the simulations, and this is likely due to the persistence of cooled condensations during mergers. When the assumption of quenching at major mergers is dropped, morgana predicts cooling rates with less scatter, but it still larger than the other models.
Comparing models and simulations when cooling is switched on at probably represents the cleanest test of the cooling model. In this case, in both the simulation and models, the baryons associated with halos are not pre-processed by runaway cooling, they are all located in the hot atmospheres when cooling is switched on. Also, the contribution of cooling from poorly resolved halos is very small for several halo dynamical times, and the deposition of cold gas is much less affected by all the numerical issues connected with the infall-dominated regimes. In our COOLZ2 simulation, the cooled mass is found to accumulate rapidly. At , morgana is able to predict the right amount of cooled mass, though with substantial scatter; delucia is biased low by per cent; and galacticus is low by a factor of 2, even when an isothermal gas profile is assumed. This confirms the findings of Viola et al. (2008), obtained with static halos and using gas profiles that closely matched the simulated ones just before cooling is switched on.
Although switching on cooling at a given redshift provides a clean test of cooling models, one can wonder whether such conditions occur in realistic cases, and therefore, whether the difference among models, which is much less evident in the COOL simulation, should be a cause for concern. When cooling is active since the beginning, most baryons have already cooled by (especially in relatively small halos). The effect of this overcooling is visible, for instance, in Fig. 6, where cooling rates in the example halos 0 and 1 hardly exceed the value of M⊙ yr-1. These deposition rates can translate at best into star formation rates of the same order, which would be typically lower than the several hundreds M⊙ yr-1 measured for massive star forming galaxies at the same redshift. In the COOLZ2 simulation, cooling rates are higher by a factor of when cooling is suddenly switched on. Feedback from massive stars and accreting black holes is responsible for limiting overcooling at high redshift, and this makes more gas available at lower redshift. Moreover, as commented in Section 4.2, halo mergers or, more likely, feedback from star formation and AGN will likely be responsible for episodic quenching of catastrophic cooling, so the setting of the COOLZ2 simulation may be a good approximation for cooling flows in massive halos at the peak of cosmic star formation, after a quenching event.
This is the first time that several cooling models run on the same merger trees are compared with a cosmological hydrodynamical simulation. Despite the simplified setting used in these simulations, we believe that they provide an important benchmark test for cooling models embedded in SAMs. Indeed, while energetic feedback from stars and AGN, which almost certainly plays a crucial role in shaping the properties of galaxies, is the most important contributor to the variance among model predictions (Fontanot et al., 2013), an accurate calibration of the condensation of gas in the central galaxy is desirable to remove unwanted sources of inaccuracies. Merger trees and results from the simulations presented in this paper are available to interested modelers upon request.
Acknowledgments
We thank Giuseppe Murante for his help in running the simulations and for discussions. We thank Volker Springel, Richard Bower and Michaela Hirschmann for their feedback on this paper. Simulations were run on SP6 at CINECA thanks to the ISCRA-B project “Radiative cooling in galaxy formation: a numerical benchmark test for galaxy formation models”. P.M. and S.B. acknowledge financial contributions from the European Commissions FP7 Marie Curie Initial Training Network CosmoComp (PITN-GA-2009-238356), from PRIN MIUR 2010-2011 J91J12000450001 “The dark Universe and the cosmic evolution of baryons: from current surveys to Euclid”, from PRIN-INAF 2009 “Towards an Italian Network for Computational Cosmology”, from ASI/INAF agreement I/023/12/0, from PRIN-MIUR09 “Tracing the growth of structures in the Universe” and from FRA2009 and FRA2012 grants of the Trieste University. GDL acknowledges financial support from the European Research Council under the European Community’s Seventh Framework Programme (FP7/2007-2013)/ERC grant agreement n. 202781. FF acknowledges financial support from the Klaus Tschira Foundation and the Deutsche Forschungsgemeinschaft through Transregio 33, “The Dark Universe”.
References
- Benson (2012) Benson, A. J. 2012, NewA, 17, 175, 1008.1786
- Benson et al. (2012) Benson, A. J., Borgani, S., De Lucia, G., Boylan-Kolchin, M., & Monaco, P. 2012, MNRAS, 419, 3590, 1107.4098
- Benson & Bower (2011) Benson, A. J., & Bower, R. 2011, MNRAS, 410, 2653
- Benson et al. (2003) Benson, A. J., Bower, R. G., Frenk, C. S., Lacey, C. G., Baugh, C. M., & Cole, S. 2003, ApJ, 599, 38, astro-ph/0302450
- Benson et al. (2001) Benson, A. J., Pearce, F. R., Frenk, C. S., Baugh, C. M., & Jenkins, A. 2001, MNRAS, 320, 261, astro-ph/9912220
- Binney (1977) Binney, J. 1977, ApJ, 215, 483
- Bower et al. (2006) Bower, R. G., Benson, A. J., Malbon, R., Helly, J. C., Frenk, C. S., Baugh, C. M., Cole, S., & Lacey, C. G. 2006, MNRAS, 370, 645, astro-ph/0511338
- Cattaneo et al. (2007) Cattaneo, A. et al. 2007, MNRAS, 377, 63, arXiv:astro-ph/0605750
- Cole et al. (2000) Cole, S., Lacey, C. G., Baugh, C. M., & Frenk, C. S. 2000, MNRAS, 319, 168, astro-ph/0007281
- Croton et al. (2006) Croton, D. J. et al. 2006, MNRAS, 365, 11, astro-ph/0508046
- Cui et al. (2012) Cui, W., Borgani, S., Dolag, K., Murante, G., & Tornatore, L. 2012, MNRAS, 423, 2279, 1111.3066
- De Lucia & Blaizot (2007) De Lucia, G., & Blaizot, J. 2007, MNRAS, 375, 2, arXiv:astro-ph/0606519
- De Lucia et al. (2010) De Lucia, G., Boylan-Kolchin, M., Benson, A. J., Fontanot, F., & Monaco, P. 2010, MNRAS, 406, 1533, 1003.3021
- Dekel & Birnboim (2006) Dekel, A., & Birnboim, Y. 2006, MNRAS, 368, 2, arXiv:astro-ph/0412300
- Duffy et al. (2010) Duffy, A. R., Schaye, J., Kay, S. T., Dalla Vecchia, C., Battye, R. A., & Booth, C. M. 2010, MNRAS, 405, 2161, 1001.3447
- Fakhouri & Ma (2008) Fakhouri, O., & Ma, C.-P. 2008, MNRAS, 386, 577, 0710.4567
- Fontanot et al. (2013) Fontanot, F., De Lucia, G., Benson, A. J., Monaco, P., & Boylan-Kolchin, M. 2013, ArXiv e-prints, 1301.4220
- Fontanot et al. (2011) Fontanot, F., Pasquali, A., De Lucia, G., van den Bosch, F. C., Somerville, R. S., & Kang, X. 2011, MNRAS, 413, 957, 1006.5717
- Haardt & Madau (1996) Haardt, F., & Madau, P. 1996, ApJ, 461, 20, arXiv:astro-ph/9509093
- Helly et al. (2003) Helly, J. C., Cole, S., Frenk, C. S., Baugh, C. M., Benson, A., Lacey, C., & Pearce, F. R. 2003, MNRAS, 338, 913, astro-ph/0202485
- Hirschmann et al. (2012) Hirschmann, M., Naab, T., Somerville, R. S., Burkert, A., & Oser, L. 2012, MNRAS, 419, 3200, 1104.1626
- Katz et al. (1996) Katz, N., Weinberg, D. H., & Hernquist, L. 1996, ApJS, 105, 19, arXiv:astro-ph/9509107
- Kereš et al. (2005) Kereš, D., Katz, N., Weinberg, D. H., & Davé, R. 2005, MNRAS, 363, 2, astro-ph/0407095
- Kereš et al. (2012) Kereš, D., Vogelsberger, M., Sijacki, D., Springel, V., & Hernquist, L. 2012, MNRAS, 425, 2027, 1109.4638
- Lu et al. (2011) Lu, Y., Kereš, D., Katz, N., Mo, H. J., Fardal, M., & Weinberg, M. D. 2011, MNRAS, 416, 660, 1008.1075
- Monaco et al. (2007) Monaco, P., Fontanot, F., & Taffoni, G. 2007, MNRAS, 375, 1189, astro-ph/0610805
- Monaco et al. (2013) Monaco, P., Sefusatti, E., Borgani, S., Crocce, M., Fosalba, P., Sheth, R. K., & Theuns, T. 2013, MNRAS, 433, 2389, 1305.1505
- Murante et al. (2012) Murante, G., Calabrese, M., De Lucia, G., Monaco, P., Borgani, S., & Dolag, K. 2012, ApJ, 749, L34, 1202.5212
- Nelson et al. (2013) Nelson, D., Vogelsberger, M., Genel, S., Sijacki, D., Kereš, D., Springel, V., & Hernquist, L. 2013, MNRAS, 429, 3353, 1301.6753
- Oser et al. (2010) Oser, L., Ostriker, J. P., Naab, T., Johansson, P. H., & Burkert, A. 2010, ApJ, 725, 2312, 1010.1381
- Planck Collaboration et al. (2013) Planck Collaboration et al. 2013, ArXiv e-prints, 1303.5076
- Reed et al. (2013) Reed, D. S., Smith, R. E., Potter, D., Schneider, A., Stadel, J., & Moore, B. 2013, MNRAS, 431, 1866, 1206.5302
- Rees & Ostriker (1977) Rees, M. J., & Ostriker, J. P. 1977, MNRAS, 179, 541
- Saro et al. (2010) Saro, A., De Lucia, G., Borgani, S., & Dolag, K. 2010, MNRAS, 406, 729, 1001.3115
- Scannapieco et al. (2012) Scannapieco, C. et al. 2012, MNRAS, 423, 1726, 1112.0315
- Somerville et al. (2008) Somerville, R. S., Hopkins, P. F., Cox, T. J., Robertson, B. E., & Hernquist, L. 2008, MNRAS, 391, 481, 0808.1227
- Springel (2005) Springel, V. 2005, MNRAS, 364, 1105, arXiv:astro-ph/0505010
- Springel (2010) ——. 2010, MNRAS, 401, 791, 0901.4107
- Springel et al. (2005) Springel, V. et al. 2005, Nature, 435, 629, astro-ph/0504097
- Springel et al. (2001) Springel, V., Yoshida, N., & White, S. D. M. 2001, New Astronomy, 6, 79, arXiv:astro-ph/0003162
- Srisawat et al. (2013) Srisawat, C. et al. 2013, ArXiv e-prints, 1307.3577
- Stanek et al. (2009) Stanek, R., Rudd, D., & Evrard, A. E. 2009, MNRAS, 394, L11, 0809.2805
- Sutherland & Dopita (1993) Sutherland, R. S., & Dopita, M. A. 1993, ApJS, 88, 253
- Thomas et al. (2005) Thomas, D., Maraston, C., Bender, R., & Mendes de Oliveira, C. 2005, ApJ, 621, 673, arXiv:astro-ph/0410209
- Tornatore et al. (2003) Tornatore, L., Borgani, S., Springel, V., Matteucci, F., Menci, N., & Murante, G. 2003, MNRAS, 342, 1025, arXiv:astro-ph/0302575
- Tweed et al. (2009) Tweed, D., Devriendt, J., Blaizot, J., Colombi, S., & Slyz, A. 2009, A&A, 506, 647, 0902.0679
- Viola et al. (2008) Viola, M., Monaco, P., Borgani, S., Murante, G., & Tornatore, L. 2008, MNRAS, 383, 777, 0710.2473
- White & Frenk (1991) White, S. D. M., & Frenk, C. S. 1991, ApJ, 379, 52
- Yoshida et al. (2002) Yoshida, N., Stoehr, F., Springel, V., & White, S. D. M. 2002, MNRAS, 335, 762, astro-ph/0202341