The X-ray emission of the high-mass X-ray binary \src
Abstract
The source IGR J17200–3116 was discovered in the hard X-ray band by INTEGRAL. A periodic X-ray modulation at 326 s was detected in its Swift light curves by our group (and subsequently confirmed by a Swift campaign). In this paper, we report on the analysis of all the Swift observations, which were collected between 2005 and 2011, and of an 20 ks XMM–Newton pointing that was carried out in 2013 September. During the years covered by the Swift and XMM–Newton observations, the 1–10 keV fluxes range from 1.5 to 10-11 erg cm-2 s-1. IGR J17200–3116 displays spectral variability as a function of the pulse phase and its light curves show at least one short (a few hundreds of seconds) dip, during which the flux dropped at 20–30% of the average level. Overall, the timing and spectral characteristics of IGR J17200–3116 point to an accreting neutron star in a high-mass system but, while the pulse-phase spectral variability can be accounted for by assuming a variable local absorbing column density, the origin of the dip is unclear. We discuss different possible explanations for this feature, favouring a transition to an ineffective accretion regime, instead of an enhanced absorption along the line of sight.
keywords:
X-rays: binaries – X-rays: individual: IGR J17200–3116 – X-rays: individual: CXOU J172005.9–311659 – X-rays: individual: 1RXS J172006.1–311702.1 Introduction
The source IGR J17200–3116 (Revnivtsev et al., 2004; Walter et al., 2004) was discovered in 2003 during a survey of the Galactic Centre region with INTEGRAL. The hard X-ray (18–60 keV) flux of IGR J17200–3116 was 1.6 mCrab, roughly corresponding to erg cm-2 s-1. Revnivtsev et al. (2004) and Stephen et al. (2005) pointed out that this new INTEGRAL source was the counterpart of the soft X-ray ROSAT point source 1RXS J172006.1–311702. Masetti et al. (2006) proposed an optical counterpart with a narrow H line and reddened continuum, suggesting a high-mass X-ray binary (HMXB) system. The association was fortified by Tomsick et al. (2008), who obtained a refined Chandra X-ray position.
More recently, our team reported on the discovery of a coherent modulation of the X-ray emission of IGR J17200–3116 at a period of 326 s (Nichelli et al., 2011). The signal was detected in a run of the Swift Automatic Timing ANAlysis of Serendipitous Sources at Brera And Roma astronomical observatories (SATANASS @ BAR) project. SATANASS @ BAR consists in a systematic Fourier-based search for new pulsators in the Swift X-ray data.111For our analogous Chandra project, the Chandra ACIS Timing Survey at Brera And Rome astronomical observatories (CATS @ BAR), see Esposito et al. (2013a, b); Esposito et al. (2013c). So far, about 4000 X-ray Telescope (XRT) light curves of point sources with a sufficiently high number of photons (150) were analysed and the effort yielded six previously unknown X-ray pulsators (including IGR J17200–3116, two other new pulsators were reported in Nichelli et al. 2009).
The original detection of the period of IGR J17200–3116 occurred in a couple of Swift consecutive observations performed in 2005 October 26–27. After that, more Swift observations were carried out between 2010 October and 2011 May to characterize better IGR J17200–3116. The period measured during the new Swift campaign was slightly longer (328 s; Nichelli et al. 2011, see also Section 3.1), indicating that the modulation reflects almost certainly the spin of a neutron star. Here we give more details on the Swift observations and we report on a 20-ks long XMM–Newton observation of IGR J17200–3116 performed on 2013 September 19, where we discovered an evident dip (a flux drop). While in low mass X-ray binaries these features are usually due to obscuring matter located in the outer accretion disc (see e.g. Díaz Trigo et al. 2006 for a review), in HMXBs they are probably produced by a transition to a different accretion regime (see Drave et al. 2013 and references therein). In Sections 2 and 3, we describe the X-ray observations used and present the results of our timing and spectral analysis. Discussion follows in Section 4, where we concentrate on the origin of a peculiar short off-state observed in IGR J17200–3116 with XMM–Newton.
2 Observations
| Mission / Obs. ID | Instrument | Date | Exposure | Net countsa |
|---|---|---|---|---|
| (ks) | ||||
| Swift / 00035088001 | XRT | 2005 Oct 26 | 6.3 | |
| Swift / 00035088002 | XRT | 2005 Oct 27 | 5.1 | |
| Swift / 00035088003 | XRT | 2010 Oct 22–23 | 10.5 | |
| Swift / 00035088004 | XRT | 2010 Oct 24 | 4.6 | |
| Swift / 00035088005 | XRT | 2010 Oct 27 | 5.3 | |
| Swift / 00035088006 | XRT | 2011 Feb 03 | 10.1 | |
| Swift / 00035088007 | XRT | 2011 Feb 05 | 3.7 | |
| Swift / 00035088008 | XRT | 2011 Feb 08 | 4.6 | |
| Swift / 00035088009 | XRT | 2011 Feb 13 | 3.1 | |
| Swift / 00035088010 | XRT | 2011 Feb 15 | 1.7 | |
| Swift / 00035088011 | XRT | 2011 Feb 20 | 3.8 | |
| Swift / 00035088012 | XRT | 2011 Feb 27–28 | 4.9 | |
| Swift / 00035088013 | XRT | 2011 Mar 27–28 | 6.9 | |
| Swift / 00035088014 | XRT | 2011 Apr 28 | 4.0 | |
| Swift / 00035088015 | XRT | 2011 May 16 | 5.2 | |
| EPIC-pn | 20.0 | |||
| XMM / 0723570201 | EPIC-MOS 1 | 2013 Sep 19 | 21.8 | |
| EPIC-MOS 2 | 21.7 |
-
a
Net source counts considering the source and background extraction regions described in the text. The counts are in the 0.3–10 keV band for the Swift XRT, in the 0.3–12 keV for the XMM–Newton MOS cameras, and in the 1.5–12 keV for the XMM–Newton pn camera.
2.1 Swift
IGR J17200–3116 was observed by Swift 15 times between 2005 October and 2011 May, for a total net exposure of 80.8 ks (see Table 1). The Swift XRT (Burrows et al., 2005) data were collected in imaging photon counting (PC) mode, with a CCD readout time of 2.507 s. The data were processed and reduced using standard software tools and procedures (heasoft v. 6.14 / caldb 20130313). The source photons were selected within a 20-pixel radius (1 XRT pixel 2.36 arcsec), while the background counts were accumulated from an annular region with radii of 50 and 80 pixels.
2.2 XMM–Newton
XMM–Newton observed IGR J17200–3116 on 2013 September 19 for about 21 ks. The pn CCD camera (Strüder et al., 2001) was set to operate in fast-timing mode (which achieves a time resolution of 0.03 ms by preserving only one-dimensional positional information), while the MOS 1 and MOS 2 CCD cameras (Turner et al., 2001) were run in small-window mode (time resolution: 0.3 s) and in full-frame mode (time resolution: 2.6 s), respectively. The data were processed and reduced using the XMM–Newton sas v. 13.5 and the ccf-rel-307 calibration release. The observation was affected by a few soft proton flares. The corresponding periods of high particle background were filtered out of the data using intensity filters and following the method described in De Luca & Molendi (2004).
To extract the pn source counts, we used a thin strip (10 pixels) centred on the source and with the length covering the entire readout streak. The background spectrum was extracted from two symmetric 5-pixel-wide strips aside the source. The pn data suffered from the recurrence of instrumental noise bursts, which are characteristic of the fast-timing mode (Burwitz et al., 2004). These noise bursts are short (0.1 s) and have a very distinctive spectrum (Burwitz et al., 2004), with a peak around 0.20–0.25 keV, few counts above 0.3 keV, and essentially no counts above 1.5 keV. Given this, we preferred not to apply another good time-interval filter to the pn data to exclude these events, since this would have severely reduced the counting statistics and degraded the quality of the pn light curves. Instead, we limited the pn analysis to photons with energy above 0.5 keV for the timing analysis and above 1.5 keV for the spectral analysis.222In the pn light curves the peaks produced by the noise flares disappear above 0.3–0.4 keV, and we checked that residual spurious counts do not impact the timing analysis or alter the folded profiles. Indeed, this is not to be expected, since the noise bursts have typical duration (0.1 s) much shorter than the period of IGR J17200–3116 and are aperiodic. For the spectral analysis we adopted a more conservative selection, since residual spurious counts, being concentrated in a narrow energy range, might build up features in the spectra (especially when integrated over long exposures), and the flares cannot be properly subtracted from a nearby background region, since they are spatially inhomogeneous in the CCD chip.
For the MOS 1, we accumulated the source counts from a circular region with radius of 40 arcsec. Owing to the small field of the central CCD (CCD #1) in small-window mode, the background was estimated from a circular region in CCD #7, at a distance of about 6.7 arcmin from IGR J17200–3116. The MOS 2 data are affected by pileup. For this reason, we extracted the source photons from an annulus around IGR J17200–3116, thus excluding the inner (piled-up) point spread function (PSF) core. We used 40 arcsec for the outer radius and 10 arcsec for the inner radius. The latter value was selected by fitting the PSF with a King function and using the sas task epatplot. The background was extracted from a circular region on the same chip as the source.
3 Analysis and results
3.1 Light curves and timing analysis
As already mentioned, the periodic modulation in the X-ray emission of IGR J17200–3116 was detected during a run of the SATANASS @ BAR project. Taking into account the whole sample of light curves analysed in the project (4000), the peak at about 326.3 s in the Fourier power spectrum (which was computed from the first two Swift observations, collected in 2005 October 25–26) was significant at a 3.6 confidence level. Two harmonics were present in the power spectrum and the pulsed fraction of the signal was approximately 30%. After the discovery of the periodicity, a Swift campaign was carried out to confirm the modulation and study the source. In Table 2, we report the periods measured in the Swift data (note that few adjoining observations were combined) by means of a analysis, together with the root-mean-square (rms) pulsed fractions.
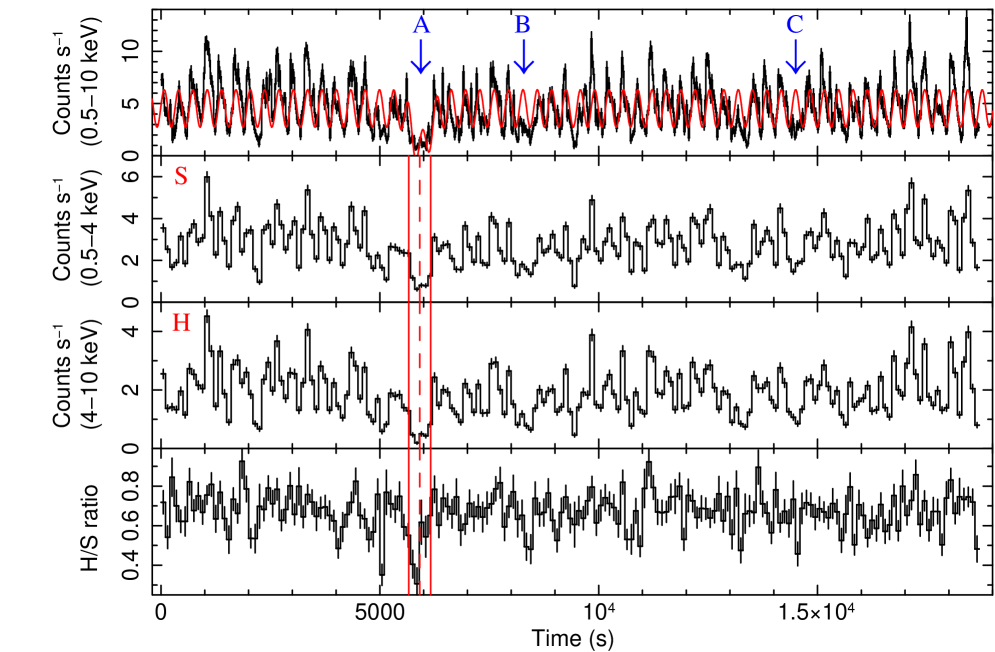
The combined EPIC pn and MOS light curves from the 2013 XMM–Newton observation are shown in Fig. 1 in the total (0.5–10 keV), soft (0.5–4 keV), and hard (0.5–4 keV) bands. The 328-s modulation is evident even without a folding analysis and the individual pulses have very variable amplitude. A dip, marked with the letter ‘A’, is apparent in the light curve roughly 6 ks after the observation start [ ks, where is fixed at 2013 September 19 03:41:12.8 (UTC)]. By a Gaussian fit, we estimated its full width at half-maximum (FWHM) length to be s (here and in the following, uncertainties are at 1 confidence level).
Two ‘missing pulses’ can be seen in the light curve around and 14.5 ks (they are marked with the letters ‘B’ and ‘C’ in Fig. 1). A similar feature is also present in the Swift observation 00035088002. While their short duration hinder a detailed analysis, they might be dips shorter than the ‘A’ one, but of similar origin.
The hardness ratio of IGR J17200–3116 as function of the time (Fig. 1, bottom panel) shows significant variations during the observation, as it is common in HMXBs (note that substantial hardness-ratio variations are observed also across the spin phase, see below). It is interesting to note that a sudden variation in the hardness ratio of IGR J17200–3116 occurred in coincidence of the dip ‘A’. On the other hand, other large variations, such as that observed around ks, do not find correspondence in clear lacks of pulsations.
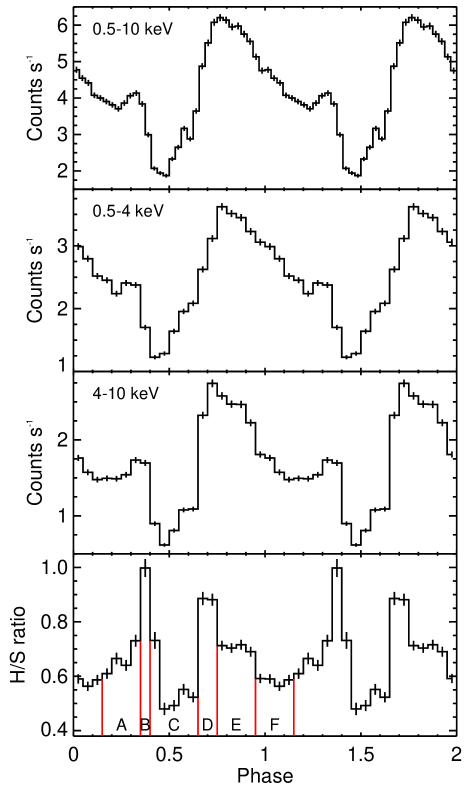
In the EPIC data, we measured a period of s in the periodogram. The folded pulse profile is shown in Fig. 2 in three energy bands. It is evident that the profile changes as a function of energy. The rms pulsed fraction measured in the total band is %, % in the soft band, and % in the hard band. For completeness, we computed the rms pulsed fractions also in finer energy bands: % in 0.5–2 keV; % in 2–3 keV; % in 3–4 keV; % in 4–5 keV; % in 5–6 keV; % in 6–7 keV; % in 7–8 keV; % in 8–9 keV; and % in 9–10 keV.
| Segmenta | Periodb | rms pulsed fractionb |
|---|---|---|
| (s) | (%) | |
| 2005 Oct 26–27 | ||
| 2010 Oct 22–27 | ||
| 2011 Feb 03–28 | ||
| 2011 Mar 27–28 | ||
| 2011 Apr 28 | ||
| 2011 May 16 | ||
| 2013 Sep 19 |
-
a
See Table 1.
-
b
Periods were derived from a test. Uncertainties were determined from Monte Carlo simulations.
3.1.1 Other recent X-ray observations
As mentioned before, IGR J17200–3116 was observed also by Chandra between 2007 September 30 and October 01 (obs. ID 7532, exposure time: 4.7 ks; Tomsick et al. 2008). The unabsorbed flux of IGR J17200–3116 was erg cm-2 s-1, causing significant pile-up in the Chandra ACIS-S instrument, which was operated in full-frame mode (frametime: 3.2 s). We searched the source data, considering a 2-arcsec radius region centred on IGR J17200–3116, for the 327 s signal in the 0.3–8 keV energy band, but no significant pulsations were found (see also Nichelli et al. 2011). After discarding the piled-up events from the core of the Chandra PSF, a signal at s could be recovered (with significance of 4) by a folding analysis carried out in a 10 s interval centred at 327 s. Because of the poor counting statistics (about 200 source photons), the pulsed fraction cannot be constrained.
In 2003–2004, IGR J17200–3116 was serendipitously observed several times by RXTE in a campaign devoted to the black hole X-ray transient XTE J1720–318 (see Brocksopp et al. 2005). In these observations, IGR J17200–3116 was always from the RXTE pointing direction. A signal around 325 s is detected by a folding analysis (in the interval s) of the data of the longest observations with the RXTE/PCA, which is a collimated instrument with a FWHM field of view of about 1∘. For instance, a period of s is observed on 2003 January 15 (obs. ID 70116-03-02-01, net exposure: 16.6 ks, 6 significance) and a period of s on 2003 February 20 (obs. ID 70123-01-03-07, net exposure: 9.8 ks, 5 significance). Considering the period variability observed in the Swift and XMM–Newton data (Table 2), these signals are likely due to IGR J17200–3116, but the non-imaging nature of the RXTE instruments preclude any definitive conclusions.
3.2 Spectral analysis
3.2.1 Phase-averaged and phase-resolved spectral analysis
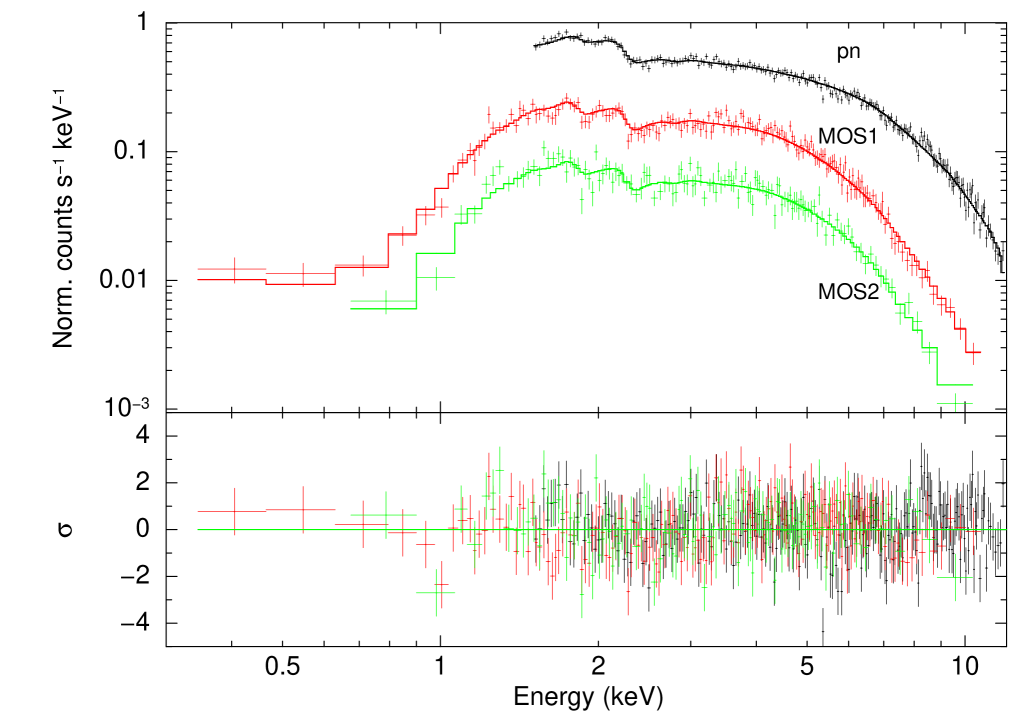
For the phase-averaged spectral analysis, we first concentrate on the high counting statistics XMM–Newton spectra. For the MOS spectra, we considered the energy range 0.3–12 keV, for the pn spectrum the band 1.5–12 keV (see Section 2.2). We fit to the EPIC spectra a set of models typically used for accreting pulsars (power law, power law plus blackbody, and cutoff power law, all modified for the photoelectric absorption). The summary of the spectral fits is given in Table 3. All models indicate a rather hard spectrum, an observed 1–10 keV flux of erg cm-2 s-1, and an absorbing column of – cm-2 (which is higher than the column density through the Galaxy along the line of sight, cm-2 from Kalberla et al. 2005). Apart from the power law, all the models tested fit reasonably well the XMM–Newton data, but the blackbody plus power-law is the one that provides the best fit. Two variants of this model are consistent with the data: a relatively cool blackbody with keV plus a power law with , or a hotter blackbody with temperature corresponding to 1.2 keV and a harder power with photon index 0.8. In the following, we adopt the latter model (see Fig. 3), which is better consistent with an HMXB interpretation of IGR J17200–3116 (see Section 4).
As shown in Fig. 2, where the pulse profiles in two energy bands (0.5–4 and 4–10 keV) and their ratio are displayed, the spectrum of IGR J17200–3116 is strongly variable with phase. In particular, the phase intervals marked with B and D in Fig. 2 show the hardest X-ray emission, while the phase minimum (interval C) appears to be significantly softer. The pn and MOS spectra of the six phase intervals selected with the hardness ratio were extracted using the same procedure as for the average spectrum and fit with an absorbed power-law plus blackbody model (the one with keV in Table 3). Forcing all the parameters to assume the same values for all the spectra, except for an overall normalization factor, a rather poor fit is obtained ( for 2016 dof), with large residuals at low energies. An acceptable fit ( for 2011 dof) is instead obtained by letting the absorption free to vary in each spectrum (even though this is not the only possible choice). The best-fitting values (in units of cm-2 and assuming the abundances from Wilms, Allen & McCray 2000) for each phase interval are the following: , , , , , and for phase A, B, C, D, E, and F, respectively.
3.2.2 Spectral analysis of the dip
An indication of spectral variability of the source during the main dip (‘A’) clearly emerges from the hardness ratio curve shown in Fig. 1. In particular, in the first part of the dip the source hardness reaches its minimum value. To better study this peculiar source state, we extracted the pn and MOS spectra from the full time interval of the dip (from about s to s), its first and second half, and fit them with the best-fitting power law plus blackbody model (with keV, see Table 3), rescaled by a normalization factor.333We note that a meaningful spectral analysis of the other possible dips (including the Swift one) is prevented by the very low number of counts.
Despite the limited counting statistics (202 background-subtracted counts), the initial spectrum cannot be satisfactorily fit by this simple model ( for 7 dof). Acceptable fits to the initial spectra are instead obtained with a variable absorption ( cm-2 at 3; for 6 dof) or changing the parameters of either the power law (; for 5 dof) or blackbody component ( keV; for 5 dof). The 1–10 keV unabsorbed fluxes are erg cm-2 s-1 for the fit with free , erg cm-2 s-1 for the fit with free power-law component, and erg cm-2 s-1 in the case of free blackbody component.
In contrast, the spectrum of the second part of the dip (260 background-subtracted counts) and that extracted from the entire dip are adequately fit by the model of the phase-averaged spectrum with fixed parameters ( for 9 dof and for 23 dof, respectively). The unabsorbed 1–10 keV flux is erg cm-2 s-1 when averaged along the whole dip length, and erg cm-2 s-1 in the second part of the dip. We also tested the possibility of a complete suppression of the power-law component during the dip by fitting the corresponding spectrum with an absorbed blackbody model with and temperature fixed at the best-fitting values of the power law plus (hot) blackbody fit to the average spectrum (Table 3). This fit is not acceptable ( for 23 dof) and shows systematic residuals at high energies, indicating the presence of a harder spectral component.
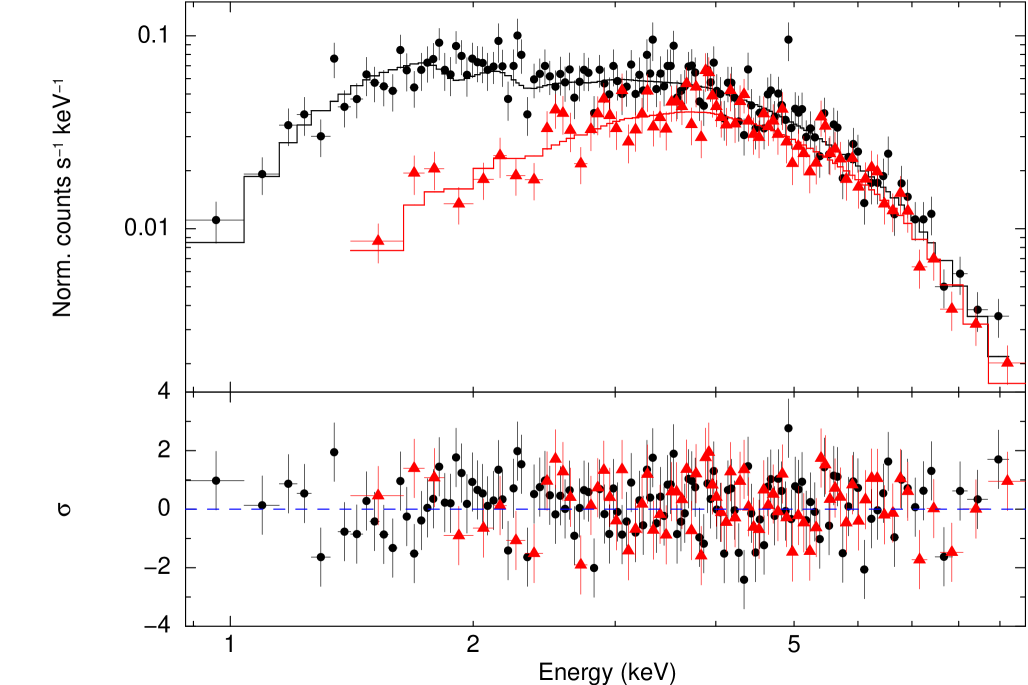
The Swift spectra of the individual observations, collected over 6 years (see Table 1), can be all described by a simple power law modified for the interstellar absorption.444Although models more complicated than a photoelectrically absorbed power law are necessary to properly fit the high-counting-statistics XMM–Newton data, the addition of extra components did not improve the goodness of fit significantly for any of the Swift observations. Also considered that the emission of IGR J17200–3116 is variable, we opted to stick to this simple model to compare the spectral properties from Swift data set to data set. They show, however, substantial variability in both flux and spectral shape (see Fig. 4). In order to investigate whether changes in the absorbing column might account for part of the variations, we performed a simultaneous fit of the 15 Swift spectra with free and normalizations, and the photon index tied between all the data sets. Indeed, they can be fit by a simple power law ( for 763 dof) with photon index and varying from 1.9 to cm-2 (see Fig. 5). We note that an almost as good fit is obtained when the hydrogen column value is tied between all observations and the other parameters are left free to vary ( for 763 dof); in this case, the derived is cm-2 and the photon index ranges from 0 to 1.2.
| Modela | b | c | c | d | Fluxe | Unabs. fluxe | (dof) | |
|---|---|---|---|---|---|---|---|---|
| ( cm-2) | (keV) | (keV) | (km) | ( erg cm-2 s-1) | ||||
| phabs (pl) | – | – | – | 1.29 (509) | ||||
| phabs (cutoffpl) | – | – | 1.19 (508) | |||||
| phabs (highecut * pl) | – | 1.14 (507) | ||||||
| phabs (bb + pl) | – | 1.12 (507) | ||||||
| phabs (bb + pl) | – | 1.12 (507) | ||||||
-
a
xspec models; bb = bbodyrad, pl = powerlaw.
- b
-
c
: cutoff energy; : -folding energy.
-
d
The blackbody radius is calculated at infinity and for an arbitrary distance of 5 kpc.
-
e
In the 1–10 keV energy band.
4 Discussion
We reported on an in-depth characterization at X-rays of the source IGR J17200–3116, both from the temporal and the spectral point of view. Pulsations, originally discovered by our group in Swift data and reported by Nichelli et al. (2011), have been recovered in an archival Chandra observation, and clearly observed in the new XMM–Newton/EPIC data analysed in detail here, with a periodicity of s. Such a long pulse period is typical of a neutron star in an HMXB. In fact, an early-type companion is also indicated by optical studies (Masetti et al., 2006) and by the precise Chandra position (Tomsick et al., 2008). Both a Be (main sequence or giant) star and a blue supergiant are viable possibilities for the companion star of IGR J17200–3116. Unfortunately, for Masetti et al. (2006) it was not possible to derive significant information about the optical counterpart (spectral type, absorption and source distance), since a reliable photometry was missing. From the Corbet diagram of X-ray-pulsar spin period versus orbital period (Corbet, 1986), the observed pulse period suggests an orbital period of either 3–30 d or 100–200 d for an HMXB hosting either a supergiant donor or a Be, respectively. Strong pulse to pulse variations (usually produced by fluctuations in the wind accreted by the neutron star) and a pulse profile energy dependence are evident in IGR J17200–3116, as it is often observed in accreting pulsars with massive donors.
The hard XMM–Newton spectrum (power-law photon index in the range 0.8–1.2) is in line with an HMXB origin for the X-ray emission. The presence of a soft component is indicated by the X-ray spectroscopy. The spectrum is well fit by a blackbody emission together with a hard power law. While both a colder ( keV) and a hotter ( keV) blackbody are valid deconvolution of the spectrum, we favour the hot solution, which is consistent in temperature and size ( km, where is the distance in units of 5 kpc) with an HMXB interpretation of the hot blackbody as produced in the polar cap region of the neutron star accretion column (Becker & Wolff, 2007).
The strong variability of the spin-phase-selected spectra (Fig. 2, bottom panel) can be accounted for by a variable absorbing column density along the spin cycle, probably mapping a different density of the local matter illuminated by the X-ray beam pattern. Significant variations (up to a factor of 4) in the absorbing column density are also present in the long-term X-ray light curve (Fig. 5). Variations in the local absorption are usual in HMXBs because the compact object is constantly embedded in an intense structured and clumpy wind. Moreover, in a few cases, large-scale structures have been observed in HMXBs (gas streams) and interpreted as the result of the disruption of the wind by the neutron star passage, which produce density perturbations that modulate the observed along the orbital cycle (Blondin et al., 1990; Manousakis & Walter, 2011).
We observed a remarkable feature in the EPIC light curve, a dip or a so-called off-state, characterized by a reduction in the source intensity down to 20–30% of its normal level, and lasting for about one neutron star spin cycle. Similar features have been seen so far only in a few HMXB pulsars with supergiant companions and are potentially important to derive information on the accretion regime and the neutron star properties: Vela X–1 (orbital period d and spin period s; Inoue et al. 1984; Kreykenbohm et al. 1999, 2008), 4U 1907+09 ( d and s; Doroshenko et al. 2012), GX 301–2 ( d and s; Göğüş, Kreykenbohm & Belloni 2011), and in the Supergiant Fast X-ray Transients IGR J16418–4532 ( d and s; Drave et al. 2013), and IGR J17544–2619 ( d and candidate s; Drave et al. 2014). During these off-states, X-ray pulsations sometimes appear to be suppressed (Kreykenbohm et al., 1999), sometimes are still detected (Doroshenko, Santangelo & Suleimanov, 2011), and the X-ray spectrum softens. This implies that these dips are not caused by the obscuration by a dense wind clump passing our line of sight to the pulsar, but are due to a real flux drop. Göğüş et al. (2011) suggested that softer X-rays during these dips are likely due to the suppression of the harder X-ray emission produced in the accretion column, leaving visible the soft X-rays coming from the underlying thermal mound at the bottom of the accretion column (Becker & Wolff, 2007). The reason for a suppression (or cessation) of the hard X-rays produced in the accretion column is unclear. Aside from temporarily enhanced absorption along the line of sight, three main explanations for off-states have been proposed: a temporary transition to a centrifugal inhibition of the accretion (see e.g. Kreykenbohm et al. 2008 for Vela X–1), a Kelvin–Helmholtz (KH) instability (Doroshenko et al., 2012), or an accretion regime change from a Compton cooling regime (producing a higher luminosity) to a radiative cooling regime (lower luminosity) in the equatorial plane of the neutron star magnetosphere, due to a switch from fan beam to pencil beam emission pattern (Shakura et al., 2013).
Also in IGR J17200–3116, the significantly softer spectrum during the off-state leads us to exclude the possibility of an obscuration of the central source by a wind structure (or clump), which would cause instead a spectral hardening. The small duration of the dip (a little more than a spin cycle) does not allow us to establish if the remaining fainter emission is pulsating, so a centrifugal barrier temporarily halting accretion, could be a possibility, although the short duration of the off-state makes it unlikely (Göğüş et al., 2011). In IGR J17200–3116, the spectrum during the dip cannot be completely accounted for only by an unvarying blackbody emission (this is ruled out by the marked spectral variability), and significant (power-law-like) hard X-ray emission is present, suggesting that in our case accretion is not suppressed in contrast, again, to what is expected with the onset of a propeller regime.


A transition to accretion via KH instability is discussed by Doroshenko et al. (2012) as a possible explanation of dips in the transient source 4U 1907+09, following the theory of wind accretion in HMXBs surveyed by Bozzo, Falanga & Stella (2008). In the framework of the different accretion regimes discussed by Bozzo et al. (2008), the magnetospheric boundary at the Alfvén radius, , can be KH unstable in two regimes: in the sub-Keplerian magnetic inhibition regime (where , where is the accretion radius, is the corotation radius, where the neutron star angular velocity is equal to the Keplerian angular velocity), and in the subsonic propeller regime (where ). The spin period of 328 s implies a corotation radius, , of cm. Thus, in both regimes, represents an upper limit to the value of the other two important radii involved. The relation (, where is the neutron star mass, and is the relative velocity of the neutron star and the companion wind) translates into a lower limit for of 2200 km s-1, which is, on average, quite high in comparison with usual HMXBs, but it cannot be excluded, given the large variability expected in inhomogeneous winds of massive stars (Oskinova, Feldmeier & Kretschmar, 2012).
Adopting equation 21 in Bozzo et al. (2008) for the X-ray luminosity produced by matter entering the magnetosphere through KH instability in the subsonic propeller regime, all the parameters involved in this formula are basically unknown for IGR J17200–3116, except for the neutron star spin period. However, we can derive an upper limit to by assuming the following: , an orbital period of 5 d (which is reasonable for an accreting pulsar with a supergiant companion and the observed spin period; Corbet 1986) and a total mass for the binary system of 30 M⊙ (implying in equation 21 in Bozzo et al. 2008), a relative velocity of 2200 km s-1 ( in equation 21 in Bozzo et al. 2008), a wind mass-loss rate of M⊙ yr-1, a density ratio [where and are the internal (below ) and the external densities (above )], and for the efficiency factor. This translates into erg s-1, which can easily be accounted for if one assumes a reasonable distance to the source (see below). Note that the upper limit to the Alfvén radius, , results in an upper limit to the dipolar magnetic field of G ( G cm3; equation 19 in Bozzo et al. 2008). Again, we caution that all these estimates rely on particular (though reasonable) assumptions on all other parameters involved in the system geometry and wind properties. Even larger uncertainties are involved in the estimate of the KH instability mass accretion rate across the magnetosphere in the sub-Keplerian magnetic inhibition regime, where also the shear velocity is involved. Assuming the same values as above for the parameters in equation 10 in Bozzo et al. (2008), we derive erg s-1.
A third possible explanation for off-states involves the application of the Shakura et al. (2012) model of subsonic quasi-spherical accretion on to moderately low luminosity ( erg s-1) and slowly rotating neutron stars. Here, off-states are explained by transitions to an ineffective accretion regime, rather than with a cessation of the accretion. In this scenario, an off-state is the signature of a transition from a regime where the cooling of the gravitationally captured plasma entering the neutron star magnetosphere is dominated by Compton processes to a less efficient radiative cooling regime (Shakura, Postnov & Hjalmarsdotter, 2013). This transition might be triggered by a change in the X-ray beam pattern, from a fan beam to a pencil beam, produced by a reduced optical depth in the accretion flow. Since matter enters the neutron star magnetosphere more easily from the equatorial region, a high lateral X-ray luminosity by a fan beam directly illuminating the equator, allows a more efficient Compton cooling, facilitating accretion and thus resulting in a higher luminosity. So, a transition from a fan to a pencil X-ray beam pattern increases the Compton cooling time, triggering a lower luminosity state (an off-state). The transition back to the normal X-ray luminosity can be triggered by an enhanced density above the magnetosphere, increasing the accretion rate. The transition to an off-state occurs at an X-ray luminosity of about erg s-1, where G cm is the neutron star dipole magnetic moment. The luminosity level in the off-state is about erg s-1 in the radiation cooling regime (Shakura et al., 2013).
The average unabsorbed 1–10 keV flux of IGR J17200–3116 during the XMM–Newton observation varies, depending on the adopted model (see Table 3), from to erg cm-2 s-1. Nothing is known about the distance of IGR J17200–3116, which could be anywhere towards the edge of the Galaxy. At 5 kpc, the former flux translates into a luminosity of erg s-1, the latter into erg s-1 (where is the distance in units of 5 kpc). Above erg s-1, the quasi-spherical shell cannot exist and supersonic (Bondi) accretion is more likely, but this would require a distance kpc. This implies that, for reasonable source distances in the range 5–10 kpc, the X-ray emission easily matches the X-ray luminosity needed to trigger the switch to an off-state, assuming a standard neutron star magnetic field of G.
To conclude, the observed spectral softening during the dip (which is common in similar off-states observed in other HMXBs) is more naturally explained by a transition to an ineffective accretion regime, instead of an obscuring dense clump in front of the X-ray source (which would have implied an hardening). However, given the unknown distance, the different possibilities for the transition to an inefficient accretion regime discussed above cannot be clearly disentangled.
Acknowledgements
Based on observations obtained with Swift and XMM–Newton. Swift is a NASA mission with participation of the Italian Space Agency and the UK Space Agency. XMM–Newton is an ESA science mission with instruments and contributions directly funded by ESA Member States and NASA. This research has also made use of data collected with the Chandra and RXTE satellites, which were obtained from the NASA’s HEASARC archive.
References
- Balucinska-Church & McCammon (1992) Balucinska-Church M., McCammon D., 1992, ApJ, 400, 699
- Becker & Wolff (2007) Becker P. A., Wolff M. T., 2007, ApJ, 654, 435
- Blondin et al. (1990) Blondin J. M., Kallman T. R., Fryxell B. A., Taam R. E., 1990, ApJ, 356, 591
- Bozzo et al. (2008) Bozzo E., Falanga M., Stella L., 2008, ApJ, 683, 1031
- Brocksopp et al. (2005) Brocksopp C., Corbel S., Fender R. P., Rupen M., Sault R., Tingay S. J., Hannikainen D., O’Brien K., 2005, MNRAS, 356, 125
- Burrows et al. (2005) Burrows D. N. et al., 2005, Space Sci. Rev. 120, 165
- Burwitz et al. (2004) Burwitz V., Haberl F., Freyberg M. J., Dennerl K., Kendziorra E., Kirsch M. G. F., 2004, in Flanagan K. A., Siegmund O. H. W., eds, Proc. SPIE Conf. Ser. Vol. 5165, X-Ray and Gamma-Ray Instrumentation for Astronomy XIII. SPIE, Bellingham, p 123
- Corbet (1986) Corbet R. H. D., 1986, MNRAS, 220, 1047
- De Luca & Molendi (2004) De Luca A., Molendi S., 2004, A&A, 419, 837
- Díaz Trigo et al. (2006) Díaz Trigo M., Parmar A. N., Boirin L., Méndez M., Kaastra J. S., 2006, A&A, 445, 179
- Doroshenko et al. (2012) Doroshenko V., Santangelo A., Ducci L., Klochkov D., 2012, A&A, 548, A19
- Doroshenko et al. (2011) Doroshenko V., Santangelo A., Suleimanov V., 2011, A&A, 529, A52
- Drave et al. (2014) Drave S. P., Bird A. J., Sidoli L., Sguera V., Bazzano A., Hill A. B., Goossens M. E., 2014, MNRAS, 439, 2175
- Drave et al. (2013) Drave S. P., Bird A. J., Sidoli L., Sguera V., McBride V. A., Hill A. B., Bazzano A., Goossens M. E., 2013, MNRAS, 433, 528
- Esposito et al. (2013c) Esposito P., Israel G. L., Sidoli L., Mapelli M., Zampieri L., Motta S. E., 2013c, MNRAS, 436, 3380
- Esposito et al. (2013a) Esposito P., Israel G. L., Sidoli L., Mason E., Rodríguez Castillo G. A., Halpern J. P., Moretti A., Götz D., 2013a, MNRAS, 433, 2028
- Esposito et al. (2013b) Esposito P., Israel G. L., Sidoli L., Rodríguez Castillo G. A., Masetti N., D’Avanzo P., Campana S., 2013b, MNRAS, 433, 3464
- Göğüş et al. (2011) Göğüş E., Kreykenbohm I., Belloni T. M., 2011, A&A, 525, L6
- Inoue et al. (1984) Inoue H., Ogawara Y., Waki I., Ohashi T., Hayakawa S., Kunieda H., Nagase F., Tsunemi H., 1984, PASJ, 36, 709
- Kalberla et al. (2005) Kalberla P. M. W., Burton W. B., Hartmann D., Arnal E. M., Bajaja E., Morras R., Pöppel W. G. L., 2005, A&A, 440, 775
- Kreykenbohm et al. (2008) Kreykenbohm I. et al., 2008, A&A, 492, 511
- Kreykenbohm et al. (1999) Kreykenbohm I. Kretschmar P., Wilms J., Staubert R., Kendziorra E., Gruber D. E., Heindl W. A., Rothschild R. E., 1999, A&A, 341, 141
- Manousakis & Walter (2011) Manousakis A., Walter R., 2011, A&A, 526, A62
- Masetti et al. (2006) Masetti N. et al., 2006, A&A, 459, 21
- Nichelli et al. (2009) Nichelli E., Israel G. L., Moretti A., Campana S., Bernabei S., Mason E., Götz D., Stella L., 2009, Astron. Telegram, 2354
- Nichelli et al. (2011) Nichelli E., Israel G. L., Moretti A., Campana S., Götz D., Stella L., 2011, Astron. Telegram, 3205
- Oskinova et al. (2012) Oskinova L. M., Feldmeier A., Kretschmar P., 2012, MNRAS, 421, 2820
- Revnivtsev et al. (2004) Revnivtsev M. G. et al., 2004, Astron. Lett., 30, 382
- Shakura et al. (2013) Shakura N., Postnov K., Hjalmarsdotter L., 2013, MNRAS, 428, 670
- Shakura et al. (2012) Shakura N., Postnov K., Kochetkova A., Hjalmarsdotter L., 2012, MNRAS, 420, 216
- Stephen et al. (2005) Stephen J. B. et al., 2005, A&A, 432, L49
- Strüder et al. (2001) Strüder L. et al., 2001, A&A, 365, L18
- Tomsick et al. (2008) Tomsick J. A., Chaty S., Rodriguez J., Walter R., Kaaret P., 2008, ApJ, 685, 1143
- Turner et al. (2001) Turner M. J. L. et al., 2001, A&A, 365, L27
- Walter et al. (2004) Walter R. et al., 2004, Astron. Telegram, 229, 1
- Wilms et al. (2000) Wilms J., Allen A., McCray R., 2000, ApJ, 542, 914