Gender Asymmetries in Reality and Fiction: The Bechdel Test of Social Media.
This is a preprint of a paper
to appear at ICWSM’14 http://www.icwsm.org/2014/index.php.
Please cite the conference proceedings when referencing this work.
Gender Asymmetries in Reality and Fiction:
The Bechdel Test of Social Media.
Abstract
The subjective nature of gender inequality motivates the analysis and comparison of data from real and fictional human interaction. We present a computational extension of the Bechdel test: A popular tool to assess if a movie contains a male gender bias, by looking for two female characters who discuss about something besides a man. We provide the tools to quantify Bechdel scores for both genders, and we measure them in movie scripts and large datasets of dialogues between users of MySpace and Twitter. Comparing movies and users of social media, we find that movies and Twitter conversations have a consistent male bias, which does not appear when analyzing MySpace. Furthermore, the narrative of Twitter is closer to the movies that do not pass the Bechdel test than to those that pass it.
We link the properties of movies and the users that share trailers of those movies. Our analysis reveals some particularities of movies that pass the Bechdel test: Their trailers are less popular, female users are more likely to share them than male users, and users that share them tend to interact less with male users. Based on our datasets, we define gender independence measurements to analyze the gender biases of a society, as manifested through digital traces of online behavior. Using the profile information of Twitter users, we find larger gender independence for urban users in comparison to rural ones. Additionally, the asymmetry between genders is larger for parents and lower for students. Gender asymmetry varies across US states, increasing with higher average income and latitude. This points to the relation between gender inequality and social, economical, and cultural factors of a society, and how gender roles exist in both fictional narratives and public online dialogues.
March 25th, 2013
1 Introduction
Gender inequality manifests in objective phenomena, such as salary differences and inequality in academia [Larivière et al.(2013)], but it also contains a large subjective component that is not trivial to measure. The philosophical works of Simone de Beauvoir describe how gender inequality is formulated on top of the concept that women are less rational and more emotional than men [De Beauvoir(1949)]. This points to the subjective and subconscious component of gender inequality, which prevents many individuals from assessing their own gender biases in their everyday behavior. To a great extent, gender inequality is exercised but not consciously reflected upon, creating a pattern of biases that everyone experiences but nobody names [Friedan(1963)]. Gender bias, as part of the culture and ideology of a society, manifest in subconscious behavior and in the fictions created and consumed by that society [Žižek(1989)]. The emerging field of culturomics aims at a quantitative understanding of culture at a large scale, first being applied to cultural trends in literature [Michel et al.(2011)], but also applicable to other traces of human culture such as voting in song contests [Garcia and Tanase(2013)], search trends [Preis et al.(2012)], and movies [Danescu-Niculescu-Mizil and Gamon(2011)].
In 1985, Alison Bechdel published the comic strip named “The Rule”, in which a female character formulates her rules to be interested in watching a movie: It has to contain at least two women in it, who talk to each other, about something besides a man [Bechdel(1985)]. While intended as a punchline about gender roles in commercial movies, it served as an inspiration to critically think about the role of women in fiction. Such formulation of a test for gender biases became popularly know as the Bechdel test111en.wikipedia.org/wiki/Bechdel_test, and is usually applied to analyze tropes in mass media222www.youtube.com/watch?v=bLF6sAAMb4s. Whether a movie passes the test is nothing more than an anecdote, but the systematic analysis of a set of movies can reveal the gender bias of the movie industry. The Bechdel test is used by Swedish cinemas as a rating to highlight a male bias, in a similar manner as it is done with violence and nudity. Previous research using this test showed gender bias when teaching social studies [Scheiner-Fisher and Russell(2012)], and motivated the application of computational approaches to analyze gender roles in fiction [Lawrence(2011)].
The current volume of online communication creates a record of human interaction very similar to a massive movie, in which millions of individuals leave digital traces in the same way as the characters of a movie talk in a script. This resemblance between reality and fiction is the base of the theory of behavioral scripts [Bower et al.(1979)], used to analyze subconscious biases through patterns of social interaction [Shapiro(2010)]. For example, linguistic coordination appears in both movie scripts [Danescu-Niculescu-Mizil and Gamon(2011)], and Twitter dialogues [Danescu-Niculescu-Mizil and Lee(2011)]. Furthermore, bidirectional interaction in Twitter has been proved useful for computational social science, testing theories about the assortativity of subjective well-being [Bollen et al.(2011)], about cognitive constraints like Dunbar’s number [Goncalves et al.(2011)], and about conventions and social influence in Twitter [Kooti et al.(2012)]. Gender roles in emotional expression appear in MySpace dialogues [Thelwall et al.(2009)], and gender-aligned linguistic structures have been found in Facebook status updates [Schwartz et al.(2013)]. One of our aims is to compare the patterns of dependence across genders in movies and online dialogues, assessing the question of whether our everyday life, as pictured in our online interaction, would be close to passing the Bechdel test or not.
Large datasets offer the chance to analyze human behavior at a scale and granularity difficult to achieve in experimental or survey studies. At the scale of whole societies, digital traces allow the analysis of cultural features, such as future orientation through search trends [Preis et al.(2012)], and the similarity between cultures through song contest votes [Garcia and Tanase(2013)]. At the level of individual behavior, online datasets allowed the measure of intrinsic biases, such as that we tend to use more positive than negative words [Garcia et al.(2012)], that we have a tendency to share information with strong emotional content [Pfitzner and Garas(2012)], and that apparently irrelevant actions, such as Facebook likes, reveal relevant patterns of our personality [Kosinski et al.(2013)].
We introduce a quantitative extension of the Bechdel test, to measure female and male independence in the script of a movie and the digital dialogues of a population. We calculate these metrics based on the amounts of dialogues between individuals of the same gender that do not contain references to the other gender. In our approach, we keep a symmetric analysis of male and female users and characters, quantifying asymmetries without any presumed point of view. We combine these metrics with information about geographic location, personal profile, and movies viewed by groups Twitter users, to take one step further in understanding the conditions under which gender biases appear. We test the role of climate in the gender stereotypes of a culture, as suggested by previous works that found a relation between the future orientation and the geographic location of a culture [Zimbardo and Boyd. John(2008)]. Similarly as the ability to plan ahead is encouraged by adverse climate, it can also encourage gender biases in which males behave more independently and less emotionally attached. We test this theory, known as the disposable male [Farrell(1996)], through the hypothesis that male independence increases with distance to the equator. Additionally, we explore the relation between economic factors and female independence, measuring the relation between the average income of states of the US and the gender independence of its female Twitter users.
The centralized nature of movies plays a key role in the persistence of gender inequality in a society, which is part of the concept of cultural hegemony [Lears(1985)]. This case is particularly important in movies aimed at children, which are known to have a gender bias that disempowers female characters [Pollitt(1991)]. On the other hand, the lack of central control in the content of online media offers the chance of gender unbiased interaction, as conjectured by cyberfeminist theories [Hawthorne and Klein(1999), Fox et al.(2006)]. In this article, we quantify the presence of these biases in dialogues from movies and Twitter, testing if these patterns prevail in online communication or are only present in mass media.
2 Analytical Setup
To assess the questions mentioned above, we require three main datasources: references from social media to movies, movie script information, and dialogues involving the users that shared information about the movies. Furthermore, we need a set of tools to process these datasets in order to identify the gender of users and actors, to detect gender references from social media messages and movie lines, and to group them into dialogues over which we can analyze gender asymmetries. In the following, we outline our datasources and the methods we used for our analysis.
2.1 Movie scripts, trailers and Bechdel test data
From an initial dataset of YouTube videos [Abisheva et al.(2014)], we extracted a set of 16,142 videos with titles that contain the word “trailer” or “teaser”, among the categories of Movies and Entertainment. Removing trailer related terms, we matched these videos to titles of movies in the Open Movie Database333www.omdbapi.com/ (OMDB), selecting the pairs in which the string similarity between the titles was above 80%. After a manual inspection of the results, our dataset contained 704 trailers for 493 movies in 2,970 Twitter shares. In addition, we had the amount of views, likes, and dislikes for these trailers, as retrieved in June, 2013.
We downloaded scripts from the Internet Movie Script Database444www.imsdb.com/ as text files with the content of each movie, similarly to previous works [Danescu-Niculescu-Mizil and Lee(2011)]. To disambiguate the title of each movie on the site, we first automated a search through OMDB, matching the title of each movie with the IMDB identifier of the first result, filtering when title string similarity was above 80% and the year of release differed in no more than one year. Once each movie script was in text form, we identified character lines and scene cuts using the standard syntax used to process screenwriting markup languages, as used by screenwriting software like Fountain555fountain.io/syntax. We constructed dialogues between characters following the sequence of their lines, and using the scene cuts as additional explicit separators between dialogues. Second, we developed a set of python scripts to download the Bechdel test results form bechdeltest.com, in a similar manner as previously done for visualization purposes666http://bit.ly/1c3QF1g. We gathered Bechdel test data for 470 movies with an unique IMDB identifier, processing the information in bechdeltest.com to extract two values: a test result indicating how many rules of the test are passed by a movie (from 0 to 3), and an amount of disagreements in the comments of the users of the site.
2.2 MySpace and Twitter dialogue retrieval
Using the service provided by Gnip, we collected a set of public tweets from the period between June 1st and 6th, 2013. Using the list of YouTube videos mentioned above, we found a set of 536,835 users that shared at least one of the trailers in our dataset. From among those users, we extracted their location information, which we matched with Yahoo! Placemaker777developer.yahoo.com/boss/geo/ to select those in the US. As a result, we got 69,606 ego users in the US that shared at least one trailer. For each one of these users, we retrieved their history of tweets with a limitation of 3,200 tweets per user, and their lists of followers and followees with the limitation of 5,000 users in each list. From this set of friendships, we identified those that interacted with the users in our database if they exchanged at least 10 mentions. Filtering by US location again, we extended this set of users with an additional 107,645 alter users, for which we also got up to 3,200 of their most recent tweets. This composes a track of the recent history of interactions between more than 170,000 users, over which we constructed dialogues based on the more than 300 million tweets they wrote. We complement this Twitter dataset with a set of MySpace messages provided in previous research [Thelwall et al.(2009)], covering conversations of users in the US and the UK.
We constructed a network of dialogues between Twitter users, based on the mentioning functionality of @-tags. For each tweet, we know its text, the user that created it, the time of creation, and the users that were mentioned in it. The full track of tweets between two users composes a set of dialogues, in which the users talked about different topics at various moments in time. There is no explicit sign in the tweets between two users that indicates the beginning and the end of a dialogue, which motivates the application of heuristics [Danescu-Niculescu-Mizil and Lee(2011)] and semantic-based machine learning methods [Ritter et al.(2010)].
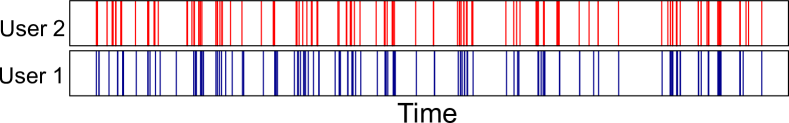
For our case, we use the theory of bimodality in human communication [Wu et al.(2010)], which states that there are two modes in the interaction between pairs of people: an intra-burst mode in which messages follow each other in a dialogue after very short periods, and an inter-burst mode of long silences between dialogues. Figure 1 shows an example of the timestamps of the tweets exchanged between a pair of Twitter users. The head of the distribution of times between messages of a pair of users follows a power-law close to for time intervals in , and the tail is closer to an exponential distribution of the form for . Note that this bimodal definition is different than a power-law with exponential cutoff, which is typically used to control for finite-size effects [Clauset et al.(2009), Wu et al.(2010)]. The cutoff time gives us an estimate of the time scale of correlations inside a dialogue. We estimated its value in MySpace and Twitter through a modified version of the maximum likelihood technique for power-laws [Clauset et al.(2009)], correcting for the fact that the fit is to the head and not the tail of the distribution. This method minimizes the Kolmogorov-Smirnov criterion of distribution equality giving power-law exponents of in Twitter and in MySpace, very close to previous empirical studies of this kind of distributions in IRC channels [Garas et al.(2012)]. This method allowed us to compute estimates of the cutoff value between both distributions, which are of 9.1 hours in Twitter and 7.7 hours in MySpace.
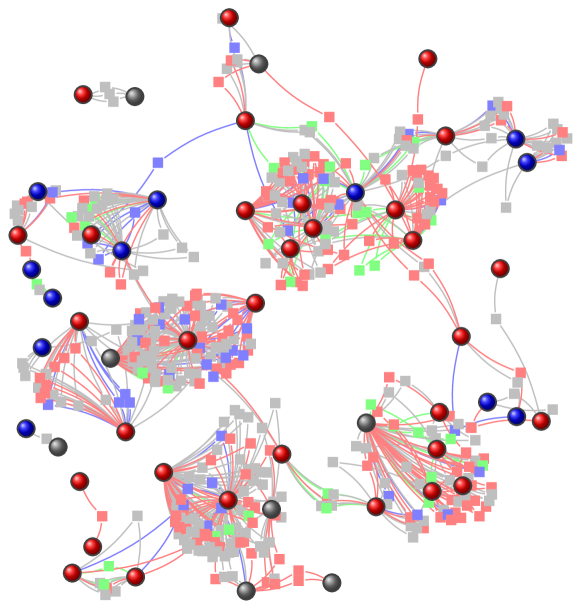
We used the time cutoffs to separate dialogues, applying the rule that times of silence longer that the cutoff indicate the end of a dialogue. As a result, our Twitter dataset is composed of 2,240,787 dialogues and the MySpace dataset of 3,263 dialogues. An illustration of a subnetwork of the resulting data is Figure 2, where we show the dialogues between Twitter users that declared to live in Ann Arbor, Michigan.
2.3 Profile information processing
We retrieved demographic information from the Twitter profile of each user, looking for keywords that signal personal information, as done in previous research [Mislove et al.(2011), Pennacchiotti and Popescu(2011)]. This way, we identify the users as likely father, mother, or student if they include terms related to parenthood or studying in their profile. Their location information allowed us to find their city and state within the US, which we matched versus the list of the 100 largest cities in the US 888www.city-data.com/top1.html to identify urban and rural users. We identified the gender of a user through first name matching against the history of names in the US999www.ssa.gov/oact/babynames/limits.html, classifying the gender of a user in the same way as previously done for Twitter [Mislove et al.(2011)] and for authors of research papers [Larivière et al.(2013)].
For each movie, we gathered the cast list from IMDB, and then we looked for the terms “actor” and “actress” in the IMDB profile of the actors playing each character, which determines their gender [Danescu-Niculescu-Mizil and Lee(2011)]. This data is not only useful to determine the genders of the characters in our movie dataset, but also serve as a ground truth to evaluate the dictionary technique we used for Twitter users. In total, we found 4,970 actors and 2,486 actresses, with 154 unknown (writers and directors). We applied the above gender detection technique, which gave us the unknown gender class 33% of the time. Note that these actors and actresses do not need to live in the US, and that can have artistic names like “Snopp Dogg”, who appears in our dataset. Precision values are 0.894 for detecting males and 0.844 for detecting females, and recall values are 0.582 for males and 0.595 for females. The similarity in these values indicates that this tool does not introduce a bias that changes the ratio of male and female users. Nevertheless, improvements are possible, not only in the lexica, but also introducing machine learning techniques that find more complicated naming patterns [Pennacchiotti and Popescu(2011)].
2.4 Detection of gender references
We modify the above gender detection technique to find which dialogues include male and female references. First, we modified the gender lexica used above, filtering out English dictionary words, like “Faith”, and toponyms. Second, we disambiguated the gender of names that can appear in both genders by the frequency of appearance in each gender in the US. If a name is used for a gender at least than 5 times more often than for the other gender, we assign it to the lexicon of the gender with the highest frequency, or we remove it otherwise. Second, we add common feminine words like “her”, and masculine words like “him”. For each dialogue composed by a set of tweets, this technique will classify as containing references to males, females, both, or none depending on the presence of common words and names associated each gender.
In our study, we apply this technique for a very particular subset of dialogues, aiming only at the decision whether male-male dialogues contain female references, and whether female-female dialogues contain male references. To provide an initial validation beyond intuition, we set up a small experiment to estimate the quality of the method. We extracted a random set of 100 dialogues between male Twitter users that were classified as containing female references and 100 as not containing them, and a random set of 100 dialogues between female users that were classified as containing female references and 100 as not containing them. Manual annotation using third party evaluations gave us an approximation of the ground truth, under the impossibility of surveying the actual users involved in the dialogues.
| Problem | Pre. (1) | Rec. (1) | Pre. (0) | Rec. (0) |
|---|---|---|---|---|
| f in D(M,M) | 0.69 | 0.986 | 0.99 | 0.76 |
| m in D(F,F) | 0.8 | 0.964 | 0.97 | 0.83 |
Table 1 shows the results of this validation. Recall values for finding cross-gender references in male-male and female-female dialogues are very high: i.e. the dictionary method tends not to miss many true gender references. Precision value for finding female references is lower due to misunderstanding surnames as first names, or outliers in the meaning of words, like “Marylin Manson”. The higher precision of male reference detection implies that it is more likely that the tool makes a mistake when tagging a male-male dialogue as not having female references than its female counterpart. This means that the tool introduces certain bias that lowers the amount of detected dialogues between males that do not contain female references, which indicates that our findings of a generalized larger male independence are robust to the precision of our tools.
3 The Bechdel Score
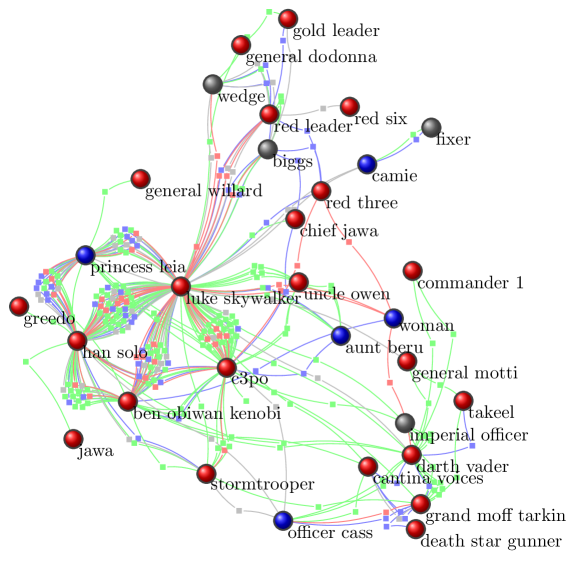
After processing the movie scripts, each movie corresponds to a network in which characters are connected through dialogues. Figure 3 shows as an example the network extracted from the script of the first Star Wars movie. For each movie, we have a set of dialogues , where each dialogue is a tuple , in which and are the genders of the characters in the dialogue ( for male, for female, and for unknown), and and are binary values set to 1 if the dialogue includes a male reference or a female reference respectively, and 0 otherwise. We define the set of dialogues of a movie with certain values in the tuple as . For example, all the dialogues between pairs of female characters that do not contain references to any gender are .
To quantify the level of independence of one gender from the other, we define a score metric that can be computed for each gender. We calculate the female Bechdel score of a movie as the ratio of dialogues between female characters that do not contain male references, over the whole set of dialogues of a movie, and its male counterpart :
| (1) |
where the in the equation represents any possible value for the variable. We quantify the extent of the asymmetry between genders displayed in a movie through the comparison of and . In the example of Figure 3, many male characters dialogue with each other, and some of these interactions do not contain female references (red or gray). Our method detected the presence of 5 female characters, and the absence of any dialogue in which two of these female characters talk to each other, giving a female Bechdel score of 0.
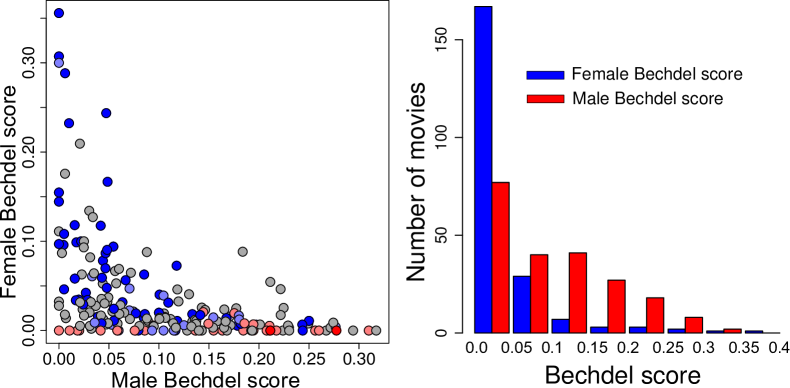
We computed the values of and for the set of 213 movies in our dataset, as shown in the left panel of Figure 4. Point colors correspond to the results of the Bechdel test in bechdeltest.com, coloring gray the movies that do not appear on the website, or that have disagreements in the user comments. Dark blue dots are movies that pass the Bechdel test (), which populate the area above . The line where or very low is populated with movies that do not pass the Bechdel test, some of them which do not even have two female characters ().
Both measures, the Bechdel test and the Bechdel score, are subject to certain degree of uncertainty. The precise value of the Bechdel score is subject to a certain heuristic component introduced by the gender identification technique, as explained in the analytical setup section. On the other hand, the manual annotation of the Bechdel test often has disagreements, as the test contains a set of implicit assumptions about which characters should be included and what constitutes a dialogue. Nevertheless, there is a clear relation between our computation of Bechdel scores and the manual annotations of the Bechdel test: Wilcoxon tests show that movies that pass the test have higher by 0.026, () and lower by 0.051 ().
The density of points in the area with low reveals that there is a generalized bias towards less independence of female characters. This effect becomes clear in the distributions of and , as shown in the right panel of Figure 4. Male Bechdel scores are higher than female Bechdel scores, with a difference between medians of 0.07 (). This confirms the observation that movies in English tend to portray female characters as more dependent on male characters than vice versa.
The videos of the trailers for these 213 movies provide information about their popularity in terms of their amount of views, likes, and dislikes. We tested the equality of the distribution of these popularity values for the set of movies that pass and do not pass the Bechdel test. We found that movies that do not pass the test have more views in their trailers, with a difference between medians of about 265,000 views (). They also receive more likes, as the difference between the median amount of likes is 329 (), but the hypothesis that they contain the same amount of dislikes could not be rejected (). This points to the fact that movies with a male gender bias are more popular in YouTube than those that show a more symmetric view of gender interdependence.
4 Gender Roles in Movies and Social Media
We computed Bechdel scores for the MySpace and Twitter datasets, creating a bootstrap partition of the set of dialogues into subsets of the same size as the average movie (225). For each of these samples, we computed and , estimating this way the size and uncertainty in the gender bias present in each online medium.
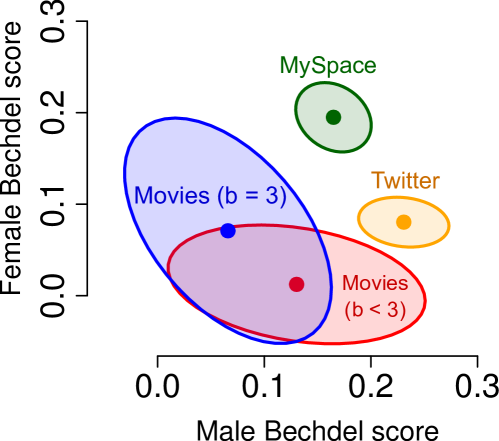
Figure 5 shows a comparison with the same procedure applied to movies that pass () and do not pass the Bechdel test (), computing the centroid and standard deviation in the space of both Bechdel scores. An initial observation reveals that Twitter has a strong bias towards male independence, being closer to movies that do not pass the test. To verify this, we computed Wilcoxon distances between the Bechdel scores in MySpace, Twitter, and the two sets of movies, reported in Table 2. Weighting both Bechdel scores equally, Twitter has a smaller Euclidean distance to movies that do not pass the test (0.127) than those that pass it (0.18).
One of the reasons why Twitter has such large male Bechdel score is the uneven ratio of users of each gender. In line with previous research [Mislove et al.(2011)], 64% of the users in our dataset are male. In order to use social media data to analyze societies at large, we need to account the unequal volumes of activity and presence of each gender. For this reason, we decompose the Bechdel score in two metrics: dialogue imbalance to measure the difference in activity between both genders, and gender independence to estimate the real fraction of dialogues that do not contain references to the other gender in a larger population.
We define female dialogue imbalance as the likelihood that one endpoint of a discussion is a male user, given that the other endpoint is female. The male extension of this metric is the male dialogue imbalance , computed as the ratio of male-male dialogues over all dialogues that involve males:
| (2) |
Assuming that Twitter gives us a sample of conversations with unequal gender ratios, but taken from a society with equal amount of male and female individuals, we can rescale our computation to Bechdel scores into gender independence ratios. We define female gender independence and male gender independence as the ratio of dialogues that do not include male references from among female-female dialogues, and the ratio of dialogues that do not include female references from among male-male dialogues:
| (3) |
Through these metrics, given a sufficiently large sample of dialogues, we can estimate the degree of independence of one gender with respect to the other, as articulated in their dialogues in social media.
| Euclidean Distance | |||
| 0.035 | 0.179 | 0.18 | |
| 0.075 | 0.103 | 0.127 | |
| MySpace | Euclidean Distance | ||
| 0.146 | 0.112 | 0.184 | |
| 0.18 | - | 0.18 |
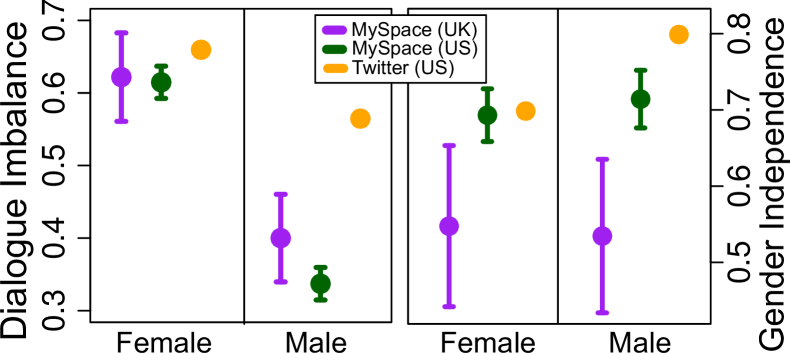
The MySpace dataset was constructed in a balanced way, downloading dialogues from similar amounts of male and female users. The left panel of Figure 6 shows that the value of above 0.5 and of below 0.5 reveals a pattern of disassortativity in which users of different genders tend to interact, revealing the use of MySpace for dating at the time of the crawl [Thelwall et al.(2009)]. The high ratio of male users in Twitter is captured by the dialogue imbalance metric, which shows the large likelihood for a dialogue to involve a male. For this reason, both and are above 0.5, indicating that the large male Bechdel score of Twitter is due to this size difference.
The right panel of Figure 6 shows the male and female gender independence ratios, for both MySpace datasets (UK and US) and Twitter. While in MySpace these independence ratios were similar for males and females, the male independence in Twitter is significantly larger than its female counterpart. This shows that the asymmetry between the independence of male and female users of Twitter remains, even when we control for the amount of gender-aligned dialogues. This implies a clear bias towards male independence in Twitter, despite of not being centrally controlled by any agent. This is not the case for MySpace, where tests of equality of proportions did not allow us to conclude any differences in and . This points to the limited size of the MySpace dataset, which is not a limitation for our Twitter dialogues dataset. We require large datasets to measure and , which is the reason why they are not applicable to individual movies or small samples from social media.
5 Relating Asymmetry in Movies and Twitter
After name matching between YouTube Trailers and movies, our Twitter dataset contains 1,741 trailer shares made my male users and 588 by female users. Out of those movies, we have Bechdel test information for 662 shares from male users and 294 shares from female users. For a subset of those movies we also have script information and Bechdel scores, accounting for 264 shares from males and 86 shares from females. From those users, we compute and in their ego network, if they participate in at least 25 dialogues. In the following, we show the relation between the gender biases present in a movie, measured through Bechdel test results and Bechdel scores, and the ratios of each gender of the users and their dialogue imbalance.
The female Bechdel score of the movies in shares from female users are in general larger than those shared by male users. A Wilcoxon test comparing both distributions rejects the hypothesis that they are the same (). The distance between medians is , which is a relevant size in the scale, indicating that shares from female users are about movies with 45.5% higher than in shares by male users. The opposite pattern with male Bechdel scores was not significant () to conclude that male or female Twitter users shared movies with higher .
The numeric value of the Bechdel test () of movies in shares from female users had a larger value than those on the shares by male users (), revealing that women share movies that pass more rules of the Bechdel test. Furthermore, a share from a female user is more likely to be about a movie that passes all three rules of the Bechdel test. We computed the ratio of shares about movies that pass the test from all shares from women, and the same among the shares from men. A test on these ratios indicates that women are more likely to share movies that pass the Bechdel test (), by an increase of 0.12, 30% more than the likelihood for male users. This relation can be seen in the left panel of Figure 7, where we show the fraction of shares about movies with certain Bechdel test value, over all the shares from male and female users. The most striking difference is at 3, pointing to the higher chances that female users share movies that pass the test.
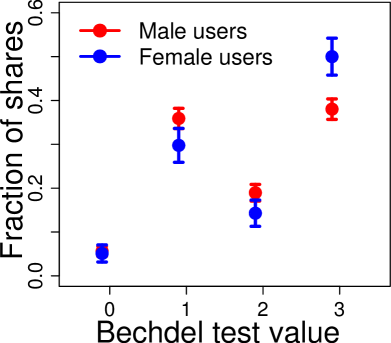
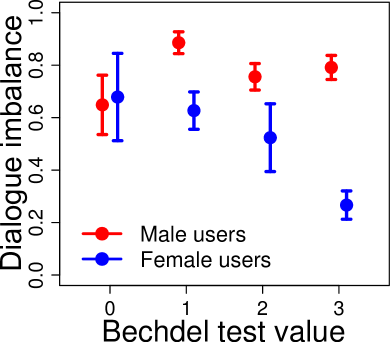
We computed the dialogue imbalance of the users sharing each movie trailer, and compared them across genders and across movies that pass or not the test. The dialogue imbalance of female users that share movies that pass the Bechdel test is lower than for female users sharing movies that do not pass the test (). This was not the case for male users (), showing no relation between Bechdel test results and the behavior of male Twitter users. Across genders, the difference between and for the users that share movies that pass the Bechdel test is significant (), and of magnitude 0.42 on the total dialogue imbalance scale. This difference is not significant among males and females that share movies that do not pass the test (), indicating that there is a shift away from interaction with men in the population of women that share movies that pass the test. The right panel of Figure 7 shows this effect, where and diverge when computed over the dialogues in users that shared movies that pass the Bechdel test. This analysis shows that there are relations between the behavior of female Twitter users and the movies they consume and share, but male users do not show any variation with respect to the portrayal of female roles in these movies.
6 Profile Factors in Gender Independence
The information displayed in Twitter profiles allowed us to extract two variables of the personal life of a user: if they mentioned in their profile that they are mothers or fathers and whether they are students. We use this information to analyze the gender independence present in dialogues between users of a particular kind, in comparison with the rest of dialogues present in Twitter.
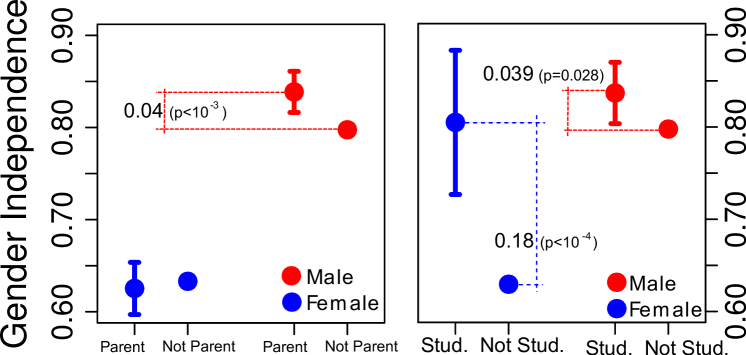
There is no significant difference in when comparing dialogues between mothers and the rest of female-female dialogues. On the other hand, fathers showed a significantly higher male gender independence, as shown in the left panel of Figure 8. This indicates that publicly articulated dialogues between fathers tend to mention women less often. The gender independence in the discussions between pairs of two male students and two female students have higher values of and , when compared to dialogues between users not identified as students. The right panel of Figure 8 shows that the difference between Female students and the rest is very large, to the point of not having any significant difference with between male students. The gender asymmetries we find in the Twitter population are not evident among students, suggesting that gender roles are less prominent within that subset of the population.
7 Geographical factors
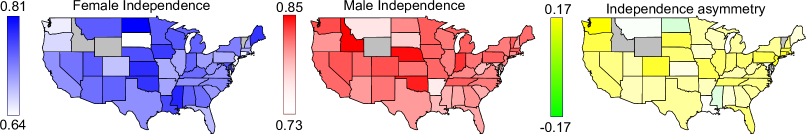
The location information of each Twitter user allows us to build the networks for all the users located in each state of the United States. An example of this kind of filtering is Figure 2, where only the users located in Ann Arbor are displayed. This way, for each state we have a set of dialogues, which we use to measure male and female gender independence. Figure 9 show and of each state in the continuous United States, as well as gender asymmetry computed as . It is noticeable that most of the states have positive asymmetry, with the exception of Hawaii, Mississippi, Montana, and North Dakota.
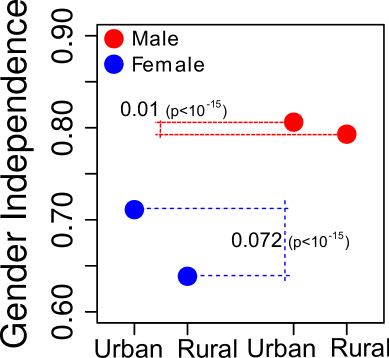
Given the location of each user, we tag them as urban if they live in one of the largest 100 cities of the United States, and rural if they live in a smaller city, as explained in the analytical setup section. Figure 10 shows and for discussions between urban users and between rural users. Both male and female urban users show larger gender independence, but this difference is stronger between urban and rural females. Nevertheless, is still significantly lower than in the urban Twitter population.
Finally, we investigate the relation between other economic and geographic factors with both and . From the national census, we gathered average income of each state, and the Gini index of income inequality. For each state, we also located the latitude and longitude of the largest city, measured in seconds West from the Greenwich meridian and North from the Equator, in order to test the role of economy and climate in female and male independence.
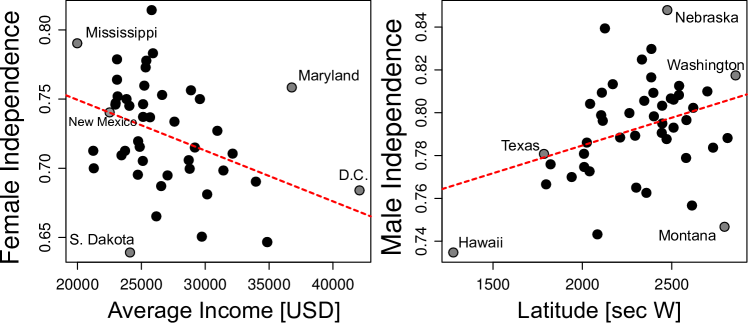
has a correlation coefficient with average income of and , stronger than with any other metric including male independence. To evaluate if this result is a confound with any other metric, we calculated partial Pearson correlation coefficients where is average income and is each of the other variables (, Gini index, latitude and longitude). All partial correlations were negative and significant, being the least significant when controlling for Gini index ( ). This shows that the dialogues between females in US states with higher income are more likely to include male references. The left panel of Figure 11 shows the scatter plot of these values. The outliers of Figure 11 call for a closer analysis of the statistical properties and robustness of our results. A Shapiro-Wilk test of normality on does not allow us to reject the null hypothesis that it is normally distributed (), but the opposite is true for average income (). For this reason, we replicate the above correlation analysis by computing Spearman’s correlation coefficient, which tests for a monotonous relation, by reducing the leverage of outliers through a rank transformation of the data. Spearman’s correlation between and average income was significant and negative (, ).
Male independence is correlated with latitude, with a correlation coefficient of (). The same partial correlations analysis as with reveals positive and significant correlations when controlling for all the other factors. The least significant of these is when controlling for average income (, ), showing that latitude is the most related factor with male independence. As shown in the right panel of Figure 11, states that are farther from the equator have male dialogues that are less likely to contain female references. Normality tests for and latitude did not provide evidence that they are not normally distributed, as Shapiro-Wilk tests did not reject the null hypothesis for both () and latitude (). Nevertheless, we tested the statistical robustness of our finding by computing Spearman’s correlation between and latitude, finding a significant positive correlation of ().
8 Discussion
We presented a study that combines data from movie scripts, trailers, and casts, and Twitter and MySpace users, including their profile information and the dialogues among them. We designed a set of metrics to measure gender biases in the sets of dialogues in movies and social media, to explore the relations between gender roles in fiction and reality. Starting from an equal approach to male and female independence in movies, we verified the existence of a generalized bias in which female characters are shown as dependent on male characters. Furthermore, the trailers of male biased movies are more popular, and the movies shared by Twitter users are related to their profiles and patterns of interaction. While we did not find a difference for male users, female users are more likely to share movies with high female Bechdel scores, and to interact less with with male users if they share movies that pass the Bechdel test. This indicates that female Twitter users are attracted to movies in which women are shown less dependent on men, but also that the audiences might be starting to be aware of the results of the Bechdel test itself.
We compare the gender biases in Twitter and MySpace with our metrics for movies, finding that Twitter contains a male bias not only in amount of users, but also in a lower degree of female gender independence. This points to the possibility that some design decisions of Twitter might create undesired effects [Goodman and Vertesi(2012)], such as hindering female users to engage in the community in the same way as males do. In addition, the biases present in public dialogues in Twitter are not radically different from those in movies. The decentralized nature of Twitter has not led to a gender unbiased interaction with respect to mass media, and the asymmetric pattern of lower female gender independence is also present in everyday online public interaction. This similarity between reality and fiction can be explained by two mechanisms: i) the gender roles present in fiction, including movies, influence our behavior and gender bias, or ii) movies reflect patterns of gender dependence present in real life. It is also possible that there is a combination of both mechanisms, in which a feedback loop makes movies reflect certain gender bias in everyday life, but also perpetuate gender inequality through the influence of movies in human culture. In any case, such subconscious biases are a component of ideology and contribute to the creation of inequality at a large scale [Shapiro(2010)], in the same way as very small racial preferences can lead to segregation [Schelling(1971)]. We find that certain personal factors are related to the gender independence of Twitter users. This is particularly strong as we did not find evidence for a presence of gender bias among students, and we found urban users to be more gender independent that rural ones, especially for women.
We calculated gender independence values across states in the US, finding a generalized pattern of asymmetry towards lower female independence. We found a significant correlation between male independence and latitude that is consistent with the theory of the disposable male, which predicates that males behave more independently due to the presence of adverse conditions, including climate. However, this result is constrained to US states, and further work on a wider range of societies is necessary to understand the relation between climate and gender asymmetries. In addition, we found a negative relation between female gender independence and average income, counter intuitively to the concept that female emancipation increases the workforce and the productivity of a society. Note that our finding is structural, not measuring changes in average income or GDP due to changes in female independence, and that they are consistent with the observation that richer countries show larger gender bias in scientific production [Larivière et al.(2013)]. One possible explanation lies in the difference between the political discourse regarding gender independence and the subjective behavior of a society: labeling oneself as liberal in gender policies does not necessarily imply an absence of a gender bias in everyday behavior. On the other hand, this result also points to the role of Twitter in society, as publicly articulated dialogues might emphasize certain ideals of gender equality in the places where they are needed the most. All these questions are empirically testable in future research, in particular if focused on individual income and education levels, world views, and gender biases quantified in observed behavior.
9 Acknowledgements
The authors would like to acknowledge Gnip for providing data on Twitter activity. DG was funded by the Swiss National Science Foundation (CR21I1_1464991).
References
- [Abisheva et al.(2014)] Abisheva, A.; Garimella, V. R. K.; Garcia, D.; Weber, I. (2014). Who Watches ( and Shares ) What on YouTube ? And When ? Using Twitter to Understand YouTube Viewership. In: WSDM’14. New York.
- [Bechdel(1985)] Bechdel, A. (1985). The Rule. In: Dykes to Watch Out For.
- [Bollen et al.(2011)] Bollen, J.; Gonçalves, B.; Ruan, G.; Mao, H. (2011). Happiness is assortative in online social networks. Artificial life 17(3), 237–51.
- [Bower et al.(1979)] Bower, G. H.; Black, J. B.; Turner, T. J. (1979). Scripts in memory for text. Cognitive psychology 11(2), 177–220.
- [Clauset et al.(2009)] Clauset, A.; Shalizi, C. R.; Newman, M. E. J. (2009). Power-Law Distributions in Empirical Data. SIAM Review 51(4), 661.
- [Danescu-Niculescu-Mizil and Gamon(2011)] Danescu-Niculescu-Mizil, C.; Gamon, M. (2011). Mark My Words ! Linguistic Style Accommodation in Social Media. In: WWW’11.
- [Danescu-Niculescu-Mizil and Lee(2011)] Danescu-Niculescu-Mizil, C.; Lee, L. (2011). Chameleons in imagined conversations : A new approach to understanding coordination of linguistic style in dialogs. In: ACL ’11.
- [De Beauvoir(1949)] De Beauvoir, S. (1949). The Second Sex.
- [Farrell(1996)] Farrell, W. (1996). The myth of male power.
- [Fox et al.(2006)] Fox, M. F.; Johnson, D. G.; Rosser, S. V. (2006). Women, gender, and technology. University of Illinois Press.
- [Friedan(1963)] Friedan, B. (1963). The Feminine Mystique.
- [Garas et al.(2012)] Garas, A.; Garcia, D.; Skowron, M.; Schweitzer, F. (2012). Emotional persistence in online chatting communities. Scientific Reports 2, 402.
- [Garcia et al.(2012)] Garcia, D.; Garas, A.; Schweitzer, F. (2012). Positive words carry less information than negative words. EPJ Data Science 1(1), 3.
- [Garcia and Tanase(2013)] Garcia, D.; Tanase, D. (2013). Measuring Cultural Dynamics Through the Eurovision Song Contest. Advances in Complex Systems (Forthcoming) .
- [Goncalves et al.(2011)] Goncalves, B.; Perra, N.; Vespignani, A. (2011). Validation of Dunbar’s number in Twitter conversations. PLoS ONE 6(8), e22656.
- [Goodman and Vertesi(2012)] Goodman, E.; Vertesi, J. (2012). Design for X?: distribution choices and ethical design. In: CHI’12 Extended Abstracts on Human Factors in Computing Systems. ACM, pp. 81–90.
- [Hawthorne and Klein(1999)] Hawthorne, S.; Klein, R. (1999). Cyberfeminism: Connectivity, critique and creativity. Spinifex Press.
- [Kooti et al.(2012)] Kooti, F.; Gummadi, K. P.; Mason, W. A. (2012). The Emergence of Conventions in Online Social Networks. In: ICWSM’12.
- [Kosinski et al.(2013)] Kosinski, M.; Stillwell, D.; Graepel, T. (2013). Private traits and attributes are predictable from digital records of human behavior. PNAS 110(15), 5802–5.
- [Larivière et al.(2013)] Larivière, V.; Ni, C.; Gingras, Y.; Cronin, B.; Sugimoto, C. R. (2013). Bibliometrics: Global gender disparities in science. Nature 504(7479), 211–213.
- [Lawrence(2011)] Lawrence, K. F. (2011). SPARQLing Conversation: Automating The Bechdel-Wallace Test. In: Narrative and Hypertext.
- [Lears(1985)] Lears, T. J. J. (1985). The Concept of Cultural Hegemony: Problems and Possibilities. American Historical Review 90(3), 567–593.
- [Michel et al.(2011)] Michel, J.-B.; Shen, Y. K.; Aiden, A. P.; Veres, A.; Gray, M. K.; Pickett, J. P.; Hoiberg, D.; Clancy, D.; Norvig, P.; Orwant, J.; Pinker, S.; Nowak, M. A.; Aiden, E. L. (2011). Quantitative analysis of culture using millions of digitized books. Science 331(6014), 176–82.
- [Mislove et al.(2011)] Mislove, A.; Lehmann, S.; Ahn, Y.-Y.; Onnela, J.-P.; Rosenquist, J. N. (2011). Understanding the Demographics of Twitter Users. In: ICWSM ’11. pp. 554–557.
- [Pennacchiotti and Popescu(2011)] Pennacchiotti, M.; Popescu, A.-m. (2011). A Machine Learning Approach to Twitter User Classification. In: ICWSM’11. pp. 281–288.
- [Pfitzner and Garas(2012)] Pfitzner, R.; Garas, A. (2012). Emotional divergence influences information spreading in Twitter. In: ICWSM’12. pp. 2–5.
- [Pollitt(1991)] Pollitt, K. (1991). Hers; The Smurfette Principle. The New York Times.
- [Preis et al.(2012)] Preis, T.; Moat, H. S.; Stanley, H. E.; Bishop, S. R. (2012). Quantifying the advantage of looking forward. Scientific reports 2, 350.
- [Ritter et al.(2010)] Ritter, A.; Cherry, C.; Dolan, B. (2010). Unsupervised modeling of Twitter conversations , 172–180.
- [Scheiner-Fisher and Russell(2012)] Scheiner-Fisher, C.; Russell, W. B. (2012). Using Historical Films to Promote Gender Equity in the History Curriculum. The Social Studies 103(6), 221–225.
- [Schelling(1971)] Schelling, T. C. (1971). Dynamic models of segregation†. Journal of mathematical sociology 1(2), 143–186.
- [Schwartz et al.(2013)] Schwartz, H. A.; Eichstaedt, J. C.; Kern, M. L.; Dziurzynski, L.; Ramones, S. M.; Agrawal, M.; Shah, A.; Kosinski, M.; Stillwell, D.; Seligman, M. E. P.; Ungar, L. H. (2013). Personality, gender, and age in the language of social media: the open-vocabulary approach. PloS one 8(9), e73791.
- [Shapiro(2010)] Shapiro, E. (2010). Gender circuits: Bodies and identities in a technological age. Routledge.
- [Thelwall et al.(2009)] Thelwall, M.; Wilkinson, D.; Uppal, S. (2009). Data mining emotion in social network communication: Gender differences in MySpace. Journal of the American Society for Information Science and Technology 61(1), 1–10.
- [Žižek(1989)] Žižek, S. (1989). The Sublime Object of Ideology. 240 pp.
- [Wu et al.(2010)] Wu, Y.; Zhou, C.; Xiao, J.; Kurths, J.; Schellnhuber, H. J. (2010). Evidence for a bimodal distribution in human communication. PNAS 107(44), 18803–8.
- [Zimbardo and Boyd. John(2008)] Zimbardo, P.; Boyd. John (2008). The time paradox: The new psychology of time that will change your life.