Lyman continuum galaxies and the escape fraction of Lyman break galaxies
Abstract
Lyman break galaxies (LBGs) at 3–4 are targeted to measure the fraction of Lyman continuum (LyC) flux that escapes from high redshift galaxies. However, 3–4 LBGs are identified using the Lyman break technique which preferentially selects galaxies with little or no LyC. We re-examine the standard LBG selection criteria by performing spectrophotometry on composite spectra constructed from 794 -selected 3 LBGs from the literature while adding LyC flux of varying strengths. The modified composite spectra accurately predict the range of redshifts, properties, and LyC flux of LBGs in the literature that have spectroscopic LyC measurements while predicting the existence of a significant fraction of galaxies outside the standard selection region. These galaxies, termed Lyman continuum galaxies (LCGs), are expected to have high levels of LyC flux and are estimated to have a number density –50 percent that of the LBG population. We define as the relative fraction of observed LyC flux, integrated from 912Å to the shortest restframe wavelength probed by the filter, to the observed non-ionising flux (here measured at 1500Å). We use the 794 spectra as a statistical sample for the full 3 LBG population, and find percent, which corresponds to an intrinsic LyC escape fraction of percent (contamination corrected). From the composite spectral distributions we estimate percent for LCGs and percent for the combined LBG + LCG 3 sample. All values are measured in apertures defined by the UV continuum and do not include extended and/or offset LyC flux. A complete galaxy census and the total emergent LyC flux at high redshift is essential to quantify the contribution of galaxies to the ionising photon budget of the Universe, particularly during the epoch of reionisation.
keywords:
galaxies: formation — galaxies: evolution — galaxies: high-redshift — galaxies: fundamental parameters1 Introduction
Since at least 6, galaxies have been surrounded by ionised hydrogen (Fan et al., 2006; Komatsu et al., 2011; Zahn et al., 2012), maintained by radiation from quasars and galaxies. The ultraviolet (UV) background changes over time as the two populations evolve (e.g. Becker, Rauch, & Sargent, 2007; Becker et al., 2013; Calverley et al., 2011; McQuinn, Oh, & Faucher-Giguère, 2011; Wyithe & Bolton, 2011), however their relative contribution to the ionising spectrum is not well constrained (Haardt & Madau, 2012). As predicted from the declining space density of quasars with redshift (Hopkins, Richards, & Hernquist, 2007; Jiang et al., 2008; Fontanot, Cristiani, & Vanzella, 2012), hard radiation from quasars at 3 dominates the cosmic hydrogen photoionisation, whereas beyond star-forming galaxies provide a softer, dominant background. Lyman-continuum (LyC; Å) photons, capable of ionising neutral hydrogen, are readily absorbed by hydrogen, helium, and dust in the interstellar medium (ISM) of the producing galaxy. Nevertheless, a fraction of these ionising photons survive their journey through the ISM and contribute to the intergalactic UV background.
The fraction of LyC photons escaping galaxies, , is fundamentally tied to many astrophysical processes involved in the formation and evolution of galaxies, including the reionisation of intergalactic hydrogen and the suppression of gas collapse and star formation in low-mass galaxies (Efstathiou, 1992; Barkana & Loeb, 1999; Bullock, Kravtsov, & Weinberg, 2000; Somerville, 2002). Theoretical calculations find that the value of has a high intrinsic scatter (Fernandez & Shull, 2011), can range from 1 to 100 percent (e.g. Ricotti & Shull, 2000; Wood & Loeb, 2000), and is higher on average in dwarf galaxies (Yajima et al., 2011) due to a more porous Hi gas distribution (although see Gnedin et al., 2008). The expected trend of with redshift is similarly model-dependent; Ricotti & Shull (2000) state that of a fixed halo mass decreases with increasing redshift, whereas Razoumov & Sommer-Larsen (2006, 2010) find that increases from 1, to 10, to 80 percent at 2, 4 and , respectively.
Analytic models and cosmological simulations often adopt = 20–50 percent for galaxies during the epoch of reionisation (Iliev et al., 2007; Madau, Haardt, & Rees, 1999; Pawlik, Schaye, & van Scherpenzeel, 2009; Shull et al., 2012). Contemporary simulations of the epoch of reionisation find that the functional form of must increase steeply with redshift to match current constraints on reionisation and to maintain an ionised IGM (Finlator et al., 2012; Kuhlen & Faucher-Giguère, 2012). In order to reconcile stars as the main contributor to ionising radiation during this epoch, the galaxy luminosity function at 7–9 must be extrapolated to absolute magnitudes of M or fainter (4 magnitudes fainter than current observational limits at these redshifts) and an of 20–50 percent adopted (Robertson et al., 2013; Trenti et al., 2010; Finkelstein et al., 2010).
Despite stars being the leading candidate for the source of reionisation, tension exists with the metallicity of the IGM at , which provides an independent estimate of the past total sum of ionising photons from star formation. The value of must be 50 percent to reconcile the measurement of the IGM metallicity with the current census of ionising photons from galaxies at 6 (Ryan-Weber et al., 2009). Thus, efforts for a complete census of high redshift star-forming galaxies and constraints on are key to understanding how radiative feedback influences the thermal and ionization state of the intergalactic medium and its effect on galaxy formation and the reionisation of the Universe.
Measuring is not an easy task as the intrinsic LyC emission from a galaxy is always attenuated. Dove & Shull (1994) analyze OB associations in the Galactic plane and conclude that 7 percent of the LyC flux escapes normal to the disk of the Milky Way into the halo. Similar results, = 1–2 percent, when averaged over solid angle, are obtained by measuring the H emission of photoionised high velocity clouds (Bland-Hawthorn & Maloney, 1999; Putman et al., 2003). For other galaxies, and galaxies at high redshift, the intrinsic value of is impossible to measure and can only be estimated from the surviving LyC and non-ionising flux reaching Earth and the estimated amount of absorption by intervening gas in the line of sight.
Due to the very nature of the LyC being in the far-UV, ground-based observational efforts for direct detection have focused on the redshift “sweet-spot” of 3–4 where the LyC is shifted to the optical and yet a low enough redshift that the average number of intervening absorption systems is not too great to hinder the detection of LyC emission.
Galaxies at these redshifts are efficiently selected using the Lyman-break technique (Guhathakurta et al., 1990; Songaila et al., 1990; Steidel & Hamilton, 1992, 1993) which uses broadband imaging to search for the predicted strong break in flux at the Lyman limit (912Å), when compared to UV continuum flux longward of Ly (1216Å), as a result of absorption in stellar atmospheres, by the ISM of the galaxy, and by optically thick systems in the line of sight. Over the last two decades, follow-up spectroscopy has shown that this technique is highly successful in selecting 3–4 Lyman break galaxies (LBGs) and, when accounting for the statistical change in Ly forest absorption with redshift, highly successful in selecting LBGs while eliminating most low redshift sources (e.g., Steidel et al., 1996, 1999, 2003, 2004; Cooke et al., 2005, 2006; Bouwens et al., 2007, 2011; Ly et al., 2011; Bielby et al., 2011, 2013; Ellis et al., 2013). In this work, we refer to the 3 and 4 LBG colour-selection criteria of Steidel et al. (2003) and Steidel et al. (1999), and all criteria based on similar 912Å flux expectations, as ‘standard’ criteria.
It is important to remind the reader that the standard LBG colour-selection criteria were initially designed for efficient galaxy detection at high redshift and not necessarily for comprehensive detection. Firstly, the standard criteria are sensitive to star-forming galaxies that are luminous in the restframe UV (initially to accommodate the higher sensitivities and field-of-views of optical CCDs versus other wavelengths) and therefore exclude many of the high redshift passive and dust-obscured star-forming galaxies (e.g., Daddi et al., 2004; Chapman et al., 2005; van Dokkum et al., 2006). Secondly, and more important to the work presented here, the standard LBG colour-selection criteria are designed to select galaxies based on the expectation of essentially zero detectable flux blueward of 912Å. Therefore, it is understandable but interesting to note that all spectroscopic searches for LyC flux in high redshift galaxies have been performed on LBGs. As we show below, galaxies with detectable LyC flux can reside within the standard LBG colour-selection region but we need to look more broadly to properly measure the LyC flux of the full high redshift galaxy population.
Here, we present the colours of 3–4 galaxies, determined from spectrophotometry performed on composite LBG spectra with various levels of flux added blueward of 912Å. We find that their colours are highly sensitive to the amount and wavelength extent of the LyC flux and place the galaxies inside and outside the standard LBG colour-selection region. The existence of galaxies at 3–4 with colours outside the standard LBG colour-selection criteria have been previously confirmed. The VLT Vimos Deep Survey (VVDS Le Fèvre et al., 2005a) is a magnitude-limited search for galaxies down to 24.75, independent of colour selection constraints, that has spectroscopically confirmed 400 3–4 galaxies inside and outside the conventional LBG colour-selection criteria with potentially similar space densities (Le Fèvre et al., 2005b, 2013a, 2013b; Paltani et al., 2007). We critically review the VVDS data and report the results in a companion paper.
This paper presents the colour evolution of 2.7–4.5 galaxies as determined from the modified composite spectra that accurately predict the redshifts, properties, and observed surviving LyC flux of LBGs previously measured in the literature. In addition, this work provides a physical basis for the locations of spectroscopically confirmed galaxies both inside and outside the standard LBG colour-selection criteria with respect to their redshifts and Ly equivalent widths. The predictive power of the modified composite spectra has utility in estimating the global observed LyC flux from LBG photometric samples and from LBG spectroscopic samples that do not have deep LyC sensitivity. Finally, the composite spectral analysis predicts, and the data distribution and the VVDS confirmed spectra demonstrate, that 3–4 galaxies exist outside the standard criteria and that the missed galaxies have moderate to strong surviving LyC flux.
This paper is organised as follows. §2 discusses the observations used in this work and §3 describes the escape fraction and relevant definitions. We examine the LyC flux expectations of the data and of the standard LBG colour-selection criteria in §4. We explore the predictions of the modified composite spectra in §5 and compare the predictions to previous LyC flux searches and measure the average observed LyC flux and of 3 LBGs. In §6, we describe the expectation for galaxies with colours outside the standard LBG criteria and estimate their observed LyC flux and and that for the full 3 population. We summarise the results in §7. All magnitudes are reported in the AB magnitude system (Fukugita et al., 1996).
2 Observations
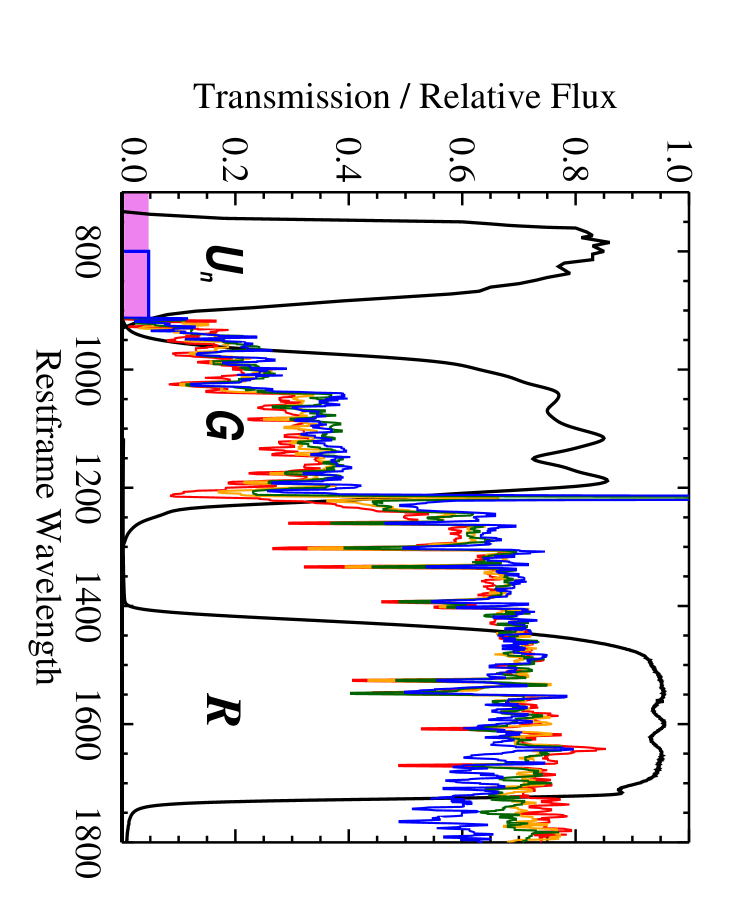
To place this work on common ground, we perform our analysis on the 3 LBG photometric data set111http://cdsarc.u-strasbg.fr/viz-bin/Cat?J/ApJ/592/728 of Steidel et al. (2003, hereafter S03) and use four composite spectra constructed from the LBG quartiles of Shapley et al. (2003). The composite spectra consist of 198 (or 199) LBG spectra from the S03 sample and are categorised by their net Ly equivalent width (EW). Strong relationships have been found between Ly EW and several other LBG properties such as ISM absorption line strength/velocity, UV continuum slope, UV and optical morphology, and both small- and large-scale environment (Shapley et al., 2003; Law et al., 2007, 2012; Cooke et al., 2010; Cooke, Omori, & Ryan-Weber, 2013). Thus, the Ly feature is a strong tracer of multiple observed restframe UV and optical properties and environments of LBGs. The transmission of the filters and the four composite spectra are shown in Figure 1.
We have computed the magnitudes and colours of our modified composite spectra in the filter bandpasses because they are constructed from the S03 data set. However, the results of this work are not unique to the filters. The composite spectra can be “observed” in other filters when convolving the flux with the relevant filter transmission, CCD quantum efficiency, and atmospheric extinction. We perform such an analysis using the Canada-France-Hawaii Telescope Legacy Survey MegaCam filter set in §5.2.3.
3 The escape fraction
The absolute escape fraction of LyC photons cannot be measured directly as a result of the unknown absorption by intervening neutral gas in the line of sight and the unknown true number of ionising and UV continuum photons produced by a given galaxy. Instead, previous studies have focused on measuring the relative fraction of non-ionising UV continuum photons to escaping LyC photons, , when combined with empirical and/or simulated estimates of the intrinsic galaxy spectral energy distribution and absorption of the IGM (e.g. Steidel et al., 2001; Inoue et al., 2005; Shapley et al., 2006; Iwata et al., 2009). The parameter is conventionally defined as
| (1) |
where and are the intrinsic escape fractions of photons in the Lyman continuum and UV wavebands, respectively; is the fraction of intrinsic non-ionising to ionising luminosity density produced by the galaxy; is the observed non-ionising to ionising flux density fraction; and is the factor describing the attenuation of the LyC flux by the IGM.
Any interpretation of the observed flux ratio, , as a proxy for the intrinsic requires assumptions or modeling of , and . For example, Inoue et al. (2005) estimate 1–5.5 for a wide range of stellar populations, with a typical value in the literature set at 3.0. The attenuation from intervening optically thick systems has been estimated analytically (e.g., Inoue et al., 2005), via Monte Carlo simulations (e.g., Shapley et al., 2006), and empirically using QSO spectra (e.g., Steidel et al., 2001; Prochaska et al., 2009) with consistent results. Finally, is typically computed by applying a dust law to the measured, or estimated, of the UV continuum. From equation 1 we can see that, if we assume , and remain more or less constant, a smaller implies a larger .
The only quantity in equation 1 that can be observed for individual galaxies (or measured in the composite spectra) is . With the considerations above, we see that the Lyman break feature of LBGs favours small observed LyC flux corresponding to large . As a result, LBGs are non-ideal galaxies to search for high levels of escaping LyC flux. As we show below, only LBGs having unexpected colours relative to their spectral type and redshifts are expected to show measurable, or high, levels of escaping LyC photons.
Two spectroscopic measurements of the mean surviving LyC flux of -selected 3 LBGs were performed by Steidel et al. (2001) and Shapley et al. (2006). In both cases, the results are reported using = , where is the flux density measured at 1500Å and is the flux density averaged over 880–910Å. Steidel et al. (2001) find for a sample of 29 LBGs at , or an 50 percent when using their empirical IGM absorption estimate and adopted 3.0. The Steidel et al. (2001) sample has been thought to be biased in that the LBGs are pulled from the bluest quartile (quartile 4). Indeed as we show below, the locations in colour-colour space of these LBGs are offset with respect to the ‘standard’ expectations for LBGs from star-forming templates and, in particular, offset with respect to the the expectations of quartile 4 LBGs.
Shapley et al. (2006) investigate a sample of fourteen LBGs more representative of the colour and Ly EW of 3 LBGs and find an average corresponding to an 13 percent. These results include two exceptional cases, ( = 65 percent) and ( 100 percent), that contribute nearly all of the LyC flux to the average. Subsequent observations, however, reveal that in one case the observed LyC flux may be line-of-sight contamination and in the other case the result of scattered light222The apparent LyC flux from C49 has been found to arise from a lower redshift object contaminating the field (Nestor et al., 2013). Thus it is likely that this object has little to no escaping LyC flux. Nestor et al. (2013) detect no LyC flux from object D3 to the limits of their data. The source of the observed LyC flux in the deep spectroscopy is still unresolved but may be caused by a nearby bright object as discussed in Shapley et al. (2006).. Omitting these two galaxies from the sample places 400 and 2 percent. The LBGs in this sample have colours that are expected for their redshifts and spectral properties, i.e. colours that are expected for galaxies having a strong Lyman break, and thus have low expected LyC escape fractions.
Efforts using other selection criteria and filters, including narrowband imaging, to measure the 3 escape fraction have reported results that span a large range. Iwata et al. (2009) measure = 2.4–23.8 for seven LBGs from narrowband imaging. The median, = 6.6, corresponds to = 16–83 percent under various assumptions detailed in that work. Inoue et al. (2005) place upper limits of 72 percent and 216 percent for two LBGs. Recently, Nestor et al. (2013) combined narrowband imaging and spectroscopic samples of LBGs and Ly emitting galaxies (LAEs) and find model dependent 25–35 percent and 33–100 percent for the two galaxy types, respectively, taking into account the typical ages and metallicities of these galaxies.
To help alleviate potential confusion between various observational and theoretical definitions of the escape fraction, and to emphasise that the quantities we are measuring (or predicting) here are the LyC and non-ionising UV continuum flux observed, we define the relative fraction
| (2) |
where is the observed LyC flux density integrated from to 912Å and is the observed non-ionising UV continuum flux density. The predicted values of in this work are based on integrated over the -band, unless otherwise noted. The wavelength is not specified here because it will vary within the filter with the redshift of the galaxies (or vary by model). For the work presented here, we compute from the composite spectra flux at 1500Å.
From an observational point of view, expressing the surviving LyC flux as is more intuitive and, because the observed UV continuum is measured more accurately, the error in goes as the uncertainty of the observed LyC flux. We note that is not to be confused with , although both are expressed as percentages. Below, we present the colours of 3–4 galaxies as a function of redshift and spectral type and compare the results to the expectations of the standard LBG colour selection criteria in an effort to shed light on the results of escaping LyC flux measurements in the literature.
4 Conventional expectations
The standard LBG colour-selection criteria is based on the colour evolution of star-forming galaxy templates as a function of redshift. Lines are drawn in colour-colour space in an effort to mark off areas that include the galaxy template predictions (including photometric uncertainty estimates) at the desired redshifts while excluding low redshift sources. Because the colours of high redshift and low redshift galaxies overlap in colour-colour space, border regions become a compromise between ‘efficient’ criteria, that minimize the fraction of low redshift sources at the cost of excluding a fraction of the high redshift population, and ‘comprehensive’ criteria that aim to include all high redshift galaxies over a specified redshift range at the cost of including a significant fraction of low redshift sources.
To assess the expectations of the standard criteria a posteriori, we compute the spectrophotometric colours of the four composite LBG spectra and analyze their colour-colour distribution with that of the data. Here, we assume no flux shortward of 912Å for our composite spectra to match template-based, Lyman-break criteria. As stated in §2, the composite spectra are constructed from the LBG sample of S03 and are, thus, selected by their colours. We generate four composite spectral samples by randomly pulling values from the observed magnitude and redshift distributions of the data that form each LBG quartile and assign those values to the respective composite spectrum. We then compute their flux in the and bandpasses and include their associated photometric uncertainties.
To check the accuracy of the spectrophotometry, we examine the distributions of the composite spectral samples on the vs. colour magnitude diagram. The means and dispersions of the composite spectral sample distributions are compared to the data for each respective quartile. We find very close ( 0.02 magnitude) agreement when examining the distributions quartile by quartile and as a full photometric sample. The results can be found in Table 1 of Cooke, Omori, & Ryan-Weber (2013) along with a more detailed discussion. The agreement confirms the accuracy of the spectrophotometry and provides an assurance that, for this purpose, each of the four composite spectra is accurate average representation of the 25 percent of the LBG population in which they are comprised. Only the composite spectral sample with the strongest Ly emission (quartile 4) shows a small departure from its respective spectroscopic sample, with its colour distribution mean 0.12 mags brighter in the -band where the Ly feature falls. This discrepancy is caused by a small number of strong Ly emitting LBGs adding a disproportionate weight to the average spectrum profile. We apply a 0.12 magnitude decrease in -band flux to bring the composite spectrum in line with the average values of that quartile. We note that not correcting for this effect results in a larger discrepancy in the distributions discussed below, thus our analysis is conservative.
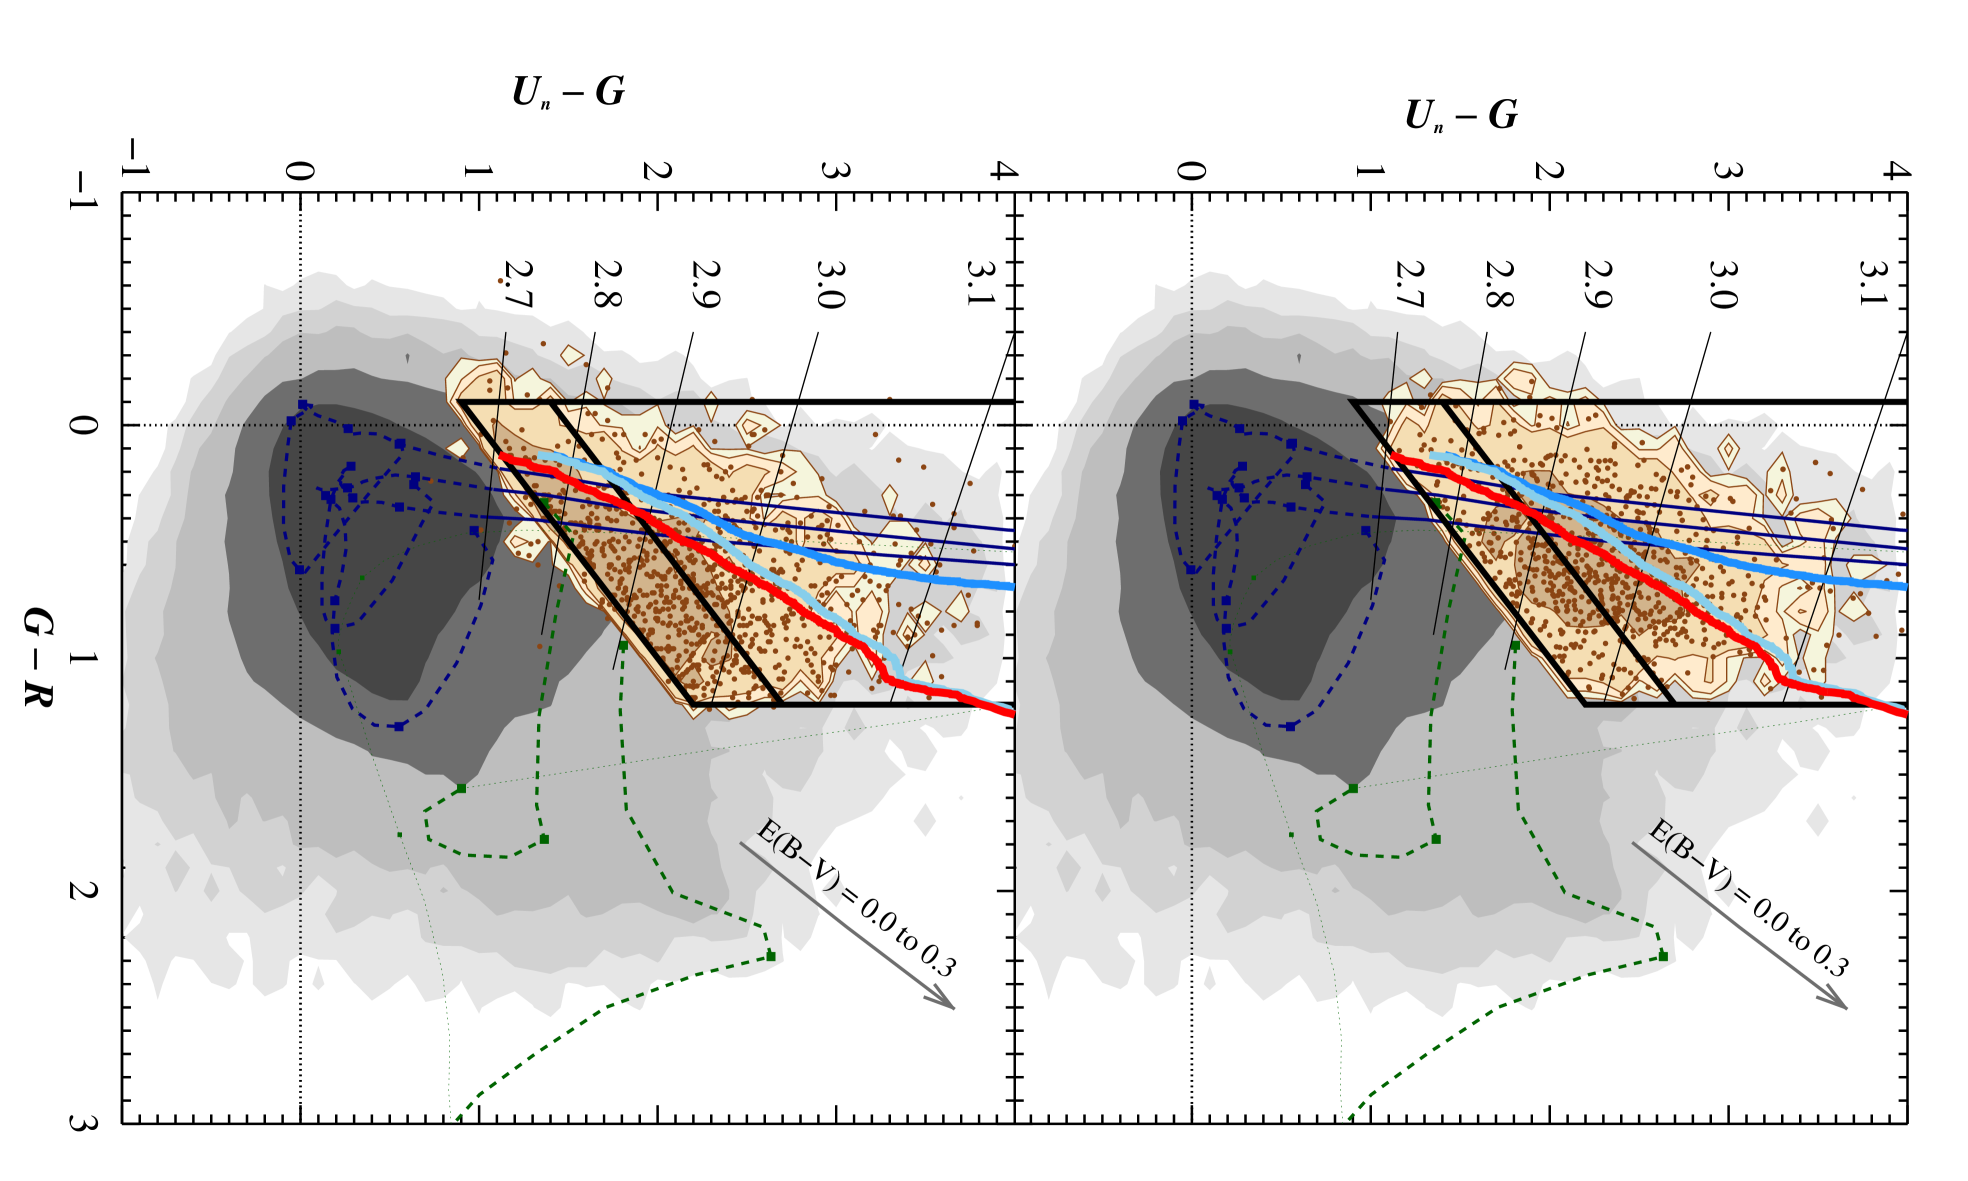
Our next step is to examine the composite spectral sample and data distributions on the vs. plane. Although the composite spectra are constructed directly from the S03 data, we find that the distributions differ (Figure 2). The composite spectral samples have a relatively smooth distribution throughout the standard colour-selection region with a density that peaks near the redshift distribution peak ( 2.96, 1 0.29; S03) in accordance with the expectations of the templates, whereas the data distribution is seen crowded to bluer colours and has a peak density near the colour selection border. We note that the composite spectral sample distribution in Figure 2 is the distribution after corrections (discussed below) which act to push the distribution to bluer colours and closer to that of the data. The uncorrected distribution has larger colours and a larger discrepancy with the data. The arrows in the figure indicate the direction and magnitude in which reddening acts on the distributions, which is essentially perpendicular to the direction of the discrepancy. Thus, the difference in the two distributions lies in their colours and, more specifically, in the magnitudes of the galaxies.
Factors that can lead to a difference in magnitudes include (1) a -band red leak, (2) assignment of -band non-detections to an arbitrary magnitude (i.e., the limiting magnitude of the survey), (3) the effects of wavelength-dependent flux loss in the spectroscopy in which the composite spectra are formed, and/or (4) the initial condition of zero flux shortward of 912Å. We assess each effect in turn, below.
4.1 -band red leak
The filter used in the S03 survey suppresses essentially all flux redward of 4000Å (Steidel 2013, private communication). Only a negligible flux leak appears in the filter transmission curve occurring near 11,000Å, 700Å FWHM, with a flux peak 0.01 of full transmission. The leak resides largely beyond the sensitivity of the CCDs used in that work and would result in a red leak contribution of 0.01 magnitude, even when considering the most efficient CCD quantum efficiency at long wavelengths and brightest LBGs. Redleak is determined not to contribute to the distribution discrepancy but we consider a 10 magnitude leak (0.1 mag) below as a conservative measure and to test the overall effect redleak has on the distribution.
4.2 Limiting magnitude detections
The finite depths of imaging surveys limit the range of measurable colours. The resulting photometry can only provide lower limits for objects with large colours, such as those with little or no flux in the band and appear as non-detections or ‘drop-outs’. For the S03 survey, -band non-detections were assigned the 1 limiting magnitude of their respective field. To match these data, we similarly assign the limiting magnitude to the generated composite spectra spectrophotometry for those having computed -band mags equal to, or fainter than, the field limits.
4.3 Wavelength dependent spectroscopic flux loss
The spectroscopic data were acquired using the Low-Resolution Imaging Spectrometer (LRIS; Oke et al., 1995; Steidel et al., 2004) at the Keck Observatory in multi-object spectroscopic mode using slitmasks prior to the availability of an atmospheric dispersion corrector. Because the slitlets are fixed at a given position angle during integration, flux can be lost due to atmospheric dispersion over the course of the observation as the slitlet position angle changes with respect to the parallactic angle. Assessing potential wavelength-dependent flux loss in the spectroscopic observations is difficult. Fortunately, considerable effort was made in the design and execution of the observations to minimize this effect by designing the position angles of the slitmasks near the parallactic angle at mid-observation, observing the targets at low airmass and as they pass the meridian, and limiting the length of the exposure times. As a result, the observations should have incurred little wavelength-dependent flux loss. Nevertheless, we estimate the flux loss and its impact on the LBG colour-colour distribution.
The close, 0.02 magnitude, agreement between the composite spectral sample and photometric data distributions on the vs. colour-magnitude diagram demonstrates that the flux loss between the and bandpasses is small and provides a constraint on the average amount of flux lost in the bandpass. Given the amplitude of the flux loss constraint between the and bandpasses, we compute the range of flux loss in the bandpass from observations with slit position angles that change by various amounts from 0–45 degrees off parallactic during 2 and 3 hour long integrations while passing through 1.1–1.5 airmass corresponding to the respective ranges in the observations (or greater). We find that 90 percent of the observations incur less than 20 percent flux loss ( 0.24 mag). Here, we conservatively assume 0.24 magnitude flux loss for the entire sample.
4.4 Excess -band flux
The results of the above analyses are shown in Figure 2. The evolutionary track for the average of the four composite spectra, uncorrected for any effect above, is shown as the thick, near vertical, mid-blue curve. This curve represents a theoretical infinitely deep -band survey in which all colours can be measured. The strengths of the effects on the -band magnitude discussed above on the composite spectral sample distributions is traced in Figure 2 by the change in the mean composite spectrum evolutionary track.
The thick light-blue curve is the track that includes the assignment of the -band non-detections to the limiting magnitude of the fields. This effect causes the largest change in the distribution. The thick red curve incorporates both the -band non-detection assignments and a 0.34 magnitude increase to the flux of the composite spectra to accommodate both slit flux loss and -band red leak (0.24 + 0.1 magnitude, respectively). The contours in the upper panel of Figure 2 outline the expected distribution of S03 LBGs for the latter case: assigning magnitude limits, slit flux loss, and red leak contributions (i.e., the thick red track). The distribution reveals that, although the combination of these three effects make a noticeable difference, and move the distribution in the direction of the data, their contributions fall well short of resolving the distribution discrepancy. This leaves the likelihood that the bulk of the difference between the two distributions is caused by a genuine excess in -band flux.
4.4.1 Contamination by foreground line-of-sight sources
This above result does not consider -band flux contamination from lower redshift sources in the line of sight. We address this topic in detail in §5.2.3 but mention a few points here. The S03 photometry is measured in 2 arcsec apertures, which differs in nature to narrow-band surveys that measure extended flux. Any lower redshift source would need to physically overlap the photometric aperture, albeit only weakly (i.e., even the wings of a faint line-of-sight source might offer a measurable contribution). However, at least two effects act to keep the contamination rate low, (1) 25.5 3 LBGs are small in size (faint point source-like objects) and have a relative low surface density (1.8 arcmin-1) and (2) some line-of-sight sources overlapping with LBG apertures contribute to all colours such that they no longer meet the standard LBG criteria. As we show later, we find that the number of LBGs meeting the standard criteria with measurable (i.e., down to a level of m 28) LyC contamination is small and is insufficient to explain the distribution mismatch. As a result, the existence of unaccounted -band flux, combined with the fact that LBGs in the literature have measured, non-negligible, observed LyC flux (§1), make it worthwhile to re-examine the LBG colour-selection criteria and the colour expectations of galaxies with various levels of observed LyC flux.
5 Lyman continuum expectations
To determine the expectations for galaxies with surviving LyC flux, we modify the composite spectra and a star-forming galaxy template by adding flux using two models: (1) a ‘flat’ model, that includes flux from 912Å to the shortest wavelength probed by the -band, depending on the galaxy’s redshift, to explore the effects of flux contributions extending to short wavelengths and (2) a ‘step’ model that includes flux between 800–912Å, motivated by the observation of apparent (or potential) flux down to 800Å in Shapley et al. (2006) and to test a range of wavelength between zero LyC flux expectations (912Å) and that of the ’flat’ model. The two models are pictorially represented in Figure 1. Because we are measuring the integrated flux shortward of 912Å using blunt tools in the form of broadband filters, the details of erratic flux profiles resulting from the multitude of IGM systems in the line-of-sight are smoothed over. As a result, reported here reflects the fraction of LyC flux integrated over the relevant wavelengths when compared to the flux measured at 1500Å from the composite spectra. Thus, the ‘step’ model is denoted as (800Å) and the ‘flat’ model is denoted as .
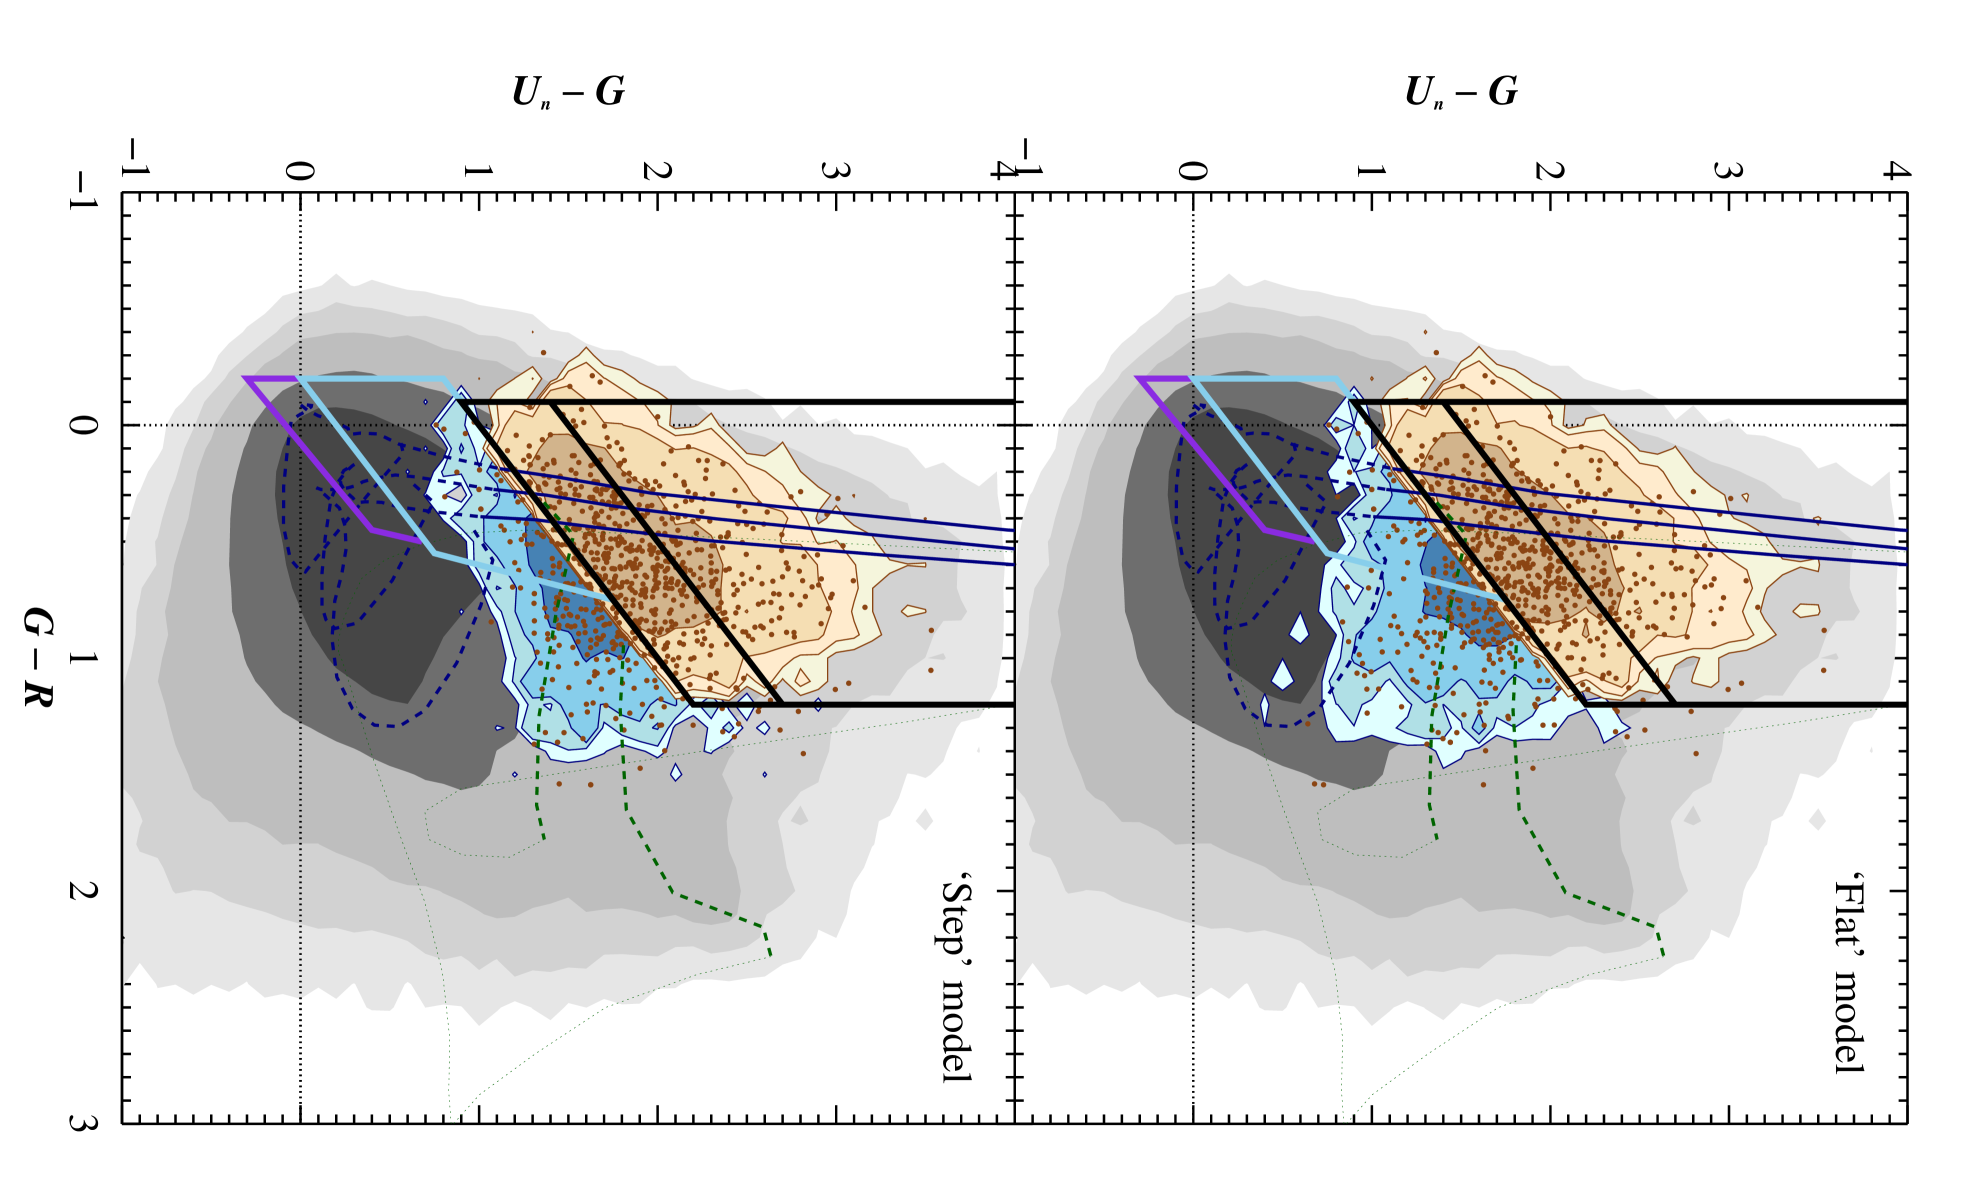
Figure 3 shows the effects on the composite spectra evolutionary tracks for the two models from to when including various values of . In both panels, the near vertical, thick-lined evolutionary tracks represent zero flux below 912Å colour-coded as red, orange, green, and blue corresponding to quartiles 1–4 (Shapley et al., 2003), respectively. The thin-lined tracks represent composite spectra evolution with added LyC flux. As is increased, the farther the tracks peel off from the zero LyC flux tracks and down toward bluer colours. It is readily apparent that galaxy colours are very sensitive to even a small amount of surviving LyC flux.
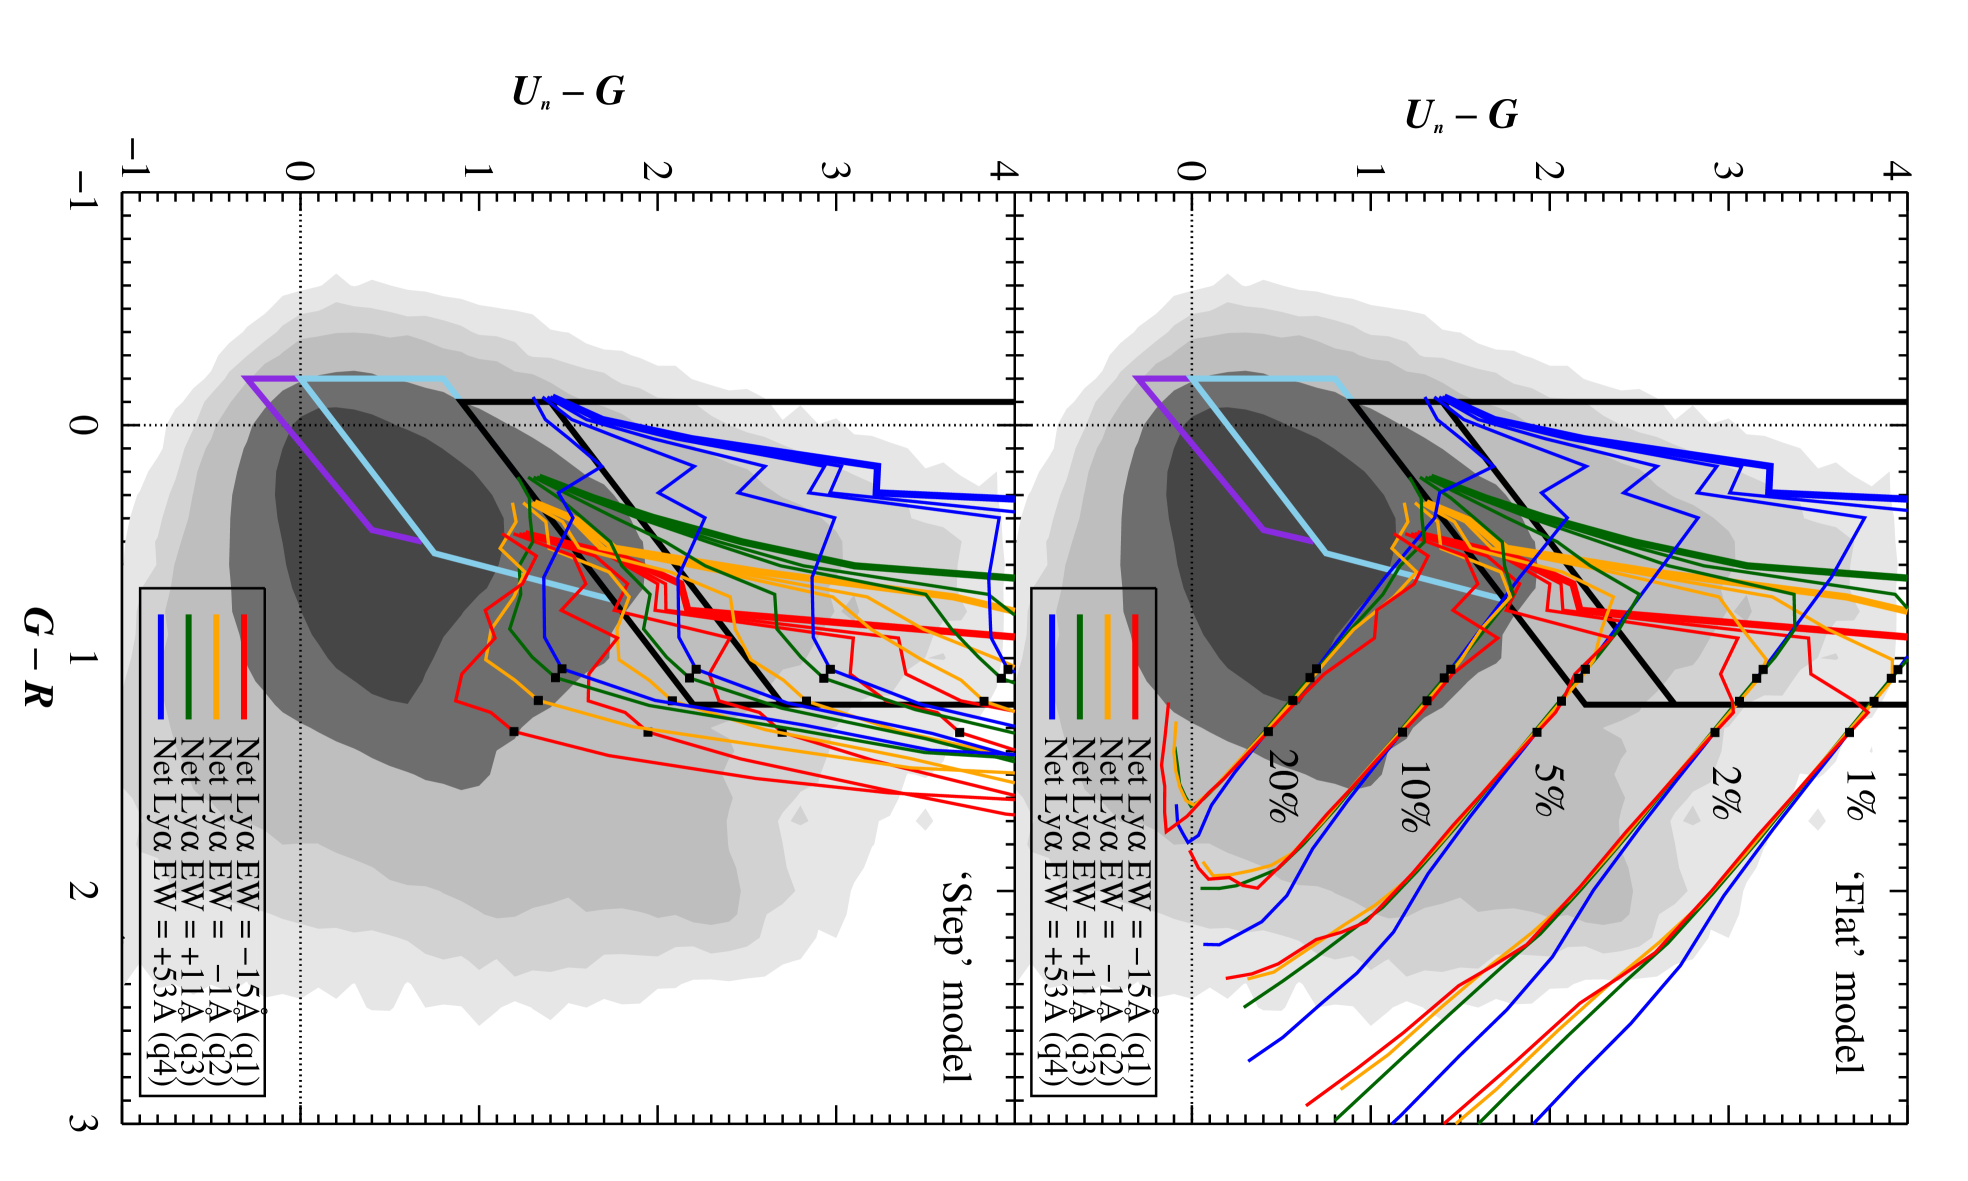
We extend the 3 distributions used for the composite spectral samples to 3.5–4.5 (for reference, 3.5 for each track is marked with a black square in Fig. 3) by fading the magnitude distribution according to redshift (e.g., a standard candle is fainter by 0.5 magnitude from 3 to 4) and by correcting the composite spectra for the change in flux decrement, , by Ly forest absorption with redshift. For the latter, we modify the Ly forest in the composite spectra using , derived from a fit to results in the literature (Giallongo & Cristiani, 1990; Lu & Zuo, 1994; Reichart, 2001; Jones et al., 2012) and to return zero correction for the 3 composite spectra.
The difference between the two models lies in the shortest wavelength that flux is assigned. When considering 2.7–4.5 galaxies, the ‘step’ model provides an approximate mid-point between the zero LyC flux evolutionary tracks and the tracks of the ‘flat’ model which span the full range of outcomes. Other observed LyC wavelength ranges can be roughly interpolated between the expectations of the zero LyC flux evolutionary tracks and those of the two models.
The colours of galaxies at all redshifts studied are sensitive to both the amount and the wavelength extent of the LyC flux, with the sensitivities increasing with redshift. Inspection of the ‘flat’ model in the upper panel reveals that for 3.5 galaxies it only requires a small amount of LyC flux, 1 percent [ 100] to move the tracks from infinity (zero LyC flux case) down to 4 and only 5 percent [ 20] to move the tracks to 2. The results are similar for the ‘step’ model shown in the lower panel for objects at 3.8 where 800Å restframe flux falls in the -band.
For both models, 3.5 galaxies with small to moderate have noticeable changes to their colour but remain in the standard selection colour region. However, higher amounts of LyC flux can affect their colour such that a significant fraction of galaxies fall out of the standard colour-selection region. Many of these ‘missed’ galaxies evade lower redshift, e.g., BX and BM, criteria and reside in a relatively unexplored region of high redshift galaxy colour space. This region is occupied by a higher density of low redshift sources and presents complications in devising efficient selection criteria.
The results for 4 galaxies in the vs. colour-colour plane is very similar to that for 3 shown here. Typically, the vs. plane is not considered in 4 galaxy selection. However, we find that isolating galaxies on this colour-colour plane can be an effective approach to select galaxies with measurable LyC flux at 4 from high-density regions containing low redshift sources. Galaxies at 4 are located in the right half of Figure 3 and beyond the 3.5 markers (small black squares). Deep near-UV (NUV) imaging and a parallel analysis on the vs. plane would enable 2 and 3 galaxy selection following a similar approach to that presented here for 3 and 4. Moreover, photometric redshifts using optical to far infrared data, including deep medium-band infrared photometry, hold great promise in selecting a more complete population of 3–4 galaxies (Spitler et al., 2014). We have applied this approach to select 3–5 galaxies with expected escaping LyC flux and report the results in a forthcoming companion paper.
As verified below, analyzing the colours and Ly EWs of 3–4 galaxies with respect to the composite spectra expectations provides a powerful tool to predict the fraction and wavelength extent of the escaping ionizing photons. In addition, we show that the analysis of composite spectral samples on the vs. plane has utility in estimating the overall escaping flux of 3–4 photometric samples.
5.1 Comparison to observed Lyman continuum detections
We compare the expectations of the composite spectra evolutionary tracks with the results of previous spectroscopic LyC flux searches using -selected LBGs.
5.1.1 The Steidel et al. (2001) data set
As discussed earlier, Steidel et al. (2001) measured the LyC flux of 29 LBGs and reported an average corresponding to percent. The sample has a full redshift range of 3.300–3.648 and -0.07–0.12. The upper panel in Figure 4 plots the mean and 1 and values (dark rectangle) and full range of values (dotted lines). Overlaid in the upper panel are the composite spectra evolutionary tracks for our two models using percent. In addition, we overlay a star-forming galaxy template (Bruzual & Charlot, 2003) assigned percent for the two models with three values of internal extinction ( = 0.0, 0.15, and 0.30) using the law of Calzetti et al. (2000) and consistent with the presentation in S03. Redshift intervals of 0.1 for the composite spectra and the templates are marked (small circles for 2.7–3.5 and small squares for 3.6–4.5), with large solid circles indicating .
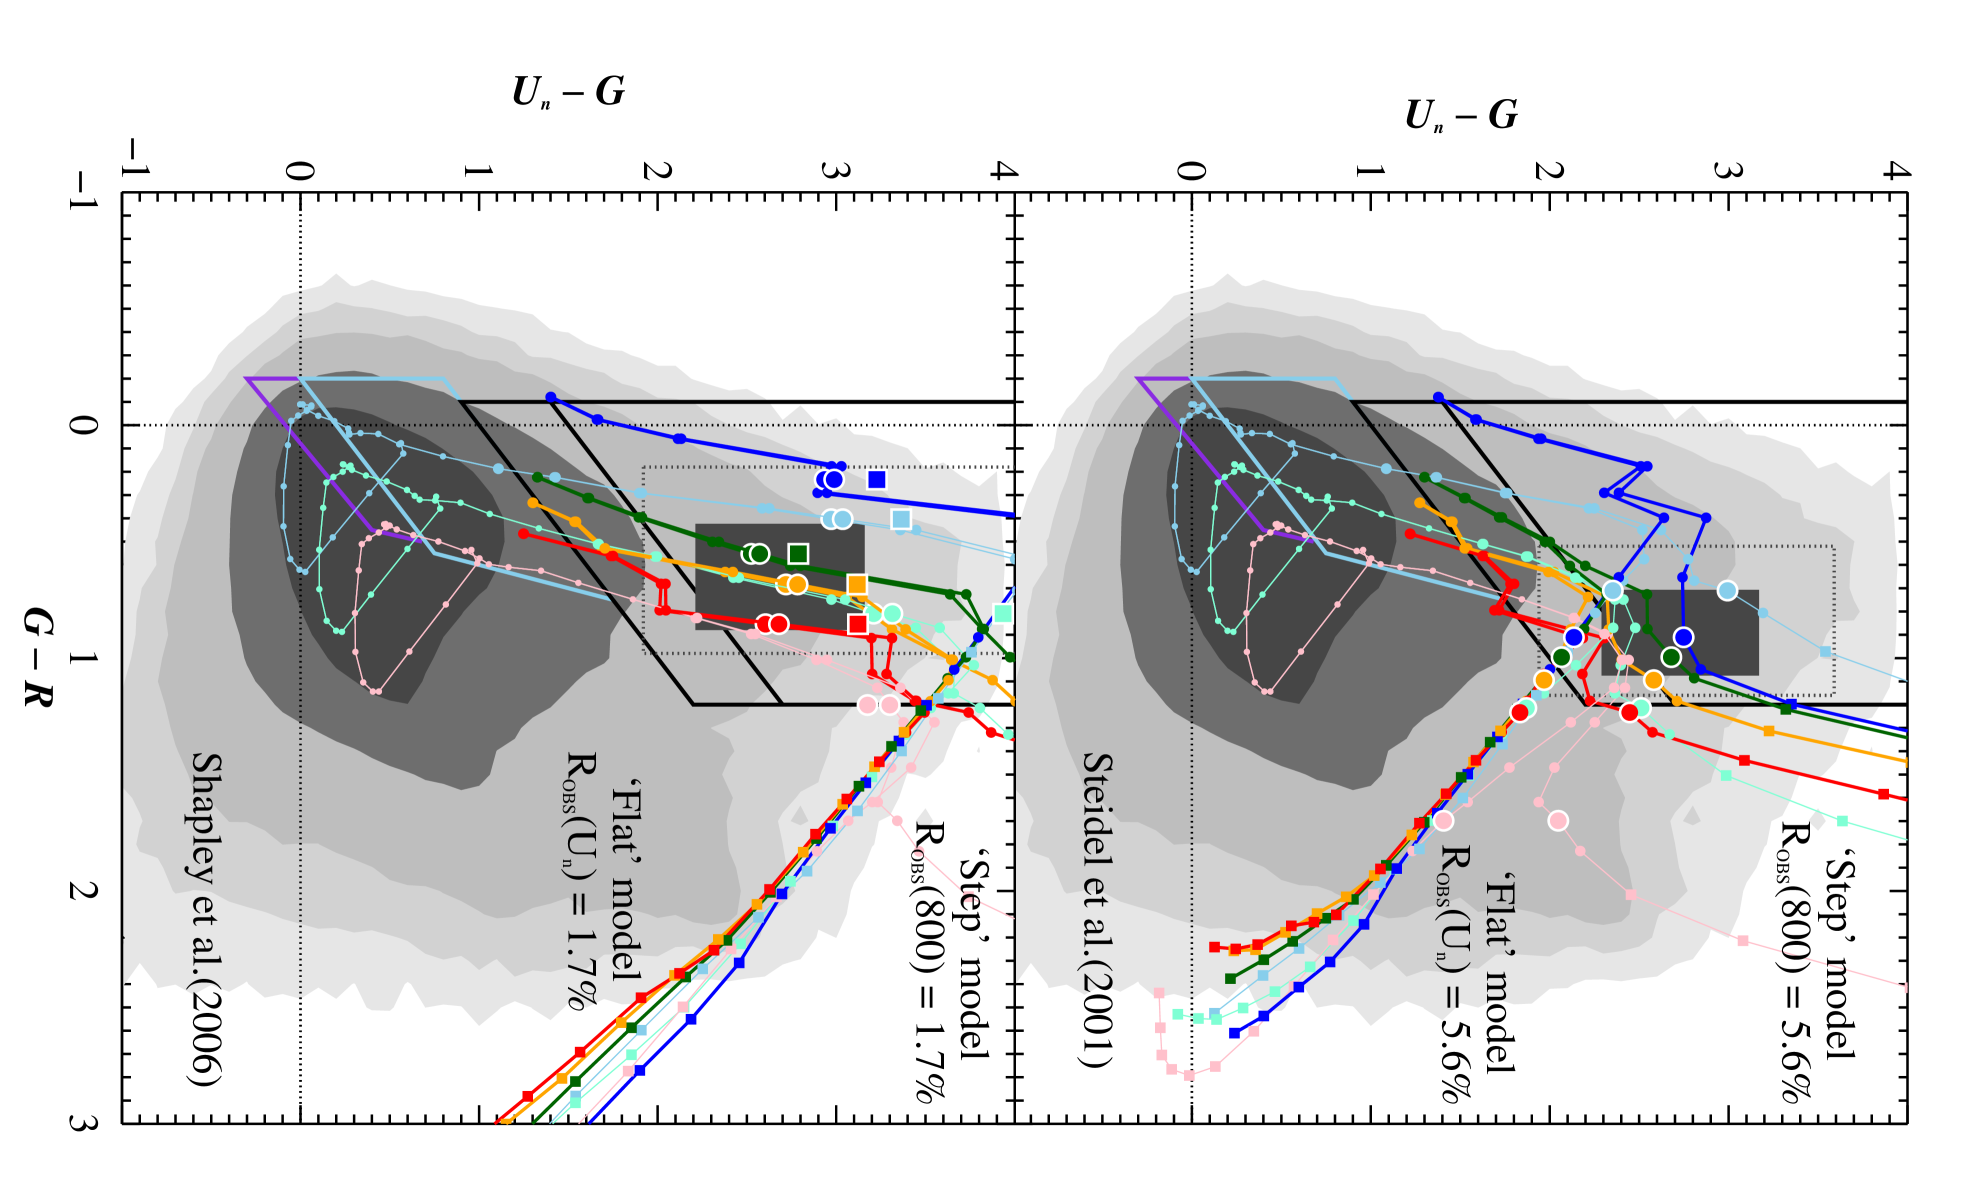
Composite spectra and the templates for 3.4 objects with zero 912Å flux have infinite colours. With this consideration in mind, and the knowledge that the LBG sample was pulled from the bluest quartile (i.e., their properties are most similar to quartile 4; the dark blue tracks), we find that the models predict the measured LyC flux of the data very accurately. In addition, the templates show similar behaviour to the composite spectra which is a reassurance that the movement in the vs. plane is not a property specific to the composite spectra. Over the full range of colours for the data, the quartile 4 composite spectrum predicts a redshift range of 3.25–3.6, in close agreement with the data, whereas we find 3.0–3.6, 3.0–3.5, and 3.05–3.3, for quartiles 3, 2, and 1, respectively. The values of the template are in agreement with the data (quartile 4 has ) and show that galaxies with yield a poor fit. Over the full data colour range (dotted line window in Figure 4), we find that the ‘step’ model expectations for the quartile 4 composite spectrum ranges from 3–10 percent and 2–7 percent for the ‘flat’ model.
For 3.4 galaxies, the -band probes down to 740Å and the LyC in the S03 spectra are measured from 880–910Å. The direct agreement of the mean of the data with the ‘step’ model shows that the average escaping LyC flux is consistent with the integrated results to 800Å and the LyC flux can be, and likely is, distributed over wavelengths shorter than 880Å. The ‘flat’ model shows that uniform LyC flux at the level found between 880–910Å down to the 740Å is within the range of the data but, considering the ‘step’ model results, suggests that the LyC flux does not typically extend to wavelengths shortward of 800Å for the sample.
Finally, our analysis shows that the colours of the Steidel et al. (2001) data set are unexpected for quartile 4 LBGs in the ‘standard’ picture. Although their colours are highly consistent with their redshift and their spectral properties are in agreement, their colours are much bluer than that predicted by composite spectra (or star-forming templates) with little, or zero, LyC flux. Instead, their colours are what is expected for the composite spectra with an added LyC flux of 5%. Thus, application of our technique on the Steidel et al. (2001) sample accurately predicts the observed amount of LyC flux.
5.1.2 Shapley et al. (2006) data set
Shapley et al. (2006) obtain deep spectroscopy of 14 LBGs having colours and properties closer to the mean of the full LBG population with overall properties closest to quartile 2 LBGs. The full redshift range of the sample is 2.76–3.30, with 0.03–0.19 (1 range), and , corresponding to 1.7 percent. We note that 400, or 0.3 percent, when excluding object C49 and D3 (see discussion in §3).
The lower panel of Figure 4 is plotted similarly to the upper panel and compares the data to the composite spectra and star-forming template expectations for = 1.7 percent. The large solid circles in the lower panel indicate 3.06 for all tracks. The data average best matches the properties of quartile 2 LBGs and we find that the quartile 2 composite spectrum (orange tracks) fits the best of the four quartiles. We note that the mean and 1 for the colour range plotted on Figure 4 is computed for the -band detections and lower limits (i.e., drop-outs), hence the true mean and 1 is higher and broader than this range, however the values remain the same. Quartile 2 redshifts distributed over the full range of the data colours are 2.95–3.3. Quartile 1, 3, and 4 redshift ranges are 2.85–3.15, 2.9–3.4, and 3.0–3.35, respectively. The range of values indicated by the template are in good agreement with the data (quartile 2 has ). The ‘step’ and ‘flat’ model for the quartile 2 composite spectrum produces 0–9 percent over the full data colour range.
We include the values for 3.06 with = 0.3 percent, shown using large squares (values for = 0.0 percent are nearly identical) to assess the sample assuming negligible flux from objects C49 and D3. We find good agreement between the composite spectra expectations and the data, especially when considering the true mean and 1 colour dispersions when including drop-outs. We note that the composite spectra expectations are less sensitive to differences in small amounts of observed LyC flux for the lower redshift range but can confidently rule out moderate to high levels of LyC flux. Finally, we note that this sample was selected to be more representative of the average properties of LBGs, including their colours, but not necessarily their colours. Whether or not the sample is representative of the average surviving LyC flux of LBGs is unclear. The colours of these galaxies are expected for their redshifts and spectral type under the standard approach and, as such, the sample is prone to small and is expected to contain galaxies with little escaping LyC flux.
Lyman break galaxy observed and estimated intrinsic Lyman continuum fluxa Sample (model)b d e d e d e Quartile 1 (Flat) 3.0 21.9 4.4 3.0 21.3 4.3 2.9 20.8 4.2 Quartile 2 (Flat) 3.4 24.1 6.7 3.3 23.4 6.5 3.2 22.8 6.3 Quartile 3 (Flat) 4.3 30.9 10.0 4.1 29.9 9.6 4.0 28.6 9.2 Quartile 4 (Flat) 7.1 51.1 20.1 6.8 48.8 19.2 6.5 46.8 18.4 Average (Flat) 4.3 31.3 9.1 4.2 30.2 8.8 4.0 29.1 8.4 Average (Flat) corr.h 3.2 23.1 6.7 3.4 24.4 7.1 3.0 21.9 6.4 Quartile 1 (Step) 3.3 23.8 4.8 3.2 23.2 4.7 3.1 22.6 4.6 Quartile 2 (Step) 4.0 28.9 8.0 3.9 28.0 7.8 3.8 27.2 7.5 Quartile 3 (Step) 5.4 38.7 12.5 5.2 37.3 12.0 4.9 35.5 11.4 Quartile 4 (Step) 8.6 62.6 24.6 8.2 59.4 23.3 7.8 56.2 22.1 Average (Step) 5.2 37.5 10.9 5.0 36.0 10.5 4.8 34.5 10.0 Average (Step) corr.h 3.9 28.1 8.2 4.1 29.7 8.6 3.7 26.3 7.6
aAll values are in percentages
bThe quartiles of LBGs and full LBG sample are taken from
Shapley et al. (2003).
c-band non-detections set to the 1 limiting magnitude
of the field
d is determined using an estimated IGM attenuation
factor, exp = 2.4 for 3.0 and
3.0
e = , where is
computed using the values for each respective quartile.
fIntermediate value between and and
equivalent to -band non-detections set to the 1 limiting
magnitude + 1.2
g-band non-detections set to
hValues corrected for 2 objects, AGN, and line-of-sight
contamination (see text)
5.2 The escape fraction of Lyman break galaxies
We have demonstrated that the redshift, colours, and observed LyC flux of small samples of LBG spectra are predictable using the modified composite spectra using only photometric and Ly EW information. The evolutionary tracks of the modified composite spectra have further utility in measuring the observed average LyC flux of the full LBG population when applied to statistically significant spectroscopic samples. In addition, the colour distribution of composite spectral samples with accurate photometric uncertainties can be used to estimate the average observed LyC flux for LBG photometric samples. However, it must be kept in mind that our approach estimates the average LyC flux acquired via spectroscopy or within photometric apertures and will not include LyC flux that may exist offset from the UV continuum (e.g., Iwata et al., 2009; Nestor et al., 2013) in which spectroscopic slits are typically aligned and/or LyC flux outside the area of the slit. Below, we estimate the average observed LyC flux of the 3 LBG population by matching the colours and Ly EWs of individual S03 spectra with the composite spectra predictions.
5.2.1 The average Lyman continuum flux from 3 Lyman break galaxies
We compare the net Ly EW and colours of the 794 LBG spectra of Shapley et al. (2003) to a grid of composite spectra evolutionary tracks to measure the LyC flux on an individual galaxy basis. The grid includes the tracks shown in Figure 3, but contains many more tracks sampling higher resolution of values. The individual spectra are matched to their respective composite spectrum track based on their Ly EW and assigned the of the closest track value based on their colours. We use the results from this statistical sample to estimate the average LyC flux of 3 LBGs as determined by their photometry.
The uncertainties are 0.15 magnitudes, thus there is a small dispersion of the individual galaxies about the redshift expectations of their respective composite spectrum evolutionary track. In addition, there is a formal 0.25 magnitude uncertainty that increases to 0.6–0.7 magnitudes for objects near the magnitude limit (we consider drop-outs below). Finally, there can be an uncertainty in individual Ly EW measurements of 30–50 percent (Shapley et al., 2003) which would affect which composite spectral track the LBGs are assigned, in particular for border-line cases. As a result, the values for individual cases are rather coarsely estimated, however, the 200 galaxies in each quartile and the combined values of the 794 LBGs in the four quartiles provide us with an accurate average measure of the LyC flux of 3 LBGs meeting the standard colour-selection criteria.
When measuring the individual spectra, we assign drop-outs either the limiting magnitude of the field to provide an upper limit to the true level of observed LyC flux or 99.0 to provide a lower limit. The results from matching the data to the ‘flat’ and ‘step’ model grids are listed in Table 1.
Comparing the data to the ‘flat’ model yields an average = 4.3 and 4.0 percent for magnitude limit and 99.0 drop-out assignments, respectively. To determine how these values relate to the intrinsic escape fraction of LyC photons from 3 LBGs, we refer to equation 1 which shows that = . We obtain by correcting by an estimated 3.0 average IGM attenuation factor, exp = 2.4 (e.g., Shapley et al., 2006), and a standard assumption of 3.0. We use the extinction law of Calzetti et al. (2000) and mean values for each quartile to determine . These assumptions produce = 31.3 and 29.1 percent and = 9.1 and 8.4 percent for the two drop-out assignments, respectively.
The ‘step’ model produces an average = 5.2 and 4.8 percent; = 37.5 and 34.5 percent; and = 10.9 and 10.0 percent for the magnitude limit and 99.0 drop-out assignments, respectively. There are small, or no, differences between the ‘flat’ and ‘step’ models on the vs. plane for 3.2 LBGs, but the differences become significant at higher redshifts. Given that the ‘step’ model provides a potentially better fit to the reported LBG measurements in the literature, especially for the Steidel et al. (2001) data at 3.4, we report the ‘step’ model values. Moreover, we adopt 5.0 and = 10.5 percent for 3 LBGs, which are intermediate to the magnitude limit and 99.0 assignment values. We find that these values also equate to when assigning drop-outs an average value 1.2 magnitudes fainter than their field 1 limiting magnitudes. The results for the intermediate case for both models are listed in Table 1 for comparison.
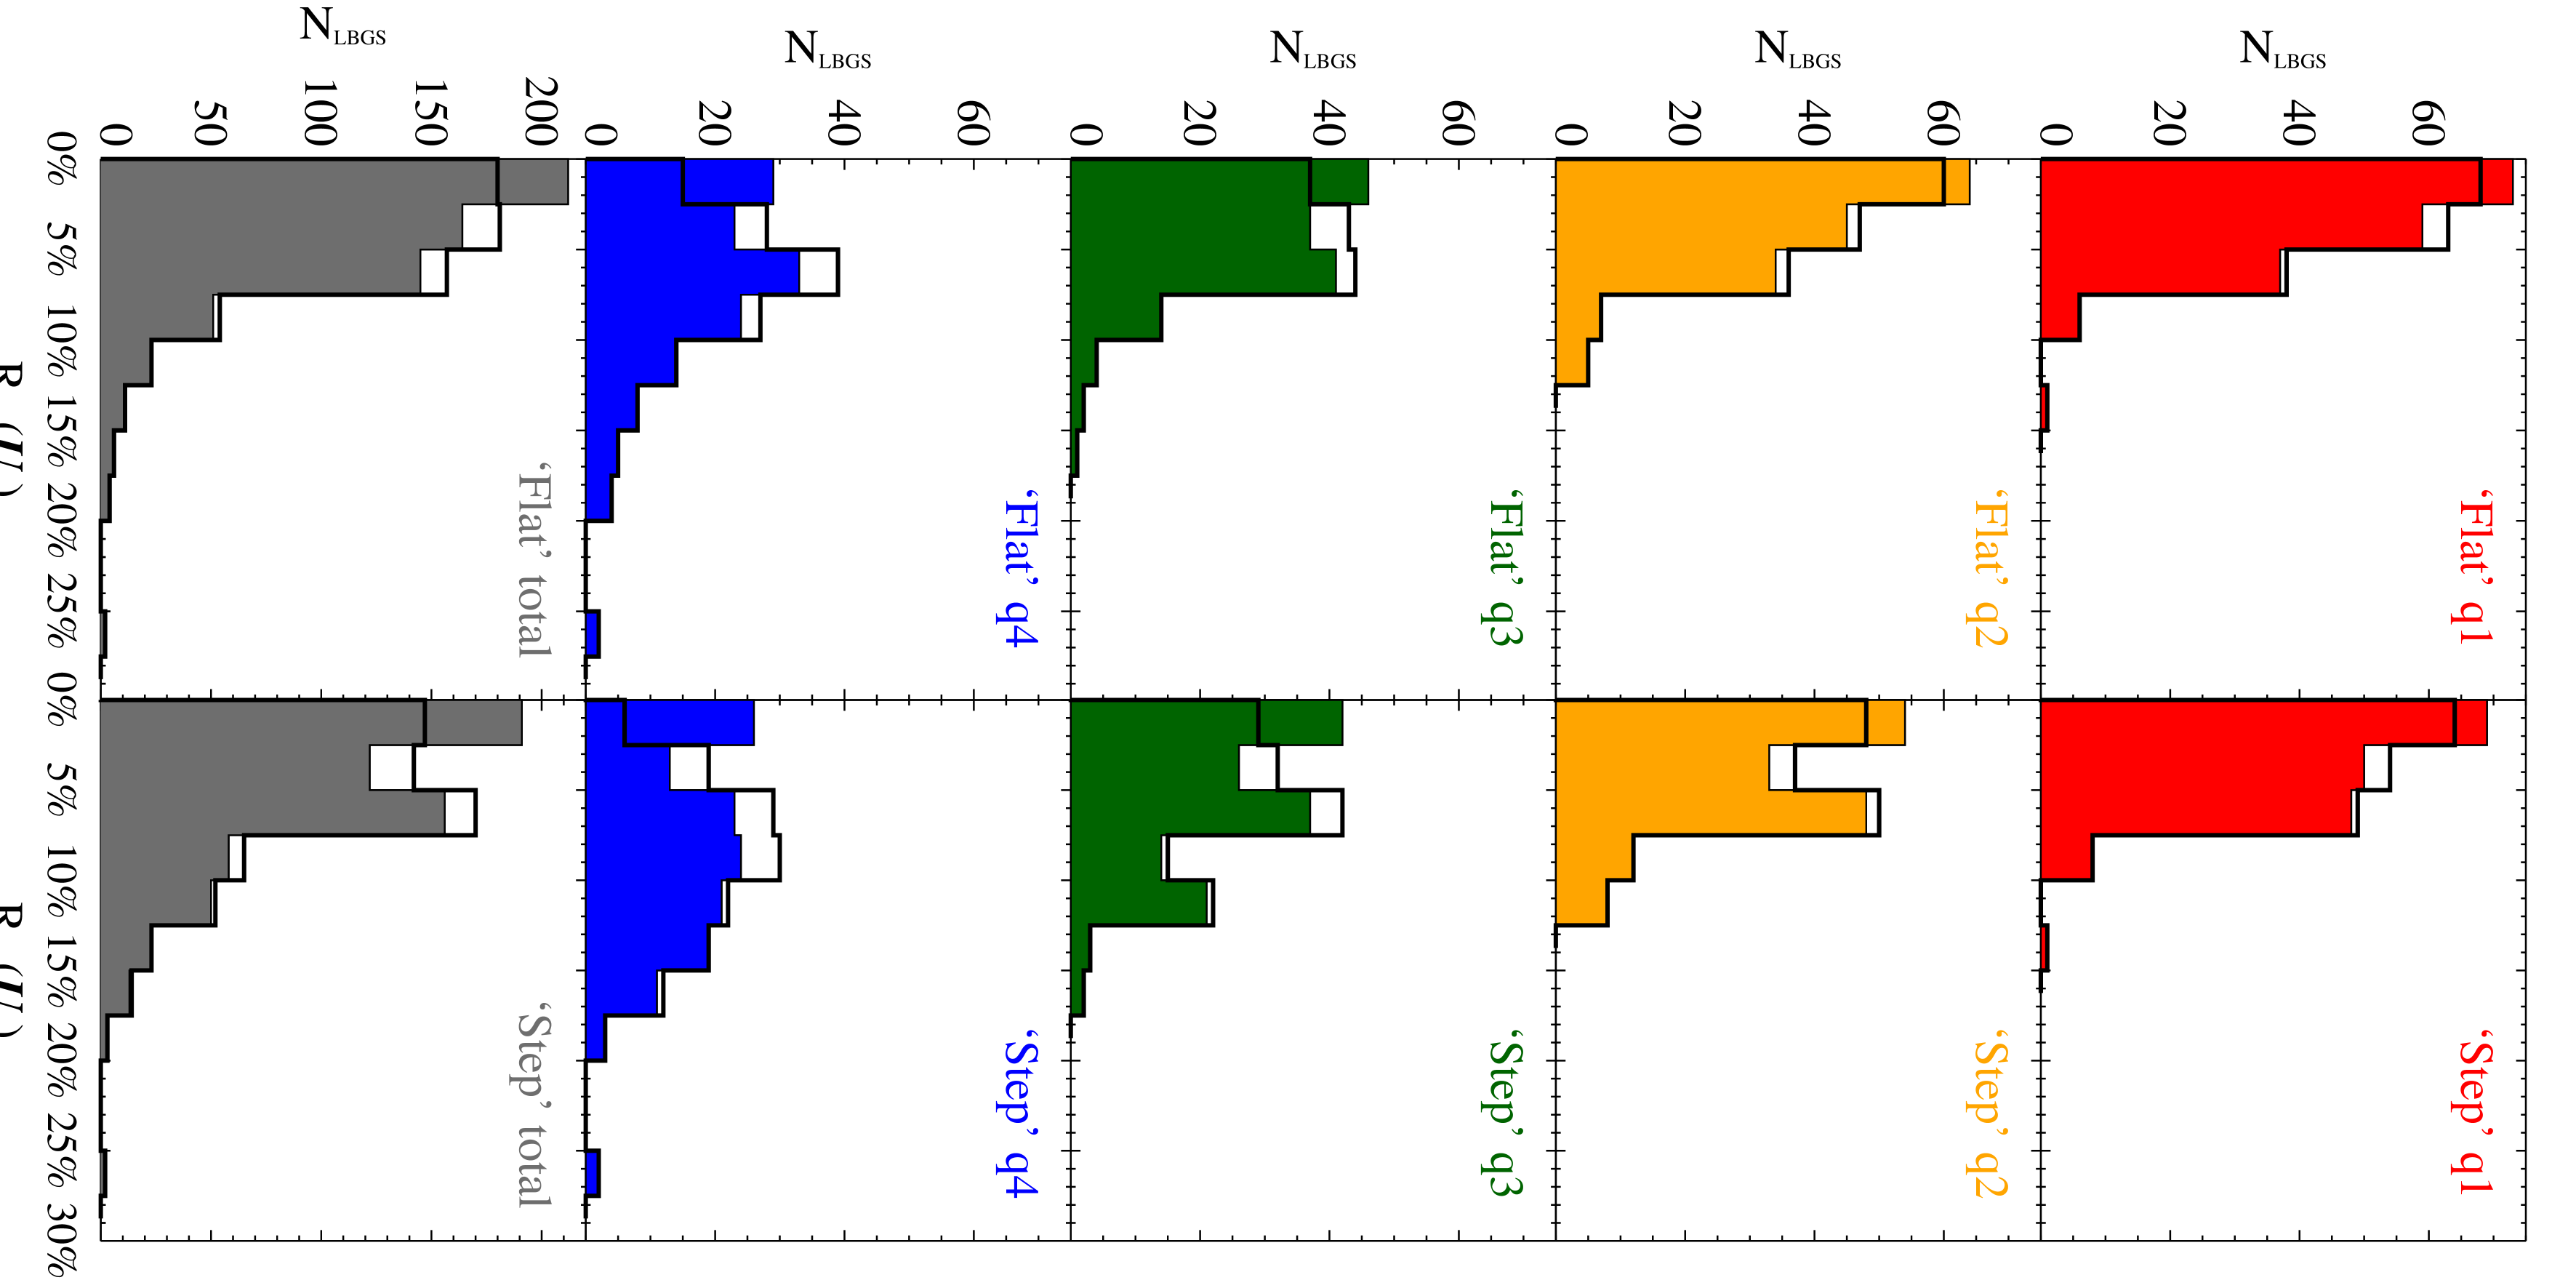
5.2.2 Lyman break galaxy distributions
Histograms of the distributions for the two models and the separate quartiles are presented in Figure 5. The distributions differ and the data imply that LBGs with stronger net Ly in emission have higher . One explanation for this relationship is the restriction of galaxies to the standard colour-selection region. The bluer colours of LBGs with properties similar to quartile 3 and 4 are able to have higher and still meet the standard criteria, whereas LBGs with properties similar to quartile 1 and 2 with moderate to high will fall out and their distribution will be truncated. An important result of the distributions is that the truncations demonstrate that there exists a significant fraction of galaxies outside the standard criteria and that those galaxies have higher and .
We perform two-sided Kolmogorov-Smirnov tests to quantify the spectral type distributions and report the results in Table 2. Neighbouring spectral types show a small to good probability of being pulled from the same parent population ( 0.02 –0.78) except for quartile 3 and quartile 4 LBGs. These latter two spectral samples have K–S probabilities of 10-5 to 10-6 indicating a more dramatic change in behaviour of the quartile 4 LBGs with the others. Further solidifying this result are the K–S test probabilities ranging from 10-11 to 10-23 for quartile 4 LBGs when tested with quartile 1 and quartile 2. Nearly all quartile 4 LBGs would be detected as LAEs in narrowband surveys. Because LAEs are a natural extension to the quartile 4 LBG population (e.g., Cooke, 2009; Cooke, Omori, & Ryan-Weber, 2013), the indication of a higher LyC escape fraction from quartile 4 LBGs/LAEs compared to other LBG quartiles is consistent with LyC measurements of 3 LAEs compared to LBGs (Nestor et al., 2013).
The results were assigned to the composite spectral samples with the photometric corrections discussed in §4 (i.e., a conservative addition of a redleak, spectroscopic slit flux loss, and drop-outs set to the limiting magnitude) and compared to the photometric data. To estimate the range of observed or predicted , each sample was taken as a whole or divided into multiple parts. Overall, any value of from zero to 5 percent produces a distribution that has the general form of the S03 data and consists of a significant fraction of galaxies that extends outside the standard region. As the value of is increased, the mean of the distribution ranges from approximately that shown in the upper panel of Figure 2 to approximately that of the data (Figure 2, bottom panel).
To test whether the truncations seen in Figure 5 are due entirely to the standard colour-selection criteria or whether some fraction of the relationship is intrinsic, the subsets of the composite spectral samples were given equivalent values and tested at successively higher values. The resulting distributions do not reflect the form or mean of the data in the sense that, as the value of is increased, the distributions shift to smaller values as they moves to smaller values. Constant values of 10 percent evenly assigned to each quartile are ruled out. However, good matches to the data distribution only persist when we assign a range of values that are dependent on quartile consistent with that found for the data, such that quartiles with stronger Ly emission have higher values of . The results suggest that part of the relationship between the level of observed LyC flux and the observed strength of Ly emission may be intrinsic.
LBG spectral type K-S test resultsa Samplesb Flat (lim)c Flat (99)d Step (lim)c Step (99)d Q1, Q2 6.410-1 7.810-1 1.610-1 2.110-1 Q1, Q3 4.610-3 1.110-2 2.910-5 1.610-4 Q1, Q4 3.910-14 7.710-12 3.710-23 7.110-19 Q2, Q3 1.010-1 1.410-1 2.210-2 3.310-2 Q2, Q4 4.810-13 1.810-11 2.110-16 6.010-13 Q3, Q4 1.510-6 9.810-6 2.010-7 9.710-6
aTwo-sided Kolmogorov-Smirnov probability that the two samples are
pulled from the same parent population.
bSamples Q1–Q4 refer to quartile 1–4
c-band non-detections set to the 1 limiting magnitude
of the field
d-band non-detections set to
5.2.3 Contamination to
Foreground (lower redshift) objects in the line of sight to LBGs can introduce restframe non-ionising flux that could contaminate LyC flux measurements. In fact, the significant LyC flux observed for one of the LBGs in the sample of Shapley et al. (2006) is likely longer wavelength flux from a lower redshift galaxy (cf., Nestor et al., 2013) resulting in 7% contamination. In addition, Nestor et al. (2013) find line-of-sight contamination for the LBGs in their narrowband survey with LyC detections may be as high as 62%, however, 38 LBGs in their sample of 41 have no detectable flux, thus the overall LBG contamination from line-of-sight sources that are capable of contributing measurable flux (to m ) to the -band is likely 7 percent.
We remark that our composite spectra are constructed from the LBG spectra of S03. As such, they accurately represent the colours of 3 LBGs selected using standard colour selection criteria longward of the Lyman limit. Because we replace all flux shortward of the Lyman limit with artificial flux values, the composite spectra and the composite spectral sample distributions are not subject to line-of-sight contamination. Only the actual data of S03 on an individual object basis are subject to contamination, and thus our 3 LBG and estimates. Below, we estimate the fraction of 3 LBGs in the S03 sample that have contamination to their -band photometry by foreground line-of-sight sources down to the faintest level which would affect our LyC flux measurements, . However, first we review a few relevant photometric details.
In the S03 survey, the images were aligned/registered and then smoothed with a Gaussian kernel to the same seeing FWHM. Then LBGs are identified in the -band image by their 1500Å flux in isophotal apertures with 2 arcsec diameters, which were then grown to 3 arcsec (0.1-0.15 magnitude difference between the two apertures). The pixels defining the extent of the -band detections for each LBG were then used to determine the flux in the other filters. This was done because many of the objects are not detected in the -band. The half-light radii of 3 LBGs range from 1–5 kpc, or 0.1–0.6 arcsec (Ferguson et al., 2004). Because the seeing FWHM for the observations ranged from 0.7–1.2 arcsec, 3 LBGs appear as point sources or near point sources. As as result, lower redshift objects must overlap the point source-like area of the LBGs in the filter if they are to contribute to the LyC flux.
This constraint is one important difference between our measurement and narrowband LyC imaging searches. We are not measuring the extended and/or offset LyC flux that is commonly observed in those surveys. Extended and/or offset flux increases the probability of lower redshift source contamination and source confusion by probing an additional area with respect to the stellar component of the LBG. However, because we do not include extended or offset regions, we measure a lower limit to the true amount of escaping LyC flux but potentially a higher value than that measured through a spectroscopic slit.
Low redshift sources have a large range in magnitude and sizes/shapes and a high density in the deep images, whereas S03 LBGs are small sources with = 19.0–25.5 and a relatively low surface density of 1.8 LBGs arcmin-1. Thus, it is much more accurate to simulate the overlap of field sources on the areas of LBGs than vice-versa. Lower redshift objects in the line of sight that are 1–4 magnitudes fainter in the -band than the -band for a given LBG could measurably contribute to the LyC flux. Finally, brighter objects that are not completely extracted or that pose problematic blending with the LBGs can affect the photometry in a way to push the colours outside the standard selection region.
We use the 5-year stacked, wide-field images of the Canada-France-Hawaii Telescope Legacy Survey (CFHTLS) Deep Fields333General information for the CFHTLS Deep fields and data products can be found at: www.cfht.hawaii.edu/Science/CFHLS/cfhtlsdeepwidefields.html and the associated links to estimate the fraction of LBGs with line-of-sight contamination. The filter is similar to, but has a redder bandpass than, the filter, the and bands are similar, and the filter falls in-between the and filters. The CFHTLS has a limiting magnitude of = 27.4, signal-to-noise ratio (S/N) = 5. If we include all objects with , we probe depths to roughly 28.0, similar to the 1 limits of the S03 survey. The CFHTLS images provide a deep test of the contamination and the results are conservative in the sense that most field objects are brighter in as compared to the bluer bandpass.
We generate simulated LBGs using the composite spectra technique which uses magnitudes from the -band magnitude distribution and computes their and magnitudes assuming zero LyC flux. We then compute the magnitudes for the LBGs and place them in the CFHTLS square degree images with the surface density and area equivalent to S03 survey fields. As a control, we lay the same simulated LBGs in a “blank” image with simulated sky noise at the level measured in the CFHTLS images.
The LBGs are then extracted using (Bertin & Arnouts, 1996) in a consistent manner to S03. We then compare object magnitudes from the “blank” and real images to the faint limit where we find equal numbers of positive and negative flux enhancements as a result of sky fluctuations. Objects that had their magnitudes enhanced to the point where they were pushed out of the standard selection region are not included. We measure a 5.3% net positive enhancement to the -band flux of objects in the standard LBG selection region. As an additional test, we multiply the segmentation map for the LBGs in the control field with the -band segmentation map which uses -band defined apertures (to mimic S03 -band apertures). We find detection of -band flux in 5.2% of the apertures. As a result, we adopt a 5.3% contamination fraction to the S03 sample from lower redshift line-of-sight sources.
Finally, for a total contamination to the LyC flux from all sources, we include an estimate of 2 sources and AGN contained in the S03 data. From their 940 spectra, 40 Galactic stars, five 2 galaxies, and 28 AGN were identified. Combining this 7.8% contamination with the line-of-sight contamination, we estimate a total 13.1% contamination to the photometric sample. Assuming that the contaminants make up the 13.1% of the galaxies that have the highest , we remove these objects from the data and produce the corrected average ‘flat’ and ‘step’ model values listed in Table 1.
We conclude that foreground and AGN contamination are not the main contributors to the -band flux excess observed in the S03 data distribution (Figure 2, lower panel) and that genuine LyC flux remains the best candidate to explain the bulk of the excess.
6 Lyman continuum galaxies
The modified composite spectra evolutionary tracks and distribution truncations, the colour-colour distribution of the data, and the spectroscopic confirmations of the VVDS all point to the existence of a population of galaxies outside the standard criteria with bluer colours. Because the evolutionary tracks of the composite spectra indicate that these galaxies have moderate to significant amount of LyC flux, and that essentially none should have zero LyC flux, we refer to galaxies in this region as Lyman continuum galaxies (LCGs).
The full behaviour of 2.7–3.5 galaxies can be visually reproduced by extending the maximum range of the quartile values and keeping the quartile-to-quartile ratio (i.e., countering the effect of truncation). Figure 6 presents one such realisation when extending the measured quartile values in Table 1 by a factor of 1.5. All values of in Table 1 produce similar distributions, along with multiplicative factors ranging from 1–2.5. The match in Figure 6 shows that LCGs make up 32 percent of the full 3 galaxy population, or 50% the number of LBGs. Interestingly, the fraction of LCGs is only a few percent lower without any extension of the values. If these realisations are representative of the true galaxy distribution, the current census of UV-luminous 3 star-forming galaxies needs to be increased by a factor of 1.5. Moreover, LCGs are expected to have high levels of observed LyC flux and may contribute as much total ionising flux as the LBG population or more.
Statistical fits do not yield unique solutions to the distribution fits because of the unknown LCG distribution. As a result, our simple distribution prescription in Figure 6 is not a formal fit, but is meant to help illustrate the vs. location of 3 LCGs and estimate their number density. Nevertheless, our attempts to mimic the photometric distribution of the data using a wide range of values, and distributions of the values, have uncovered some interesting results and unavoidable constraints for each quartile, and for the full population, that are reinforced by the distribution and LyC measurements of the 794 spectra.
Firstly, no combination of LyC flux assignments to the composite spectral samples, including zero LyC flux, can achieve a similar distribution as the data, and/or a peak density near the = + 1 boundary, without incurring a significant fraction of galaxies outside the standard LBG selection region. As discussed in §4, this fact is also revealed by the data distribution. The location on the colour-colour plane of the galaxies predicted outside the standard selection region is highly consistent with the colours of the spectroscopically confirmed VVDS 3 galaxies found in that region (Le Fèvre et al., 2005b; Paltani et al., 2007).
Secondly, the galaxies predicted outside the standard colour-selection region are expected to have moderate to high levels of observed LyC flux (1) from our composite spectral analysis and (2) because they have colours that are typical for their redshifts but bluer than typical colours, denoting an excess of -band flux. The -band probes the restframe LyC at 3 and any excess -band flux for a 3 galaxy equates to excess LyC flux.
Thirdly, to match the shape and location of the data distribution, must be assigned as a function of Ly EW (quartile) such that LBGs with strong Ly in emission (quartile 4) have higher observed LyC flux than those with successively weaker Ly emission. This relationship is seen for the individual spectra by quartile in Table 1 for both models and all magnitude assignments. From our assignment tests, the relationship appears to exist beyond the effect caused by the constraint of galaxies to the standard colour-selection region. A positive correlation between Ly and escaping LyC flux is expected to first order (after the net loss in Ly to LyC photons) given that the Ly and LyC radiation transfer are both sensitive to the presence of Hi in the ISM. Thus it may be that galaxies with Ly in emission and their corresponding properties, such as bluer continua, weaker ISM metal-line features, compact morphology, field-like environments, and potentially higher merger rates, or their orientation may cause higher intrinsic LyC escape fractions.
Finally, the composite spectra evolutionary tracks indicate that a fraction of 3.0 LCGs, comprised largely of quartile 4 galaxies, fall in the standard ‘BX’ selection region, whereas 3.0 LCGs (from all quartiles) reside outside any standard selection region. Essentially all quartile 1 and 2 LCGs with 10 percent are missed using standard selection criteria and all LCGs from all quartiles with 1 percent are missed using standard 4 criteria.
6.1 Estimating the average Lyman continuum flux from Lyman continuum galaxies
A rough estimate of the mean observed LyC flux of LCGs can be gleaned from our match of the composite spectral samples to the data distribution. A series of input values for both models that match the data distribution produce similar results and return an = 15.8 percent. Using the same assumptions above for LBGs, this value corresponds to = 33.0 percent. Both values are theoretical and reflect the observed LyC flux after contamination correction. Using this approach on the combined set of 3 galaxies, we find = 7.6 percent and = 15.9 percent. These values are model dependent and in §3 we discuss that the intrinsic value of may vary between 1–5.5. In addition, it may be the case that LCGs are found along lines of sight with the fewer than average intervening absorption systems and thus the attenuation by the IGM may be lower.
7 Summary
The 3–4 Lyman break technique preferentially selects galaxies with little or no LyC flux. A re-examination of the distribution of 3 LBGs on the vs. plane indicates that a significant fraction of 3 galaxies reside outside the standard LBG colour selection region. To assess the completeness of 3–4 LBG colour selection and to better understand LBG LyC flux measurement results in the literature, we perform spectrophotometry on composite spectra formed from 794 3 LBGs and apply various levels of escaping ionising ( 912Å) flux. We find the following results from the behaviour of the evolutionary tracks of the modified composite spectra and the colour distributions of the composite spectral samples that include photometric uncertainties.
-
1.
Spectrophotometry of composite spectral samples built directly from the data, with accurate colours and magnitudes, do not reproduce the vs. distribution of the data when assuming zero LyC flux. A large discrepancy between the colour distribution of the composite spectral samples and the data remains after accounting for potential filter redleak, ‘-drop’ magnitude assignments, wavelength-dependent flux loss in the spectroscopic observations, and lower redshift line-of-sight contamination. The discrepancy can be resolved by an increase in -band flux from the galaxies which, at 3–4, corresponds to restframe LyC flux.
-
2.
With the addition of LyC flux to the composite spectra, the evolutionary tracks accurately reproduce the LyC flux detections in the literature. Using only the colours and Ly EWs of galaxies, the composite spectra can accurately predict their redshifts, properties, and LyC flux.
-
3.
We define , the fraction of observed LyC (from restframe wavelength to 912Å) to non-ionising UV flux, as a more intuitive means to describe the observed LyC flux in galaxy spectroscopy and photometry. denotes the ratio of LyC integrated from the shortest wavelength probed by the filter for the redshift of the data to 912Å.
-
4.
We compare the Ly EWs and colours of the 794 spectra of Shapley et al. (2003) to the composite spectra evolutionary tracks and measure their expected LyC flux as a statistical sample of the 3 LBG population. We find an average percent and a corresponding percent for LBGs at meeting the standard colour-selection criteria (contamination corrected). To derive from , we assume a 3 IGM attenuation factor of 2.4, an intrinsic UV continuum to LyC luminosity density fraction of 3.0, and the extinction law of Calzetti et al. (2000) and the values of the composite spectra quartiles.
-
5.
The LyC measurements of the individual spectra find that LBGs with stronger Ly EW have higher LyC flux. The cause of this effect, in part, is the result of the restriction of objects to the standard colour-selection region. However, to match the photometric distribution of the data we are forced to assign a higher level of LyC flux to composite spectral samples with higher Ly EW which suggests that part of this relationship may also be intrinsic. Both Ly and LyC radiation transfer are sensitive to Hi. Thus, it may be that galaxies with Ly in emission, and their corresponding properties such as bluer continua, weaker ISM metal-line features, compact morphology, field-like environments, and potentially higher merger rates, or their orientation cause higher LyC escape fractions.
-
6.
Both the distribution of the data and the evolutionary tracks of the modified composite spectra require a significant fraction of 3–4 galaxies residing outside the standard colour-selection region. Galaxies at 3–4 with colours outside the standard LBG selection region have been spectroscopically confirmed by the VVDS magnitude-limited survey and reside in the locations predicted by the evolutionary tracks of the modified composite spectra.
-
7.
Many of the galaxies found outside the standard colour-selection region are missed by other (i.e., lower redshift) selection criteria. The ‘missed’ galaxies are expected to have moderate to high levels of escaping LyC flux from their bluer colours and from the predictions of the composite spectra evolutionary tracks and are termed Lyman continuum galaxies (LCGs). LCGs are estimated to increase the census of 3 galaxies by a factor of 1.5.
-
8.
Matching the composite spectral samples to the photometric data distribution, we estimate = 15.8 and = 33.0 percent for LCGs and = 7.6 and = 15.9 percent for the combined 3 LBG + LCG population using the same assumptions for LBGs above.
-
9.
LCGs reside in a region of colour-colour space with a high density of low redshift sources. We find that examining the colours of 4 LCGs on the vs. plane, typically used for 3 colour selection, provides one means to increase the selection efficiency. A parallel analysis using deep near-UV imaging can be used to efficiently select 3 galaxies.
Our analysis has helped confirm that conventional LBG colour-selection criteria do not include the entire 3 galaxy population. This point has been know since the criteria conception and has been reinforced by spectroscopic identifications of 3–4 galaxies outside the standard 3 selection region. The modified composite spectra provide a physical basis for the existence of LCGs and indicate that they require flux in the bluest filter (i.e., the ‘drop-out’ filter) and, thus, have high levels of LyC flux.
Efficient selection of 3–4 remains a challenge, however, deep broadband and medium band infrared (restframe optical) imaging provides a promising approach. The number density of LBGs remains to be quantified as well as properties that may facilitate high escaping flux, including their UV continua slopes, SEDs, line-of-sight Ly forest decrements, average outflow strengths, orientation, and the effects of environment and interactions. The measured LyC flux for LCGs, when added to the LyC flux measured here for LBGs, will help clarify the full contribution of galaxies to the reionisation of the Universe.
Acknowledgments
The authors would like to thank C. C. Steidel for helpful discussions. JC acknowledges the support of the Australian Research Council Future Fellowship grant FT 130101219. ERW acknowledges the support of the Australian Research Council grant DP 1095600 and CGD acknowledges the support by the Victorian Government. This research uses data from the VIMOS VLT Deep Survey, obtained from the VVDS database operated by Cesam, Laboratoire d’Astrophysique de Marseille, France. This work has made use of the VizieR catalogue access tool, CDS, Strasbourg, France. Photometry presented here are based on observations obtained with MegaPrime/MegaCam, a joint project of CFHT and CEA/IRFU, at the Canada-France-Hawaii Telescope (CFHT) which is operated by the National Research Council (NRC) of Canada, the Institut National des Science de l’Univers of the Centre National de la Recherche Scientifique (CNRS) of France, and the University of Hawaii. This work is based in part on data products produced at Terapix available at the Canadian Astronomy Data Centre as part of the Canada-France-Hawaii Telescope Legacy Survey, a collaborative project of NRC and CNRS.
References
- Barkana & Loeb (1999) Barkana, R. & Loeb, A. 1999, ApJ, 523, 54
- Becker, Rauch, & Sargent (2007) Becker, G. D., Rauch, M., & Sargent, W. L. W. 2007, ApJ, 662, 72
- Becker et al. (2013) Becker, G. D., Hewett, P. C., Worseck, G., & Prochaska, J. X. 2013, MNRAS, 430, 2067
- Bertin & Arnouts (1996) Bertin, E. & Arnouts, S. 1996, A&AS, 117, 393
- Bielby et al. (2011) Bielby, R. M., Shanks, T., Weilbacher, P. M., et al. 2011, MNRAS, 414, 2
- Bielby et al. (2013) Bielby, R., Hill, M. D., Shanks, T., et al. 2013, MNRAS, 430, 425
- Bland-Hawthorn & Maloney (1999) Bland-Hawthorn, J. & Maloney, P.R. 1999, ApJ, 510, L33
- Bouwens et al. (2007) Bouwens, R. J., Illingworth, G. D., Franx, M., & Ford, H. 2007, ApJ, 670, 928
- Bouwens et al. (2011) Bouwens, R. J., Illingworth, G. D., Oesch, P. A., et al. 2011, ApJ, 737, 90
- Bruzual & Charlot (2003) Bruzual, G., & Charlot, S. 2003, MNRAS, 344, 1000
- Bullock, Kravtsov, & Weinberg (2000) Bullock, J. S. and Kravtsov, A. V. & Weinberg, D. H. 2000, ApJ, 539, 517
- Calverley et al. (2011) Calverley, A. P., Becker, G. D., Haehnelt, M. G., & Bolton, J. S. 2011, MNRAS, 412, 2543
- Calzetti et al. (2000) Calzetti, D., Armus, L., Bohlin, R. C., et al. 2000, ApJ, 533, 682
- Chapman et al. (2005) Chapman, S. C., Blain, A. W., Smail, I., & Ivison, R. J. 2005, ApJ, 622, 772
- Cooke et al. (2005) Cooke, J., Wolfe, A. M., Prochaska, J. X., & Gawiser, E. 2005, ApJ, 621, 596
- Cooke et al. (2006) Cooke, J., Wolfe, A. M., Gawiser, E., & Prochaska, J. X. 2006, ApJ, 652, 994
- Cooke (2009) Cooke, J. 2009, ApJL, 704, L62
- Cooke et al. (2010) Cooke, J., Berrier, J. C., Barton, E. J., Bullock, J. S., & Wolfe, A. M. 2010, MNRAS, 403, 1020
- Cooke, Omori, & Ryan-Weber (2013) Cooke, J., Omori, Y, & Ryan-Weber, E. V. 2013, MNRAS, 433, 2122
- Daddi et al. (2004) Daddi, E., Cimatti, A., Renzini, A., et al. 2004, ApJ, 617, 746
- Dove & Shull (1994) Dove, J.B. & Shull, J.M., 1994, ApJ, 430, 222
- Efstathiou (1992) Efstathiou, G. 1992, MNRAS, 256, 43
- Ellis et al. (2013) Ellis, R. S., McLure, R. J., Dunlop, J. S., et al. 2013, ApJL, 763, L7
- Fan et al. (2006) Fan, X., Strauss, M. A., Becker, R. H., White, R. L., Gunn, J. E., Knapp, G. R., Richards, G. T., Schneider, D. P., Brinkmann, J., & Fukugita, M. 2006, AJ, 132, 117
- Ferguson et al. (2004) Ferguson, H. C., Dickinson, M., Giavalisco, M., et al. 2004, ApJL, 600, L107
- Fernandez & Shull (2011) Fernandez, E. R. & Shull, J. M. 2011, ApJ, 731, 20
- Finkelstein et al. (2010) Finkelstein, S. L., Papovich, C., Giavalisco, M., et al. 2010, ApJ, 719, 1250
- Finlator et al. (2012) Finlator, K., Oh, S. P., Özel, F., & Davé, R. 2012, MNRAS, 427, 2464
- Fontanot, Cristiani, & Vanzella (2012) Fontanot, F., Cristiani, S., & Vanzella, E. 2012, MNRAS, 425, 1413
- Fukugita et al. (1996) Fukugita, M., Ichikawa, T., Gunn, J. E., Doi, M., Shimasaku, K., & Schneider, D. P. 1996, AJ, 111, 1748
- Giallongo & Cristiani (1990) Giallongo, E., & Cristiani, S. 1990, MNRAS, 247, 696
- Gnedin et al. (2008) Gnedin, N. Y., Kravtsov, A. V., & Chen, H.-W. 2008, ApJ, 672, 765
- Guhathakurta et al. (1990) Guhathakurta, P., Tyson, J. A., & Majewski, S. R. 1990, ApJL, 357, L9
- Haardt & Madau (2012) Haardt, F. & Madau, P. 2012, ApJ, 746, 125
- Hopkins, Richards, & Hernquist (2007) Hopkins, P. F., Richards, G. T., Hernquist, L. 2007, ApJ, 654, 731
- Iliev et al. (2007) Iliev, I. T., Mellema, G., Shapiro, P. R., & Pen, U.-L. 2007, MNRAS, 376, 534
- Inoue et al. (2005) Inoue, A. K., Iwata, I., Deharveng, J.-M., Buat, V., & Burgarella, D. 2005, A&A, 435, 471
- Iwata et al. (2009) Iwata, I., Inoue, A. K., Matsuda, Y., et al. 2009, ApJ, 692, 1287
- Jiang et al. (2008) Jiang, L., Fan, X., Annis, J., Becker, R. H., White, R. L., Chiu, K., Lin, H., Lupton, R. H., Richards, G. T., Strauss, M. A., Jester, S., & Schneider, D. P. 2008, AJ, 135, 1057
- Jones et al. (2012) Jones, T., Stark, D. P., & Ellis, R. S. 2012, ApJ, 751, 51
- Komatsu et al. (2011) Komatsu, E., Smith, K. M., Dunkley, J., Bennett, C. L., Gold, B., Hinshaw, G., Jarosik, N., Larson, D., Nolta, M. R., Page, L., Spergel, D. N., Halpern, M., Hill, R. S., Kogut, A., Limon, M., Meyer, S. S., Odegard, N., Tucker, G. S., Weiland, J. L., Wollack, E., & Wright, E. L. 2011, ApJS, 192, 18
- Kuhlen & Faucher-Giguère (2012) Kuhlen, M., & Faucher-Giguère, C.-A. 2012, MNRAS, 423, 862
- Law et al. (2007) Law, D. R., Steidel, C. C., Erb, D. K., et al. 2007, ApJ, 656, 1
- Law et al. (2012) Law, D. R., Steidel, C. C., Shapley, A. E., et al. 2012, ApJ, 759, 29
- Le Fèvre et al. (2005a) Le Fèvre, O., Vettolani, G., Garilli, B., et al. 2005a, A&A, 439, 845
- Le Fèvre et al. (2005b) Le Fèvre, O., et al. 2005b, Nature, 437, 519
- Le Fèvre et al. (2013a) Le Fevre, O., Cassata, P., Cucciati, O., et al. 2013a, A&A, 559, A14
- Le Fèvre et al. (2013b) Le Fevre, O., Cassata, P., Cucciati, O., et al. 2013b, arXiv:1307.6518
- Lu & Zuo (1994) Lu, L., & Zuo, L. 1994, ApJ, 426, 502
- Ly et al. (2011) Ly, C., Malkan, M. A., Hayashi, M., et al. 2011, ApJ, 735, 91
- Madau, Haardt, & Rees (1999) Madau, P., Haardt, F. & Rees, M. J. 1999, ApJ, 514, 648
- McQuinn, Oh, & Faucher-Giguère (2011) McQuinn, M., Oh, S. P., & Faucher-Giguère, C.-A. 2011, ApJ, 743, 82
- Nestor et al. (2013) Nestor, D. B., Shapley, A. E., Kornei, K. A., Steidel, C. C., & Siana, B. 2013, ApJ, 765, 47
- Oke et al. (1995) Oke, J. B., Cohen, J. G., Carr, M., Cromer, J., Dingizian, A., Harris, F. H., Labrecque, S., Lucinio, R., Schaal, W., Epps, H., & Miller, J. 1995, PASP, 107, 375
- Paltani et al. (2007) Paltani, S., Le Fèvre, O., Ilbert, O., et al. 2007, A&A, 463, 873
- Pawlik, Schaye, & van Scherpenzeel (2009) Pawlik, A. H., Schaye, J., & van Scherpenzeel, E. 2009, MNRAS, 394, 1812
- Prochaska et al. (2009) Prochaska, J. X., Worseck, G., & O’Meara, J. M. 2009, ApJL, 705, L113
- Putman et al. (2003) Putman, M.E. and Bland-Hawthorn, J. and Veilleux, S. and Gibson, B.K. and Freeman, K.C. and Maloney, P.R., ApJ, 597, 948
- Razoumov & Sommer-Larsen (2006) Razoumov, A. O., & Sommer-Larsen, J. 2006, ApJL, 651, L89
- Razoumov & Sommer-Larsen (2010) Razoumov, A. O., & Sommer-Larsen, J. 2010, ApJ, 710, 1239
- Reichart (2001) Reichart, D. E. 2001, ApJ, 553, 235
- Ricotti & Shull (2000) Ricotti, M. & Shull, J. M. 2000, ApJ, 542, 548
- Robertson et al. (2013) Robertson, B. E., Furlanetto, S. R., Schneider, E., Charlot, S., Ellis, R. S., Stark, D. P., McLure, R. J., Dunlop, J. S., Koekemoer, A., Schenker, M. A., Ouchi, M., Ono, Y., Curtis-Lake, E., Rogers, A. B., Bowler, R. A. A. & Cirasuolo, M. 2013, ApJ, 768, 71
- Ryan-Weber et al. (2009) Ryan-Weber, E. V., Pettini, M., Madau, P., & Zych, B. J. 2009, MNRAS, 395, 1476
- Shapley et al. (2003) Shapley, A. E., Steidel, C. C., Adelberger, K. L., & Pettini, M. 2003, ApJ, 588, 65
- Shapley et al. (2006) Shapley, A. E., Steidel, C. C., Pettini, M., & Adelberger, K. L. 2006, ApJ, 651, 688
- Shull et al. (2012) Shull, J. M., Harness, A., Trenti, M., & Smith, B. D. 2012, ApJ, 747, 100
- Somerville (2002) Somerville, R. S. 2002, ApJL, 572, 23
- Songaila et al. (1990) Songaila, A., Cowie, L. L., & Lilly, S. J. 1990, ApJ, 348, 371
- Spitler et al. (2014) Spitler, L., et al. 2014, ApJL, submitted, arXiv:
- Steidel & Hamilton (1992) Steidel, C. C., & Hamilton, D. 1992, AJ, 104, 941
- Steidel & Hamilton (1993) Steidel, C. C., & Hamilton, D. 1993, AJ, 105, 2017
- Steidel et al. (1996) Steidel, C. C., Giavalisco, M., Pettini, M., Dickinson, M., & Adelberger, K. L. 1996, ApJ, 462, 17
- Steidel et al. (1999) Steidel, C. C., Adelberger, K. L., Giavalisco, M., Dickinson, M., & Pettini, M. 1999, ApJ, 519, 1
- Steidel et al. (2001) Steidel, C. C., Pettini, M., & Adelberger, K. L. 2001, ApJ, 546, 665
- Steidel et al. (2003) Steidel, C. C., Adelberger, K. L., Shapley, A. E., Pettini, M., Dickinson, M., & Giavalisco, M. 2003, ApJ, 592, 728
- Steidel et al. (2004) Steidel, C. C., Shapley, A. E., Pettini, M., Adelberger, K. L., Erb, D. K., Reddy, N. A., & Hunt, M. P. 2004, ApJ, 604, 534
- Trenti et al. (2010) Trenti, M., Stiavelli, M., Bouwens, R. J., et al. 2010, ApJL, 714, L202
- van Dokkum et al. (2006) van Dokkum, P. G., Quadri, R., Marchesini, D., et al. 2006, ApJL, 638, L59
- Wood & Loeb (2000) Wood, K. & Loeb, A. 2000, ApJ, 545, 86
- Wyithe & Bolton (2011) Wyithe, J. S. B. & Bolton, J. S. 2011, MNRAS, 412, 1926
- Yajima et al. (2011) Yajima, H., Choi, J.-H., & Nagamine, K. 2011, MNRAS, 412, 411
- Zahn et al. (2012) Zahn, O., Reichardt, C. L., Shaw, L., et al. 2012, ApJ, 756, 65