Early-Type Galaxy Star Formation Histories in Different Environments
Abstract
We use very high-S/N stacked spectra of 29,000 nearby quiescent early-type galaxies (ETGs) from the Sloan Digital Sky Survey (SDSS) to investigate variations in their star formation histories (SFHs) with environment at fixed position along and perpendicular to the Fundamental Plane (FP). We define three classifications of local group environment based on the ‘identities’ of galaxies within their dark matter halos: central ‘Brightest Group Galaxies’ (BGGs); Satellites; and Isolateds (those ‘most massive’ in a dark matter halo with no Satellites). We find that the SFHs of quiescent ETGs are almost entirely determined by their structural parameters and . Any variation with local group environment at fixed structure is only slight: Satellites have the oldest stellar populations, 0.02 dex older than BGGs and 0.04 dex older than Isolateds; BGGs have the highest Fe-enrichments, 0.01 dex higher than Isolateds and 0.02 dex higher than Satellites; there are no differences in Mg-enhancement between BGGs, Isolateds, and Satellites. Our observation that, to zeroth-order, the SFHs of quiescent ETGs are fully captured by their structures places important qualitative constraints on the degree to which late-time evolutionary processes (those which occur after a galaxy’s initial formation and main star-forming lifetime) can alter their SFHs/structures.
keywords:
galaxies: evolution – galaxies: abundances – galaxies: elliptical and lenticular1 Introduction
There are reasons to expect early-type galaxy (ETG) star formation histories (SFHs) to depend on a galaxy’s environment because the efficiency of relevant processes such as quenching by massive haloes (see, e.g., Kereš et al. 2005; Cattaneo et al. 2008), cooling flows (see, e.g., Miller, Melott & Gorman 1999), and satellite quenching (see, e.g., Gunn & Gott 1972; Lea & De Young 1976; Gisler 1976) should vary with environment. Thus, studies of differences in the star formation histories of early-type galaxies with environment can provide insight into mechanisms governing the formation and evolution of these galaxies.
However, such studies have yielded somewhat contradictory results. Many of them have suggested that, at a given luminosity, ETGs in low-density environments are younger and more metal-rich than those in clusters (e.g. Bernardi et al. 1998; Trager et al. 2000b; Poggianti et al. 2001; Terlevich & Forbes 2002; Caldwell, Rose & Concannon 2003; Proctor et al. 2004; Thomas et al. 2005; Sánchez-Blázquez et al. 2006; Cooper et al. 2010; Rogers et al. 2010). There are, however, conflicts with the above results: using a sample of ETGs from the Sloan Digital Sky Survey (SDSS), Bernardi et al. (2006) found galaxies in the most dense environments to be older than their counterparts in the least dense environments by 1 Gyr, but found no significant differences in metallicity with environment. Also using a sample of ETGs from SDSS, Gallazzi et al. (2006) found evidence that ETGs in low-density environments were less metal-rich than those in high-density environments. Harrison et al. (2011), studying a sample of ETGs drawn from four clusters, found no significant differences in the ages, metallicities, or -element abundance ratios between galaxies within clusters and those found in their outskirts. Comparing early-type galaxies in clusters and their field contemporaries, Rettura et al. (2011) found no difference in the ages of cluster and field ETGs, but found that field ETGs were formed over longer time-scales than those in clusters. It is clear that there is still much to be understood about the relationship between the stellar population properties (SPPs) of early-type galaxies and their environments.
One possible explanation for the contradictions among these results is entanglement between trends in the stellar populations with environment and those with other galaxy parameters. For example, the above studies distinguished the environments of ETGs by comparing galaxies in groups, clusters, and the field. Such an environmental distinction is made ambiguous by known correlations between ETG and environment, such that both high-mass, bright red galaxies and low-mass, faint red galaxies are preferentially found in denser environments (e.g. Hogg et al. 2003; Mo et al. 2004; Blanton et al. 2005b; Croton et al. 2005; Hoyle et al. 2005). If the SPPs show trends with galaxy parameters that are environmentally dependent, such as , then studies comparing the stellar populations of all galaxies at fixed environment vs. those comparing galaxies at, for example, fixed or fixed central stellar velocity dispersion and fixed environment will all give different results.
To zeroth-order, ETGs are observed to form a one-dimensional (1D) family with their SPPs showing strong trends with galaxy mass. Studies have sought to characterize these trends in the stellar populations of ETGs along luminosity , , or . In general, these studies have found stellar metallicities to increase with increasing galaxy mass – the well-known mass-metallicity relation (e.g. Henry & Worthey 1999; Nelan et al. 2005; Smith, Lucey & Hudson 2007; Koleva et al. 2011). These studies have also established that the SPPs of more massive ETGs tend to be older (to have formed the bulk of their stars at earlier times) and to have formed over shorter time-scales than their lower-mass counterparts (e.g. Heavens et al. 2004; Kodama et al. 2004; Juneau et al. 2005; Nelan et al. 2005; Thomas et al. 2005; Jimenez et al. 2007; Smith et al. 2007). This has come to be called ‘archaeological downsizing’. The results of these studies are consistent with those which demonstrate that is the best predictor of the SFHs of ETGs over , , or dynamical mass (Trager et al. 2000b; Graves, Faber & Schiavon 2009a,b; Rogers et al. 2010; van der Wel et al. 2009; Wake, van Dokkum & Franx 2012).
The SFHs of ETGs, however, are not purely a 1D family, but are observed to compose at least a 2-parameter family (Trager et al. 2000b; Graves et al. 2009b; Graves, Faber & Schiavon 2010; Springob et al. 2012). Graves et al. (2010) showed the stellar populations to map onto the Fundamental Plane (FP) of ETGs (see e.g. Dressler et al. 1987; Djorgovski & Davis 1987; Jørgensen, Franx & Kjærgaard 1996) such that it is possible to estimate the SPPs and, thus, the SFHs of quiescent ETGs by their locations in FP-space. The stellar populations of quiescent ETGs were shown to scale systematically with two relevant structural parameters: and surface brightness residuals from the FP, . Mean light-weighted age, [Fe/H], [Mg/H], and [Mg/Fe] all increase with increasing , while at fixed , as increases, [Fe/H] and [Mg/H] increase while age and [Mg/Fe] decrease. These results led the authors to propose a premature truncation model in which the onset time and duration of star formation in quiescent ETGs depend on such that higher- galaxies are older and were formed over shorter time-scales, while at fixed , galaxies offset to lower had star formation truncated earlier than those offset to higher . Thus, according to this model, star formation is similar for galaxies at similar , while their SPPs can still vary according to differences in truncation time, in a way that scales systematically with . Furthermore, stellar mass-to-light ratios at fixed are nearly constant (Graves & Faber, 2010). Thus the variations are primarily variations in stellar mass surface density , and high- galaxies are in fact galaxies with high and (typically) high for a given .
If the SFHs of ETGs are a 2D family, then studies characterizing trends in the SPPs with environment at fixed vs. at fixed , for example, will in general yield different and ambiguous results. We therefore study the environmental dependence of the SPPs of ETGs at fixed position in FP-space (along fixed structural parameters shown by Graves et al. (2010) to control the SFHs of ETGs). This allows us to identify stellar population differences due solely to environment, as opposed to those due also to differences in galaxy structure as a function of environment.
To quantify galaxy environment we use the halo-based group-finding algorithm of Yang et al. (2007),111We use the results of the group-finding algorithm of Yang et al. (2007) applied to SDSS DR7. which assigns individual galaxies to their respective dark matter haloes, assigns halo masses, and distinguishes between the most massive galaxies in groups, and satellites. Previous authors have introduced various other measures of galaxy environment. Two of the most common of these are the projected number density of galaxies above a given magnitude limit (e.g. Dressler 1980; Lewis et al. 2002; Gómez et al. 2003; Goto et al. 2003; Balogh et al. 2004a, b; Tanaka et al. 2004; Cooper et al. 2008, 2010, 2012) and the clustering strength of galaxies using the two-point correlation function (e.g. Wake et al. 2004; Croom et al. 2005; Li et al. 2006; van den Bosch et al. 2007) or a marked correlation function (e.g. Beisbart & Kerscher 2000; Sheth & Tormen 2004; Skibba et al. 2006, 2009). The first of these has the disadvantage that its physical interpretation depends on the environment itself (see Weinmann et al. (2006)), while the latter has the disadvantage that it assigns halo masses to galaxies in a statistical sense, rather than for individual galaxies (Pasquali et al., 2010). We use the halo-based group-finding algorithm of Yang et al. (2007) because it is free of these ambiguities and provides an intuitive measure of an individual galaxy’s environment.
Rogers et al. (2010) recently used the galaxy group catalogues of Yang et al. (2007) to study differences in local ETG SPPs with environment (central vs. satellite and group halo mass ) at fixed , and found centrals to have younger ages and significant recent star formation compared to satellites of the same . Pasquali et al. (2010) conducted a similar study for local galaxies at fixed , and found satellite galaxies to be older and more metal-rich than centrals at fixed (we note, however, that comparison of the results we present here with those of Pasquali et al. (2010) is ambiguous because the authors did not make any morphological or emission cut to their galaxy sample, whereas we study a sample of spectroscopically early-type galaxies). These studies, however, characterized the environmental dependence of the SPPs only along galaxy mass, whereas we have said that the SPPs have been shown to comprise at least a 2D family, with at least two structural controlling parameters ( and ). We therefore ask a similar question as Rogers et al. (2010) and Pasquali et al. (2010) except, extending upon the work of Graves et al. (2010), we study differences in the stellar population properties of quiescent early-type galaxies with environment at fixed position in FP-space. When we compare galaxies at the same place in FP-space, do there exist further trends in these SPPs with environment? The answer to this question has important implications for the formation processes of ETGs in different environments, as manifested in their SFHs.
We select a sample of 28,954 quiescent early-type galaxies from the SDSS DR7. We map these galaxies and their derived stellar population properties age, [Fe/H], and [Mg/Fe] onto and through the Fundamental Plane. We also divide our galaxy sample into three classifications of environment, derived from the galaxy group catalogues of Yang et al. (2007). After confirming the trends seen in the SPPs with the relevant FP parameters by Graves et al. (2010) in our own sample, we then go on to quantify any differences in the SPPs of our sample with environment at fixed FP position.
In section 2 we describe the data used in this analysis, including sample selection. In section 3 we describe our analysis, including sample classification and stellar population analysis. In section 4 we present our results for variations in the stellar population properties of our quiescent early-type galaxy sample with local group environment at fixed structure. In section 5 we discuss our results in the context of a few late-time evolutionary processes. Finally, section 6 summarizes our conclusions.
2 Data
The sample of galaxies analysed here are taken from the SDSS Data Release 7 (DR7) Main Galaxy Survey (Abazajian et al., 2009). DR7 marks the completion of the survey phase known as SDSS-II.
Basic photometric and spectroscopic galaxy properties, including redshifts and stellar velocity dispersions, are taken from the New York University Value-Added Galaxy Catalog (NYU-VAGC; Blanton et al. (2005a)). Following e.g. Bernardi et al. (2003), velocity dispersions are aperture corrected to 1/8 effective radius using = , where is the circularized radius in arcseconds and is the spectral fiber radius (1.5” for SDSS spectra). deVaucouleurs radii and axis ratios are taken from the SDSS DR7 Catalog Archive Server,222http://cas.sdss.org/dr7/en/ and are converted to physical radii (in kpc). Radii are circularized using = , where and are the deVaucouleurs radius and axis ratio, respectively. H, [Oii]3726 and [Oii]3729 emission line fluxes and continua are taken from the MPA-JHU spectral catalogs.333http://www.mpa-garching.mpg.de/SDSS/DR7/ absolute magnitudes are computed and K-corrected to =0 using the IDL code kcorrect (Blanton & Roweis, 2007).
Galaxy group information (central vs. satellite, group size, group halo mass) is taken from the Yang et al. group catalogs. The SDSS DR7 galaxy group catalogue is similar to the SDSS DR4 group catalogue of Yang et al. (2007). The DR7 group catalogue is constructed by applying the halo-based group finder of Yang et al. (2005) to the NYU-VAGC. From the NYU-VAGC, Yang et al. selected all galaxies in the Main Galaxy Sample with an extinction-corrected apparent magnitude brighter than = 17.72, with redshifts in the range 0.01 0.20 and with a redshift completeness 0.7. Of the three group samples Yang et al. construct from this parent sample, we use Sample II. In addition to the 599,301 galaxies in Sample I with measured -band magnitudes and redshifts from SDSS, Sample II includes 3,269 galaxies with spectroscopic redshifts taken from alternative surveys.
Our sample contains galaxies restricted to a redshift range 0.025 0.1 and a range 70 (km/s) 300 (km/s). Where necessary we assume a standard CDM cosmology with =73 km/s/Mpc, =0.25, and =0.75.
2.1 Quiescent Selection
In the present analysis we study the star formation histories of quiescent early-type galaxies. We construct our quiescent, early-type galaxy sample by making cuts in the spectral emission features and colors of our parent galaxy sample.
Our emission line cuts are based on H and [Oii]3727, which are typically the two strongest optical emission lines in star-forming galaxies. This cut also eliminates contamination from low-ionization nuclear emission-line regions (LINERs), which exhibit high [Oii]/H ratios, and galaxies which exhibit low [Oii]/H ratios, including active galactic nuclei (AGN), transition objects (TOs), and Seyferts (Yan et al., 2006). These cuts largely parallel those made in Peek & Graves (2010).
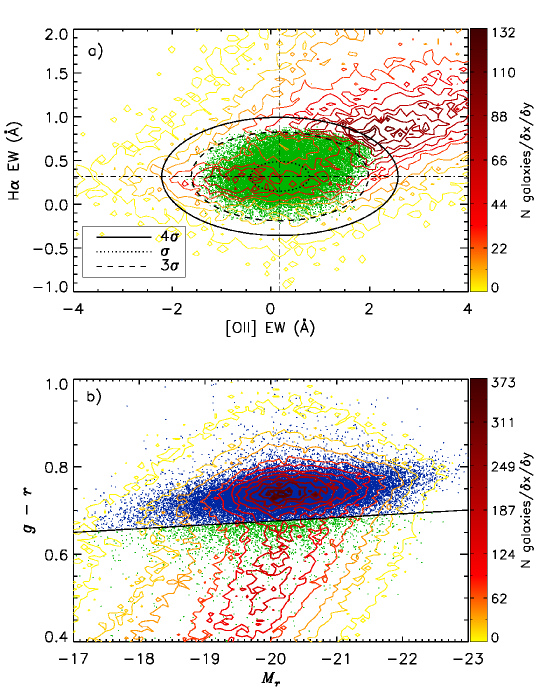
Figure 1 shows the distribution of the full galaxy sample in H and [Oii] equivalent width (EW), zoomed in around the region of galaxies with zero emission. The quiescent galaxies used in the present analysis are those that lie near the peak of the distribution around zero emission in both H and [Oii]. The population of truly quiescent galaxies should be symmetrically distributed around (0,0), with scatter due to measurement errors in the emission line strengths. There may be zero-point offsets in the EW measurements (see, e.g., Yan et al. 2006), and the typical errors in H EW are different from those in [Oii]. With these effects in mind, we determine the EW zero-point values and selection region as follows.
We smooth over the distribution of galaxies in the H-[Oii] EW-space by taking its two-dimensional histogram. We isolate quiescent galaxies in this space by fitting a Gaussian with zero tilt around the distribution peak. This Gaussian fit is centred at (0.184,0.318), which we take to indicate the zero-point of the EW measurements. The Gaussian widths are 0.598 and 0.168 in [Oii] and H EW, respectively. We then make a cut in emission to the galaxy population in EW-space: selected galaxies are those whose measured values 1 lie within the ellipse centred at (0.184,0.318) with width and height equal to 4 times the Gaussian widths of the quiescent distribution.
These selection criteria minimize contamination from galaxies with significant H and [Oii] emission, while still maintaining a large enough sample for later analysis. The galaxies which meet these criteria are shown in green in Figure 1, while the distribution of those which are eliminated from our sample by the EW selection is shown with contour lines. Figure 1 also shows ellipses centred at the Gaussian centre of the quiescent distribution whose semimajor and semiminor axes are 1,3, and 4 times the Gaussian widths of the quiescent distribution. Making our cut is roughly equivalent to making a cut such that galaxies lie within the 3 ellipse with no consideration of their errors in emission.
After this emission cut we make a further cut in color-magnitude space to remove color outliers. This identifies contaminants to our passive sample, e.g., galaxies where the emission line measurements have failed. We first define the red sequence of our full galaxy sample in vs. color-magnitude space (Figure 1) in the following way.
We again take a two dimensional histogram of the galaxy distribution, this time in () vs. space. We then fit a two-dimensional Gaussian function with nonzero tilt to the galaxy distribution centred around the red sequence. We define the centre of the red sequence in color-magnitude space to be along a line connecting the major axes of ellipses that are the level sets of our 2D-Gaussian fit to the red sequence. We then define a line parallel to this red sequence, offset below it by 2 (solid line in Figure 1), where =0.021 is the Gaussian width of the red-sequence distribution along the direction perpendicular to the red sequence line. Galaxies that lie below this solid line are discarded.
Our cut is illustrated in Figure 1, where our parent sample of galaxies is shown in color-magnitude space separated into three subpopulations: the distribution of galaxies which were eliminated by our emission cuts is shown with contour lines; galaxies which passed the emission cuts but not the color cuts are shown in green; galaxies which passed both cuts and define our final quiescent red-sequence sample are shown in blue. A visual inspection of the spectra for objects plotted in green (those with no emission but blue colors) showed that many of them contain significant emission and thus represent errors in the MPA-JHU emission line measurements or mismatches between the catalogs. Our color cuts yield a sample that is not significantly contaminated by objects lying off the red sequence. After all the cuts described above we are left with a sample of 28,954 galaxies.
3 Analysis
3.1 Defining 3D Fundamental Plane Space
In the present analysis we study how the stellar population properties and, thus, the star formation histories of quiescent early-type galaxies relate to their present-day structural properties and local group environments. In order to understand how these SFHs scale with present-day structural properties we study their variation along and ‘through’ the thickness of the Fundamental Plane.
Here we describe our 3D FP binning strategy. We follow the method of Graves et al. (2009b) by dividing galaxies into this space directly using the FP parameters , , and . Although these parameters are not orthogonal, we use them as bases and bin galaxies in this space because we can more directly interpret the structural properties of galaxies in our sample by their locations in this space.
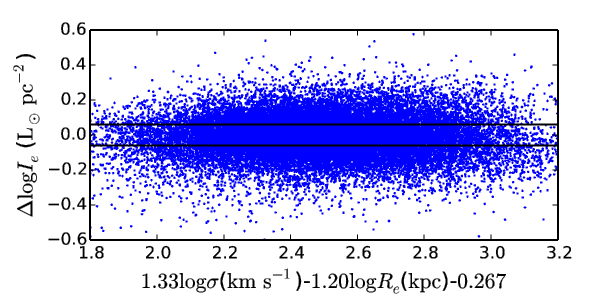
We construct the dimension (thickness) of our FP-space by fitting a plane to the -- relation. This fit uses the routine leastsq in the package scipy.optimize in Python to minimize residuals in the direction. We find the following FP relation from this fit:
| (1) |
where is measured in , is measured in km s-1, and is measured in kpc. The FP residual, , is the difference between the measured and that expected from the FP fit, i.e., - ( - - ). An edge-on view of the FP is shown in Figure 2.
As demonstrated in Graves & Faber (2010), the thickness in of the FP is predominantly the result of variations in the stellar surface mass density . This can be interpreted as a conversion efficiency for turning gas into stars. In order to study variations in the SPPs with , we define three layers through the FP by dividing into three ‘slices’: ‘Low-SB’ ( -0.059), ‘Mid-SB’ (-0.059 0.059), and ‘High-SB’ ( 0.059). The three layers along the dimension, separating galaxies in this space into Low-, Mid-, and High-SB are indicated by black lines in Figure 2.
In each of the three surface brightness slices, we then bin galaxies into a 65 grid in the - projection of the FP (see any panel of Figures 3 through 5). This yields 30 bins of galaxies in the - space, and a total of 90 bins of galaxies in our 3D FP-space defined by the three parameters , , and . This - projection of FP-space also conveys important information about the structures of our galaxy sample. By fixing the position of a galaxy in this projection of FP-space we fix its total mass ( ), and by varying the position of a galaxy along a line of constant we vary its size and concentration.
This FP-space provides a description of a galaxy’s structure along which we can study changes in the SFHs of our galaxy sample in different environments.
3.2 Classifying Local Group Environment
This analysis aims to study the role of local group environment in the star formation histories of early-type galaxies. Here we use ‘local group environment’ to refer to a galaxy’s ‘identity’ within its dark matter halo, i.e., whether it is the central most massive galaxy within a halo hosting other less massive galaxies, a smaller satellite galaxy within the halo of a more massive host galaxy, or the only galaxy in its dark matter halo. This provides an intuitive measure of an individual galaxy’s environment. We ask the question whether, when we fix quiescent ETGs by their locations in FP-space (along the structural parameters shown by Graves et al. (2010) to be well-correlated to their SFHs), their SPPs are seen to vary with their local group environments.
To describe local group environment we classify galaxies into three categories: ‘Brightest Group Galaxies’ (BGGs) are defined as the single most massive galaxies residing in groups containing more than one galaxy;444Note that the classification of BGG is based on , not on . These galaxies are therefore truly the ‘most massive group galaxy’. We use the term BGG in analogy with the more familiar ‘BCG’ for ‘Brightest Cluster Galaxy’. Satellites are defined as those galaxies that are not the most massive in a group containing more than one galaxy (they reside in the dark matter halo of the host galaxy); Isolateds are those galaxies that are the only members of the dark matter haloes in which they reside.555‘Isolated’ galaxies can in theory have satellites that fall below the sample magnitude limit. By defining these three group classifications we further divide our 90 bins in FP-space into a total of 270 bins.
To make these classifications we use the DR7 version of the group catalogue of Yang et al. (2007). The Yang group catalogue is constructed using a halo-based group finder, which establishes groups by assigning individual galaxies to their respective dark matter haloes. The halo-based group finder does this by first making tentative group assignments using the traditional FOF algorithm of Davis et al. (1985), then assigning a tentative mass to each group with an assumption of the group mass-to-light ratio. This mass is then used to estimate the size and velocity dispersion of the host halo, which is then used to redetermine group membership in redshift space. This process is iterated until group membership converges. For a full description of the group finding algorithm and the basic properties of the group catalogue please see the description of the earlier DR4 group catalogue (Yang et al., 2007). We use the DR7 group catalogue rather than the DR4 group catalogue because it gives us a larger sample size.
3.3 Constructing the Stacked Spectra
Our 3D FP-space, divided into BGGs, Isolateds, and Satellites, contains 270 bins of galaxies. For each of these 270 bins, we co-add the spectra of the individual galaxies within the bin to make a very high S/N stacked spectrum. The individual spectra are normalized in the 4000–5500Å wavelength region and combined in an unweighted sum, so that each constituent galaxy contributes equally to the final stack. We mask out regions around strong skylines, and perform pixel-by-pixel -clipping to remove distant outliers. We smooth all the spectra up to a common effective velocity dispersion to match the resolution of the highest- galaxy within each bin. Corresponding error spectra are constructed in parallel. The total S/N varies, depending on the number of galaxies that contribute to each bin. We note that prior to stacking, galaxy spectra are not corrected for Galactic foreground extinction, which is expected to have a negligible effect.666http://www.sdss.org/dr7/products/spectra/index.html After our cuts in emission and in color-magnitude space, we are still left with a small number of galaxies that contain significant emission, whose catalog emission values do not correctly reflect the properties of the spectra. These are a small fraction of the total galaxies. Thus in bins containing many galaxies, the emission lines are effectively excluded by the -clipping algorithm. However, in bins with relatively few galaxies, no pixels are removed by -clipping and the mis-identified objects can contribute substantial emission to the stack. To eliminate these objects, we make iterative manual checks to the stacked stellar spectra for each bin. If any substantial emission is seen in the stacked spectrum, we visually inspect the spectrum of each individual galaxy belonging to that bin, eliminating from our sample those galaxies whose spectra show significant emission that was not reflected in their catalog emission line values. These iterative checks remove 36 galaxies from our sample of 29,000 galaxies.
3.4 Stellar Population Analysis
The stacked spectra for each bin can be used to characterize the stellar population properties that are typical for galaxies in that bin. We use the IDL code EZ_Ages (Graves & Schiavon, 2008), based on the stellar population synthesis models of Schiavon (2007), to measure single burst ages, [Fe/H], and [Mg/Fe] for each stacked spectrum. Briefly, EZ_Ages uses Balmer and Fe absorption lines to fix a fiducial age and [Fe/H] for the spectrum, based on Solar-abundance model grids. It then adjusts the abundance of [Mg/Fe] with respect to this Solar-scale model until the model can consistently fit the Mg b absorption feature as well. The code then iterates to ensure a self-consistent solution. Other absorption lines can be used to fit other elements, but here we restrict ourselves to fitting age, [Fe/H], and [Mg/Fe]. EZ_Ages also provides error estimates for these parameters, based on the formalism of Cardiel et al. (1998), which has been shown to be consistent with the error estimates from Monte Carlo simulations (Graves & Schiavon, 2008). For more details on the modeling process, we refer the reader to Graves & Schiavon (2008). The resulting stellar population measurements give a light-weighted single-burst age, mean [Fe/H], and [Mg/Fe]. Each of these parameters contains information about the star formation histories of the galaxies in question.
The measured stellar population ages are derived from model star formation histories that consist of a single burst of star formation. Single burst models are not realistic representations of galaxy star formation histories, and certainly not for a stack of many galaxies. Thus the single burst ages quoted here are used as statistical descriptions of the ensemble of stars in a galaxy bin in order to make quantitative comparisons between bins, without assuming that the measured ages correspond to a rigorous physical formation time. The reader should bear in mind that the stars in any given galaxy bin likely formed over a range of times. Furthermore, the single-burst ages are not equivalent to mean mass-weighted ages but instead are strongly skewed by young sub-populations (Trager & Somerville, 2009). They thus capture information about whether or not a galaxy has formed a substantial quantity of stars in the recent past. We use the Fe abundance [Fe/H] to quantify the overall normalization of the metal abundance pattern in our stacked galaxies. Again, these are mean quantities over an ensemble of metallicities, although these are much more nearly mass-weighted quantities (Trager & Somerville, 2009). Because the nucleosynthesis of Fe is dominated by Type Ia supernovae (SNe Ia), [Fe/H] measures the quantity of SNe Ia product that has built up during a galaxy’s star forming lifetime through previous generations of stars. Finally, we use [Mg/Fe] to trace the typical duration of star formation in our galaxies. The nucleosynthesis of Mg is dominated by massive stars and Type II supernovae (SNe II), which have shorter lifetimes than the stellar progenitors of SNe Ia. Thus an excess of Mg with respect to Fe is often interpreted to mean that star formation in a galaxy was of short duration, such that the interstellar medium (ISM) had time to enrich in SNe II product (Mg), but not to fully enrich in SNe Ia product (Fe) (see, e.g., Tinsley 1979; Greggio & Renzini 1983; Worthey, Faber & González 1992; Matteucci 1994; Trager et al. 2000a; Thomas et al. 2005; de la Rosa et al. 2011).
4 Results
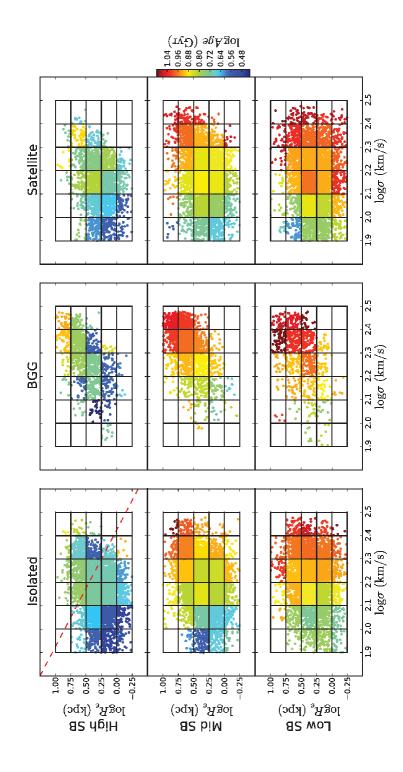
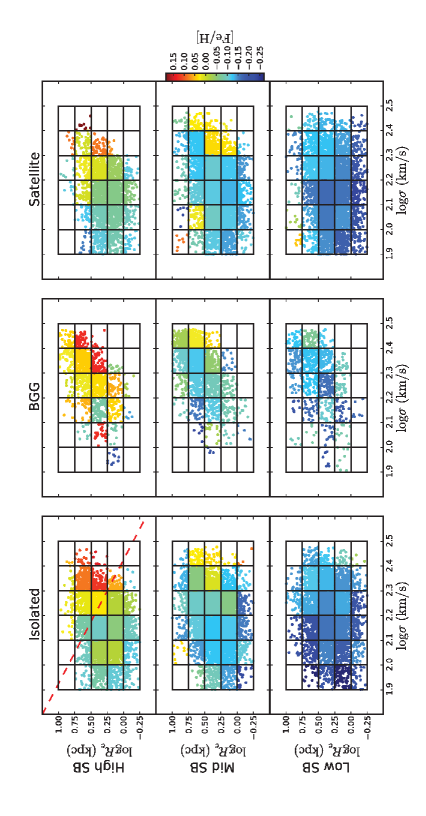
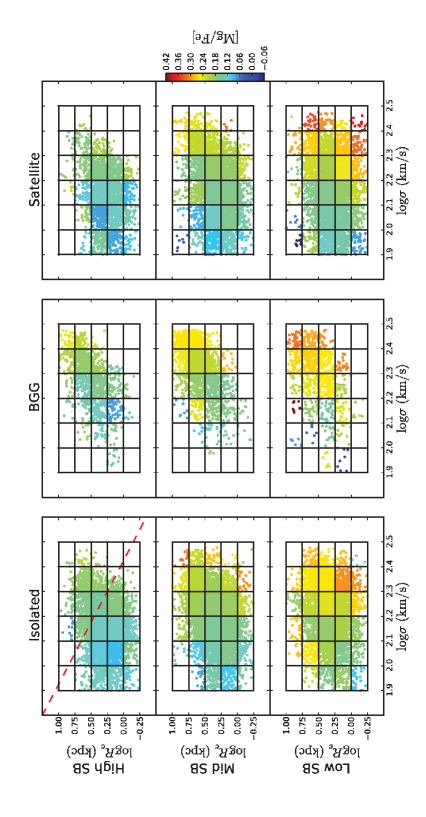
The results of our analysis are shown in Figures 3 through 5. Here we show the final galaxy sample in 3D FP-space, separated into BGGs, Isolateds, and Satellites. Each panel shown in Figures 3 through 5 shows the - projection of FP-space. In each of these figures the top, middle, and bottom rows of panels show galaxies in our High-, Mid-, and Low-SB FP slices, respectively. The left, middle, and right columns show our Isolated, BGG, and Satellite galaxy samples, respectively. The SPPs age, [Fe/H], and [Mg/Fe] for each bin in this space are shown by the color in which a galaxy is plotted, according to the scale shown by the colorbar in each figure. In the top, leftmost panels of Figures 3 through 5, a dashed red line of constant dynamical mass is shown.
Looking first at the distribution of galaxies in the binned space, we notice that BGGs are distributed differently from the Satellite and Isolated populations. In a given surface brightness slice BGGs tend to populate the high-, high- part of FP-space, where we expect to find the most massive galaxies (recall that for a Virialized system). It is no surprise that BGGs tend to be more massive than Satellites; this is built into their definition. That BGGs also tend to be more massive than Isolateds is not directly definitional, and illustrates that more massive haloes tend to host more massive central galaxies.
4.1 Star Formation History vs. Structure and Environment
We confirm all of the previous trends observed in the SPPs of quiescent ETGs with their positions in FP-space (see Graves et al. 2010; Springob et al. 2012). Studying Figures 3 through 5, the following trends are unanimously true for BGGs, Isolateds, and Satellites. Along the direction of increasing , the ages, [Fe/H], and [Mg/Fe] of galaxies in our sample are observed to increase. Along the direction of decreasing , the ages and [Mg/Fe] of galaxies in our sample are observed to increase, while their [Fe/H] are observed to decrease. None of the SPPs explored here (age, [Fe/H], or [Mg/Fe]) are observed to vary substantially with . In agreement with Graves et al. (2010), the stellar population properties of quiescent early-type galaxies are shown to be well mapped to their structures, with the most relevant structural parameters being and .
We now ask the question whether, on top of the known correlations with structural parameters, the SPPs are seen to vary with local group environment. Are the processes which cause the observed correlations environment-dependent?
When comparing the SPPs with environment in Figures 3 through 5, it is apparent that any residual trends with environment are subtle. To zeroth-order, there are no systematic differences in the stellar population properties with environment at fixed structure. This is our central result.
This result is surprising. Because we expect the efficiency of certain formation processes, such as cooling flows, to depend strongly on environment, we might expect the SFHs of ETGs in our sample to vary with local group environment. Our observations therefore imply that formation processes which depend on environment cannot alter the SFHs/structures of galaxies in our sample so significantly as to produce significant variations in the SFH-structure correlation we observe with environment.
On top of our zeroth-order conclusion, however, we do see some very subtle overall differences in the SPPs with environment: considering Figure 3, and comparing fixed bins in FP-space between Isolated, BGG, and Satellite galaxies, it appears that Satellite galaxies are slightly older than BGGs, while both are older than Isolateds. This difference is taken over all the bins, and there remain single outliers to this trend, as we see, for example, comparing the highest , highest , Mid-SB bin of Isolated galaxies with the same bin for BGG and Satellite galaxies. Looking at Figure 4, there seems to be an overall trend such that BGGs are more Fe-rich at fixed position in FP-space than both Satellites and Isolateds. This trend is most clearly seen in the High-SB FP slice. It also seems when considering the High-SB slice in Figure 4 that Isolateds are more Fe-rich than Satellites. However, this trend does not persist through the rest of the FP-space, and in particular, in the Mid-SB slice the trend seems to be the opposite – Satellites appear more Fe-rich than Isolateds. Considering Figure 5, it is difficult to detect any clear trend in the Mg-enhancements of our galaxy sample with local group environment at fixed position in FP-space. Satellite galaxies at the high-, Low-SB bins of FP-space seem to be more Mg-enhanced than both Isolateds and BGGs, but this trend does not persist through the rest of the space and is contradicted at various other positions in FP-space. We note that uncertainties in the SPPs are not shown in Figures 3 through 5, so we cannot make any quantitative judgements regarding subtle differences in the SPPs with environment here. This is done in the next section.
We repeat our main result: that to zeroth-order, the star formation histories of quiescent early-type galaxies are captured by their structures, with the two most relevant structural parameters being and , in the way described by Graves et al. (2010). At fixed structure, any differences in the star formation histories of early-type galaxies with environment are only slight. This has interesting implications for those galaxy formation processes that are expected to depend strongly on environment. Our observations constrain the degree to which such processes can alter the SFHs/structures of early-type galaxies in our sample.
4.2 Quantifying Residual Trends with Local Group Environment
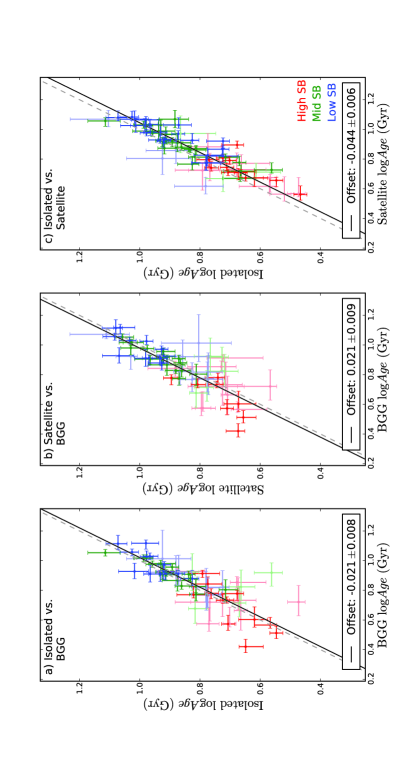
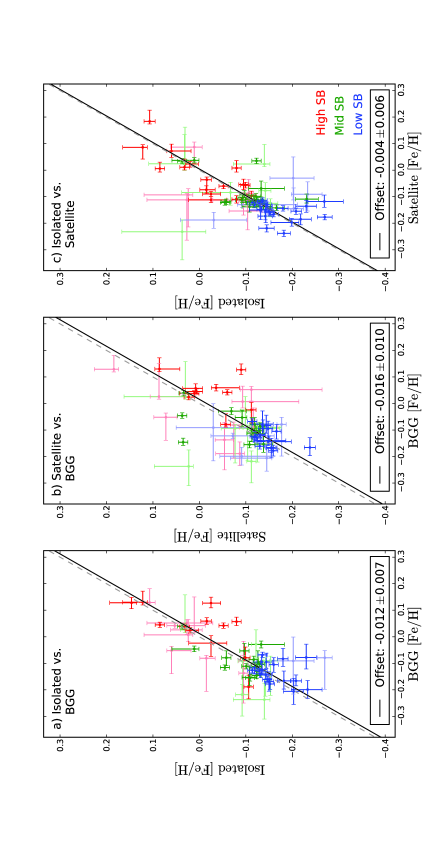
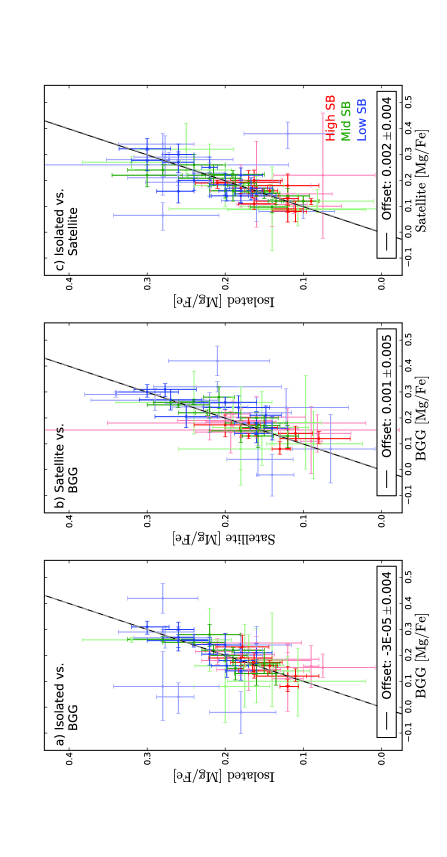
To better quantify the behavior of the SPPs of our quiescent ETG sample with local group environment at fixed position in FP-space, we systematically compare BGG, Isolated, and Satellite galaxy age, [Fe/H], and [Mg/Fe] at each fixed bin of our FP-space. The results are shown in Figures 6 through 8. Each point in the plots shown in Figures 6 through 8 represents an individual bin in FP-space. Points plotted in red, green, and blue represent High-, Mid-, and Low-SB bins, respectively. We also distinguish between high-SN and low-SN bins, defined according to their uncertainties for each SPP, in Figures 6 through 8. High-SN data are shown in dark shades of red, green, and blue while low-SN data are shown in light shades to reduce their visual impact. High-SN age bins are those whose errors in age are less than or equal to 20 their age values, while High-SN [Fe/H] and High-SN [Mg/Fe] bins are those whose errors in [Fe/H] and [Mg/Fe] are less than or equal to 0.05 dex each. This identifies 69, 71, and 57 of our bins as being High-SN in age, [Fe/H], and [Mg/Fe], respectively.
In order to find shifts between the SPPs of galaxies in different environments, we make linear fits to the High-SN data shown in each of the panels of Figures 6 through 8, fitting for the offset of the line with a slope fixed to 1 by minimizing the merit function:
| (2) |
where and are the and standard deviations for the th measurement. The uncertainties in our data shown in Figures 6 through 8 are asymmetric. In computing we make the following simplification: when the function lies above (below) the data point, we use the upper (lower) uncertainty for . When the function lies to the right (left) of the data point, we use the right (left) uncertainty for . Due to limitation of data points we do not distinguish between High-, Mid-, and Low-SB when making our fit. This means that we can only quantitatively make statements about the differences in the SPPs of our galaxy sample with local group environment considering all fixed points in structural FP-space. The linear fit relations we obtain are shown with a black solid line in each of the panels of Figures 6 through 8 with the offset fit values and their errors (computed from the variance, formally derived by consideration of propagation of errors, modified by a factor of the reduced-) shown in the bottom right corners. In each panel we also show a grey dashed line illustrating the one-to-one relation for comparison.
The results for the ages of BGG, Isolated, and Satellite galaxies at fixed structure shown in Figure 6 are the following: BGGs are older than Isolateds by 0.02 dex (Figure 6), Satellites are older than BGGs by 0.02 dex (Figure 6), and Satellites are older than Isolateds by 0.04 dex (Figure 6). Thus, at fixed structure, Isolated galaxies tend to have the youngest stellar populations, while BGGs are typically 5 older, and Satellites are the oldest, typically 10 older than Isolated galaxies with the same structure. These age differences, though small, are statistically significant. They are also the largest variations that we find.
We observe small offsets in [Fe/H] at fixed structure, as shown in Figure 7. BGGs are more Fe-rich than Isolateds by 0.01 dex (Figure 7). BGGs are also more Fe-rich than Satellites by 0.02 dex (Figure 7). [Fe/H] is equal between Satellites and Isolateds at fixed structure (Figure 7). These differences are smaller than the differences that were seen in age in Figure 6.
Finally, we find no difference in Mg-enhancement between BGG, Satellite, and Isolated galaxies at fixed structure (Figure 8).
To summarize: the stellar population properties of quiescent early-type galaxies are well mapped to their structures, with the two most relevant structural parameters being and ; to zeroth-order, the stellar population properties age, [Fe/H], and [Mg/Fe] of early-type galaxies are fully captured by their structures, such that as of a galaxy increases, age, [Fe/H], and [Mg/Fe] all increase, while at fixed as increases, [Fe/H] increases while age and [Mg/Fe] decrease.
There are slight shifts in the stellar population properties of quiescent early-type galaxies with local group environment on top of the zeroth-order trends with structure. These are the following: there are modest shifts in age at fixed structure, such that ageSat ageBGG ageIso. There are very slight shifts in Fe-enrichment at fixed structure, such that [Fe/H]BGG [Fe/H]Sat = [Fe/H]Iso. There are no shifts between the Mg-enhancements of BGG, Isolated, and Satellite galaxies at fixed structure.
4.3 Star Formation History vs. Velocity Dispersion and Environment
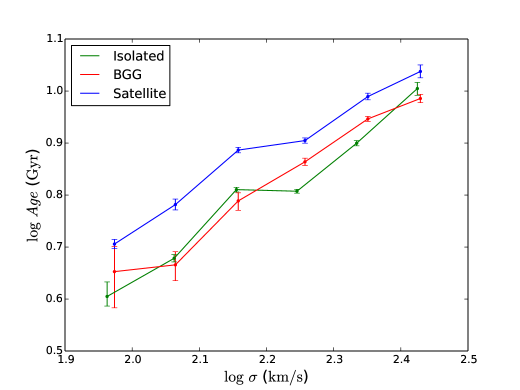
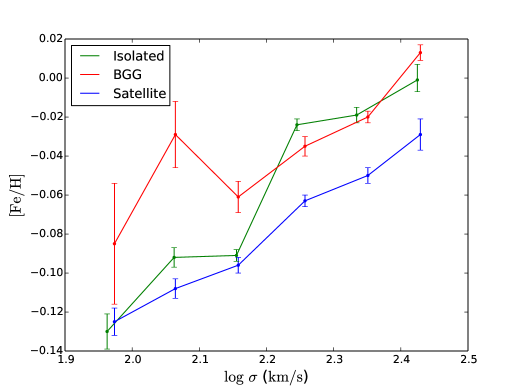
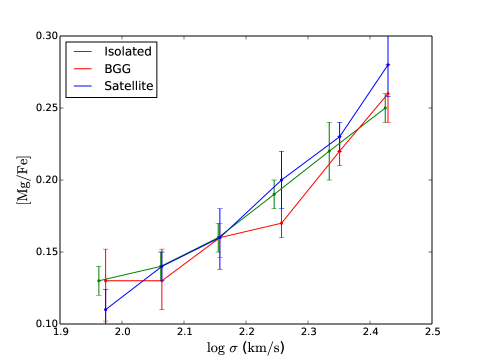
Before we discuss the implications of our results at fixed FP-position, we study variation in the SPPs with local group environment at fixed . This allows us to more clearly place our results at fixed FP-position in the context of previous studies, which have typically studied the SFHs of ETGs at fixed galaxy mass. We measure the ages, [Fe/H], and [Mg/Fe] for the spectra of BGG, Isolated, and Satellite galaxies stacked separately in bins of . Our results are shown in Figures 9 through 11.
At fixed , Satellites are older than BGGs and Isolateds by 0.1 dex (Figure 9). BGGs are more Fe-rich than Satellites at fixed by 0.04 dex (Figure 10). The shifts seen in the SPPs between BGG and Satellite galaxies at fixed FP-position are much stronger at fixed . There are no significant shifts in [Mg/Fe] with environment at fixed FP-position or at fixed (Figure 11).
Comparison of the SPPs of BGGs and Satellites with those of Isolateds in Figures 9 through 11 is ambiguous because trends in the SPPs with galaxy structural parameters are not fully controlled. We can more clearly interpret shifts between the SPPs of BGGs and Satellites at fixed because the definitions of these galaxy subpopulations relative to each other directly indicate how they will distribute differently across the FP at fixed : BGGs, by definition, are more massive and brighter – and so tend to have higher values of – than Satellites at fixed . This implies that at fixed , regardless of any true variation in the SPPs with environment, BGGs tend to be offset to younger ages and higher [Fe/H] than Satellites. This effect is added to true variation in the SPPs with environment. Thus, the age and [Fe/H] shifts between Satellites and BGGs is stronger at fixed than it is at fixed FP-position – in FP-space we control all these important structural parameters at once and study differences in SFH with environment that are independent of structure.
5 Discussion
The central result of our analysis is that, to zeroth-order, the star formation histories of quiescent early-type galaxies are observed to be fully captured by their structures. The observed strong correlation between SFH and structure has strong implications for the evolution of quiescent ETGs after their initial formation and main star-forming lifetimes. In interpreting our results, we note that our sample consists of relatively old galaxies that were possibly quenched long ago, which may make environmental effects on the SFHs difficult to identify, in addition to their intrinsic subtleness. In considering slight differences in the SFHs with environment one should also be careful to note that we have not matched the halo mass distributions between BGGs, Satellites, and Isolateds within each bin in FP-space. This is most important when considering BGG and Satellite galaxies, which according to their definitions cover different ranges of halo masses at fixed galaxy mass.
In the following discussion, we use the term ‘late-time processes’ to describe those evolutionary processes which a galaxy undergoes after its initial formation and main star-forming lifetime. For quiescent ETGs, late-time processes may include the quenching of star formation and processes such as dry merging which occur after quenching. ‘Early-time’ processes are those which precede SF quenching.
The observed SFH-structure correlation can result from two possible scenarios. Either (1) SFH and structure of a galaxy are both built in at early times, and are not changed very much by late-time evolutionary processes, or (2) late-time evolution can significantly change both the SFHs and structures of quiescent ETGs, but this happens conspiratorially in a way that preserves the observed SFH-structure correlation.
The possibility that the latter of these scenarios occurs seems unlikely; in particular, because we do not see strong variations in SFH with environment, this scenario would require all late-time environmental processes to follow this same ‘conspiracy’. On the other hand, the first scenario is a plausible explanation of our observations. Our results therefore substantially constrain the effects that late-time evolutionary processes can have on the structures and SFHs of quiescent ETGs. In the following sections, we discuss the implications of this conclusion for a number of evolutionary processes.
5.1 Quenching of Infalling Satellites
Graves et al. (2010) suggested that satellite quenching might drive the trends they observed in the SPPs of quiescent ETGs with . Satellite quenching describes processes by which satellites that fall into their host haloes are stripped of cold gas out of which to form stars (e.g. Gunn & Gott 1972; Lea & De Young 1976; Gisler 1976). Satellite quenching has been suggested as an important mechanism causing the observed dependence of galaxy star formation rate (SFR) and color on small scale environment ( 1 Mpc), in which the fraction of red galaxies with low SFR increases with local density of environment (e.g. Wilman, Zibetti & Budavári 2010; Tinker, Wetzel & Conroy 2011). Pasquali et al. (2010) considered the quenching of star formation of satellite galaxies by strangulation as they fall into their host haloes to explain the shift they observed of satellites to older ages than centrals at fixed in their SDSS galaxy sample.
If the quenching of infalling satellites were the dominant mechanism driving the trends, this would imply that Low- galaxies tend to be satellite galaxies in the dark matter haloes of larger host galaxies. It further implies that satellites offset to lowest are those which fell into their host haloes at the earliest times (Graves et al., 2010). The data presented here can rule out the quenching of infalling satellites as a main mechanism driving the observed trends with . Considering the bottom panels of Figure 3, it is clear that the Low- galaxies include BGG, Isolated, and Satellite galaxies in similar proportion to what is observed for High- and Mid- galaxies. Thus, the Low- population is not especially dominated by Satellites.
Although satellite quenching is not the main mechanism driving the observed trends in the SPPs with , our results are still consistent with the presence of some quenching of infalling satellites. In particular, our observed slight shifts in the ages of Satellites above BGGs and Isolateds at fixed structure might be due in part to the quenching of these Satellites as they fall into their host haloes.
If the quenching of infalling Satellites is indeed the mechanism causing the observed age offset, then we might expect Satellites to also be offset to lower [Fe/H] and higher [Mg/Fe] than Isolated galaxies, consistent with a mechanism that truncates the star formation of Satellite galaxies more efficiently than that of Isolated galaxies. We do not, however, observe either of these shifts. In fact, we observe that [Fe/H]Sat = [Fe/H]Iso, and that [Mg/Fe]Sat = [Mg/Fe]Iso.
This indicates that if satellite quenching is the mechanism causing the shift of Satellites to older ages than Isolateds and BGGs, this must only be a weak and late effect that takes place after a Satellite galaxy has been forming Fe-peak elements for a significant period of time. This is also consistent with satellite quenching which occurs over a long time period, rather than abruptly. This is indeed suggested by the results of Wetzel et al. (2013), who, using galaxy group/cluster catalogs from the SDSS DR7 together with a cosmological N-body simulation, find that there is a long time delay (2–4 Gyr) in which, after a satellite galaxy falls into its host dark matter halo, satellite SFRs evolve unaffected before an ensuing period of rapid quenching with a characteristic time-scale 0.8 Gyr.
The presence of slow, weak satellite quenching in our sample is thus consistent with the observed trends in age, [Fe/H], and [Mg/Fe] with local group environment. That satellite quenching can have only a subtle effect on galaxies in our sample, in a way consistent with the zeroth-order preservation of their SFHs/structures, implies that the mechanisms responsible for quenching Satellites after they fall into their host dark matter haloes cannot significantly alter the structures of Satellite galaxies. This is supported by the results of van den Bosch et al. (2008), who, using a large galaxy group catalog constructed from SDSS, suggest that ‘strangulation’ (Larson, Tinsley & Caldwell 1980; Balogh, Navarro & Morris 2000) is the main mechanism turning satellite galaxies red, dominating over mechanisms which operate only in very massive haloes, such as ‘ram-pressure stripping’ (e.g. Gunn & Gott 1972; Quilis, Moore & Bower 2000; Hester 2006) and ‘harrasment’ (Farouki & Shapiro 1981; Moore et al. 1996), the latter of which can have a significant impact on galaxy morphology.
5.2 Cooling Flows
The efficiency of cooling flows in our sample might be expected to differ with local group environment, and could impact the observed SFHs. Cooling flows significantly affect only the galaxy at the bottom of the gravitational potential well of its halo, and so should only be relevant for BGG and Isolated galaxies.
Late-time star formation has commonly been observed in ‘cooling core’ BCGs with low central gas entropies, identified by their X-ray luminosities and excess IR and UV emission (e.g. Egami et al. 2006; Donahue et al. 2007; Quillen et al. 2008; O’dea et al. 2008; Wang et al. 2010; Hoffer et al. 2012). In analogy to the BCGs in clusters, we might expect to see subtle shifts in BGGs to younger ages than Isolateds, as a result of more efficient gas cooling flows powering residual late-time star formation for central BGG galaxies. This is consistent with observations which find galaxy clusters with the most massive cooling flows to have significantly closer nearest neighbors than the typical cluster (Loken, Melott & Miller 1999). This could be driven by a positive correlation between cluster nearest-neighbor overdensity and central gas density (Miller et al., 1999). By definition, BGGs should reside in regions of higher nearest-neighbor overdensity than Isolateds and have higher central gas density than Isolateds, and could therefore have more efficient cooling flows. We note that we have eliminated ongoing star formation from our sample, but this only eliminates continuous residual late-time star formation, and any residual star-formation that shut down recently will still affect our results.
We do not, however, observe BGGs to be offset to younger ages at fixed structure than Isolateds and, in fact, the slight shift we do see is an offset of BGGs to slightly older ages than Isolateds at fixed structure. Not only do we not see evidence for significant late-time residual star formation from more efficient cooling flows for BGGs in our sample, but the slight shift is in the opposite direction from what one might expect if this were the case. We conclude that cooling flows do not have a major impact on the integrated SFHs of BGGs in our sample.
5.3 Quenching in Massive Haloes
The observed small offset of BGGs to slightly older ages than Isolateds could be due to more efficient late-time residual star formation for Isolateds. In this case, a possible mechanism causing this could be quenching by massive haloes. This occurs when the dark matter halo of a galaxy passes a critical mass threshold and accreting gas is shock heated upon infall, no longer cooling efficiently (e.g. Birnboim & Dekel 2003; Kereš et al. 2005; Cattaneo et al. 2008). The interaction of the accreting gas with the rapidly expanding shock has been shown to be enough for long-term quenching in haloes of 1012 to 10 (Birnboim, Dekel & Neistein 2007). It has also been shown that long-term quenching in massive ( 71012M⊙) haloes can result if shock heating is supplemented by continued cosmological gas accretion which delivers gravitational energy to the inner halo hot gas (Dekel & Birnboim, 2008).
At fixed structure of the central galaxy, we expect BGGs to reside in more massive dark matter haloes than Isolateds because they are defined as having a larger total group mass. It is possible that gas accretion onto Isolateds is more efficient, while shock heating slows or quenches star formation for BGGs in more massive haloes. This could cause our observed slight shift of BGGs to older ages than Isolateds at fixed structure. We note that this mechanism is thought only to be effective when the dark matter halo of a galaxy passes beyond a critical mass threshold . In order to test this further, it would be interesting in later similar analyses to systematically determine how the SPPs of quiescent ETGs scale with local group environment at fixed structure, distinguishing by galaxy halo mass.
Besides a slight age shift, we also see a very slight shift of BGGs to higher [Fe/H] than Isolateds and Satellites. In a way that is consistent with the critical halo mass quenching arguments above, the observed shift in [Fe/H] of BGGs can also be explained by their larger mass haloes at fixed structure. If, at fixed structure, BGGs have more massive haloes than Isolateds, the [Fe/H] offset of BGGs could result from BGGs being slightly less susceptible to SN feedback, retaining a larger fraction of their metals in the deeper gravitational potential wells in which they reside.
The effects of differences in the halo masses of BGGs and Isolateds on their SFHs and structures cannot be large, as implied by the only slight shifts seen in the SFHs of galaxies in our sample with environment, in a way that is consistent with the zeroth-order preservation of structure and SFH.
5.4 Dry Merging
We would expect the rate of dissipationless (‘dry’) merging in our galaxy sample to depend on environment. In particular, we might expect the rate of dry minor merging to be greater for BGGs. This is consistent with the results of Bernardi (2009) who suggests that more dry minor merging in the formation histories of BCGs (analogous to our BGGs) causes their steeper - relation over other ETGs in the SDSS, MaxBCG (Koester et al., 2007), and C4 (Miller et al., 2005) catalogues. Ruszkowski & Springel (2009), performing high-resolution cosmological simulations, also find BCGs to evolve away from the Kormendy relation for smaller mass galaxies and to show increased dark matter-to-stellar mass ratios, due to a larger number of dry mergers in their formation histories. Because dry merger rates in our sample are expected to vary with environment, our observation of the zeroth-order preservation of SFH-structure constrains the degree to which dry merging can alter galaxy structure without ‘equally’ altering the SPPs.
Naab, Johansson & Ostriker (2009) and Bezanson et al. (2009) present simple scaling arguments to discuss the effects of dry mergers on ETG structure. These scaling arguments have agreed reasonably well with the results of simulations (e.g. Oser et al. 2012; Boylan-Kolchin, Ma & Quataert 2006). Using the virial theorem, and assuming energy conservation between the compact initial stellar system and the final system after accretion of additional stellar systems, Naab et al. (2009) derives the following relation between the final and initial mean square speeds of stars:
| (3) |
and a similar relation between the final and initial gravitational radii:
| (4) |
where is the ratio of the total mass of accreted systems to the initial mass ( = ), and is the ratio of the average of the mean square speeds of accreted systems and the initial mean square speed ( = ).
These scaling arguments predict that the remnant in a dry major merger doubles for a factor-of-2 increase in mass while its is left unchanged. Referring to Equation 1, if dry major mergers increase linearly with mass, then they would leave the structural parameters relevant to the SFHs of galaxies in our sample relatively unchanged. Because they also occur between galaxies of similar structure (and SFH), dry major mergers are consistent with our observation of the zeroth-order preservation of SFH-structure.
The Naab et al. (2009) and Bezanson et al. (2009) scaling arguments predict that for a factor-of-2 increase in mass due to dry minor merging, increases by a factor of 4 and decreases by a factor of . Again referring to Equation 1, we find that, according to these scaling arguments, enough dry minor merging can significantly alter the relevant structural parameters of galaxies in our sample (decreasing their and shifting them to lower ). Because we expect dry minor mergers to leave the SPPs of the most massive progenitor relatively unchanged, a large amount of dry minor merging would ‘wash out’ the observed SFH-structure correlations, in disagreement with the data. This constrains the rates of dry minor mergers in our sample and the degree to which they can alter galaxy structure.
Limitations on dry minor merger rates and structural effects provided by our observations could possibly conflict with studies which favor dry minor merging as a mechanism to explain the observed size growth (up to a factor of 5 since a redshift of 2) of elliptical galaxies (e.g. Bezanson et al. 2009; Hopkins et al. 2010; Oser et al. 2010, 2012; van Dokkum et al. 2010; Trujillo, Ferreras & de la Rosa 2011; Hilz et al. 2012; Hilz, Naab & Ostriker 2013; Bernardi 2009; van der Wel et al. 2009; Naab et al. 2009; Oogi & Habe 2013; Laporte et al. 2013). Indeed, as our observations might suggest, recent studies have found that the observed size growth of ETGs cannot be fully attributed to dry minor mergers (Nipoti, Treu & Bolton 2009a; Nipoti et al. 2009b, 2012; Cimatti, Nipoti & Cassata 2012). Nipoti et al. (2009b), using N-body simulations, found dry major and minor mergers together to increase the half-light radii and velocity dispersions of ETGs with as and . Based on their simulations, the authors determined that if high-redshift ETGs are indeed as dense as estimated, they cannot have evolved into present-day ETGs via dry merging alone. In particular, the authors found that present-day ETGs cannot have assembled more than 45 of their stellar mass via dry mergers, and even this upper limit requires extreme fine tuning (see also Nipoti et al. 2009a, 2012).
We note that on average the SDSS fiber only samples the inner 0.78 of galaxies in our sample, and only samples 0.5 for 20 of our sample. Dry minor mergers are expected to accrete material at large radii in a galaxy, forming extended stellar envelopes of low-density material (e.g. Naab et al. 2007, 2009; Oser et al. 2010, 2012; Farouki, Shapiro & Duncan 1983; Villumsen 1983), but may have a minimal effect on the central regions of a galaxy (e.g. Naab et al. 2007; Bezanson et al. 2009; Hopkins et al. 2009). In particular, Hopkins et al. (2009) found that although the effective stellar mass surface densities within () of local massive ellipticals (10) is much smaller than those of their high-redshift counterparts, the physical stellar surface densities at the observed radii 1–5 kpc are comparable between low- and high-redshift massive ellipticals. Evidence was found for a picture in which the entire population of high-redshift red galaxies are the progenitors of the high-density cores of present-day massive ellipticals, whose growth is primarily through dissipationless minor mergers. Bezanson et al. (2009) found similar results. Thus, although it does not entirely lift any constraint our observations have on the rates and effects of dry minor merging allowed for in our sample (in particular, the full is sampled by the SDSS aperture for 50 of galaxies in our sample), any attempt to place a limit on the effects of dry minor merging in our sample must consider the effect of finite SDSS aperture size.
It would be interesting in future studies to perform numerical simulations to quantify the amount of dry merging allowed in our galaxy sample before the SFH-structure correlation we observe is obscured, taking into account the effect of finite SDSS aperture size. Such a study could help place quantitative constraints on structural evolution of ETGs due to dry merging and the contribution of dry merging to the observed size growth of ETGs.
6 Conclusion
In this analysis we used very high S/N, stacked spectra of 29,000 SDSS quiescent early-type galaxies to study variations in the stellar population properties age, [Fe/H], and [Mg/Fe] with local group environment (BGG, Isolated, and Satellite) at fixed position along and through the Fundamental Plane. By fixing galaxies along the Fundamental Plane parameters and which were previously shown to be well-correlated to the star formation histories of early-type galaxies (Graves et al. 2010; Springob et al. 2012), we were able to study variations in the stellar population properties of early-type galaxies due solely to environment.
We find the following results for the stellar populations of quiescent early-type galaxies:
- 1.
-
2.
Our central result is that, to zeroth-order, the star formation histories of our early-type galaxy sample are fully captured by the structural parameters and , and any differences in the star formation histories with environment at fixed structure are only slight. The SFH-structure correlation we observe constrains the degree to which late-time evolutionary processes can alter the SFHs/structures of early-type galaxies in our sample.
-
3.
On top of the zeroth-order SFH-structure correlation, there are slight variations in the SFHs of early-type galaxies in our sample with environment: Isolated galaxies have the youngest ages, while BGGs are 0.02 dex older, and Satellites have the oldest stellar populations, 0.04 dex older than Isolateds. BGGs are found to have the highest Fe-enrichments, 0.01 dex higher than Isolateds and 0.02 dex higher than Satellites. Satellites and Isolateds have equal Fe-enrichments. There are no differences in Mg-enhancement between BGG, Isolated, and Satellite galaxies.
Quiescent early-type galaxies in our sample obey a SFH-structure correlation that is determined early-on and preserved throughout late-time evolution. On top of this correlation there are only slight trends in SFH with environment. Although satellite quenching is found not to be the main mechanism causing the truncation sequence observed along the dimension of FP-space, as proposed by Graves et al. (2010), our observation that Satellites are slightly offset to older ages than BGGs and Isolateds is consistent with a weak, slow satellite quenching process. Although we do not see any slight offset of BGGs to younger ages than Isolateds, as one might expect from cooling flows, this could be due to quenching in the more massive haloes in which BGGs reside. The strong SFH-structure correlation we observe may well be inconsistent with a large amount of dry minor merging in our sample. Future numerical simulations are needed to place quantitative constraints on the degree to which dry minor merging can affect our galaxy sample.
Acknowledgements
The authors would like to thank Anthony Paredes, Garrett Keating, Mariska Kriek, and Dan Kasen for valuable discussions. The authors would also like to thank Charlie Conroy and an anonymous referee for helpful suggestions. G. G. acknowledges support from the Miller Institute for Basic Research in Science during the duration of this project.
Funding for the creation and distribution of the SDSS Archive has been provided by the Alfred P. Sloan Foundation, the Participating Institutions, the National Aeronautics and Space Administration, the National Science Foundation, the US Department of Energy, the Japanese Monbukagakusho, and the Max-Planck Society. The SDSS Web site is http://www.sdss.org/.
The SDSS is managed by the Astrophysical Research Consortium (ARC) for the Participating Institutions. The Participating Institutions are the University of Chicago, Fermilab, the Institute for Advanced Study, the Japan Participation Group, the Johns Hopkins University, the Korean Scientist Group, Los Alamos National Laboratory, the Max-Planck-Institute for Astronomy (MPIA), the Max-Planck-Institute for Astrophysics (MPA), New Mexico State University, University of Pittsburgh, University of Portsmouth, Princeton University, the United States Naval Observatory, and the University of Washington.
References
- Abazajian et al. (2009) Abazajian K.N. et al., 2009, ApJS, 182, 543
- Balogh et al. (2000) Balogh M.L., Navarro J.F., Morris S.L., 2000, ApJ, 540, 113
- Balogh et al. (2004a) Balogh M. et al., 2004, MNRAS, 348, 1355
- Balogh et al. (2004b) Balogh M.L., Baldry I.K., Nichol R., Miller C., Bower R., Glazebrook K., 2004, ApJ, 615, L101
- Beisbart & Kerscher (2000) Beisbart C., Kerscher M., 2000, ApJ, 545, 6
- Bezanson et al. (2009) Bezanson R., van Dokkum P.G., Tal T., Marchesini D., Kriek M., Franx M., Coppi P., 2009, ApJ, 697, 1290
- Bernardi et al. (1998) Bernardi M., Renzini A., da Costa L.N., Wegner G., Alonso M.V., Pellegrini P.S., Rité C., Willmer C.N.A., 1998, ApJ, 508, L43
- Bernardi et al. (2003) Bernardi M. et al., 2003, AJ, 125, 1817
- Bernardi et al. (2006) Bernardi M., Nichol R.C., Sheth R.K., Miller C.J., Brinkmann J., 2006, AJ, 131, 1288
- Bernardi (2009) Bernardi M., 2009, MNRAS, 395, 1491
- Birnboim & Dekel (2003) Birnboim Y., Dekel A., 2003, MNRAS, 345, 349
- Birnboim et al. (2007) Birnboim Y., Dekel A., Neistein E., 2007, MNRAS, 380, 339
- Blanton et al. (2005a) Blanton M.R. et al., 2005, AJ, 129, 2562
- Blanton et al. (2005b) Blanton M.R., Eisenstein D., Hogg D.W., Schlegel D.J., Brinkmann J., 2005, ApJ, 629, 143
- Blanton & Roweis (2007) Blanton M.R., Roweis, S., 2007, AJ, 133, 734
- Boylan-Kolchin et al. (2006) Boylan-Kolchin M., Ma C.-P., Quataert E., 2006, MNRAS, 369, 1081
- Caldwell et al. (2003) Caldwell N., Rose J.A., Concannon K.D., 2003, AJ, 125, 2891
- Cardiel et al. (1998) Cardiel N., Gorgas J., Cenarro J., González J.J., 1998, A&AS, 127, 597
- Cattaneo et al. (2008) Cattaneo A., Dekel A., Faber S.M., Guiderdoni B., 2008, MNRAS, 389, 567
- Cimatti et al. (2012) Cimatti A., Nipoti C., Cassata P., 2012, MNRAS, 422, L62
- Cooper et al. (2008) Cooper M.C., Tremonti C.A., Newman J.A., Zabludoff A.I., 2008, MNRAS, 390, 245
- Cooper et al. (2010) Cooper M.C., Gallazzi A., Newman J.A., Yan R., 2010, MNRAS, 402, 1942
- Cooper et al. (2012) Cooper M.C. et al., 2012, MNRAS, 419, 3018
- Croton et al. (2005) Croton D.J. et al., 2005, MNRAS, 356, 1155
- Croom et al. (2005) Croom S.M. et al., 2005, MNRAS, 356, 415
- Davis et al. (1985) Davis M., Efstathiou G., Frenk C.S., White S.D.M., 1985, ApJ, 292, 371
- de la Rosa et al. (2011) de la Rosa I.G., La Barbera F., Ferreras I., de Carvalho R. R. 2011, MNRAS, 418, 74
- Dekel & Birnboim (2008) Dekel A., Birnboim Y., 2008, MNRAS, 383, 119
- Djorgovski & Davis (1987) Djorgovski S., Davis M., 1987, ApJ, 313, 59
- Donahue et al. (2007) Donahue M. et al., 2007, ApJ, 670, 231
- Dressler (1980) Dressler A., 1980, ApJ, 236, 351
- Dressler et al. (1987) Dressler A., Lynden-Bell D., Burstein D., Davies R.L., Faber S.M., Terlevich R., Wegner G., 1987, ApJ, 313, 42
- Egami et al. (2006) Egami E. et al., 2006, ApJ, 647, 922
- Farouki & Shapiro (1981) Farouki R., Shapiro S.L., 1981, ApJ, 243, 32
- Farouki et al. (1983) Farouki R.T., Shapiro S.L., Duncan M.J., 1983, ApJ, 265, 597
- Gallazzi et al. (2006) Gallazzi A., Charlot S., Brinchmann J., White S.D.M., 2006, MNRAS, 370, 1106
- Gisler (1976) Gisler G.R., 1976, A&A, 51, 137
- Gómez et al. (2003) Gómez P.L. et al., 2003, ApJ, 584, 210
- Goto et al. (2003) Goto T., Yamauchi C., Fujita Y., Okamura S., Sekiguchi M., Smail I., Bernardi M., Gomez P.L., 2003, MNRAS, 346, 601
- Graves & Schiavon (2008) Graves G.J., Schiavon R.P., 2008, ApJS, 177, 446
- Graves et al. (2009a) Graves G.J., Faber S.M., Schiavon R.P., 2009a, ApJ, 693, 486
- Graves et al. (2009b) Graves G.J., Faber S.M., Schiavon R.P., 2009b, ApJ, 698, 1590
- Graves & Faber (2010) Graves G.J., Faber S.M., 2010, ApJ, 717, 803
- Graves et al. (2010) Graves G.J., Faber S.M., Schiavon R.P., 2010, ApJ, 721, 278
- Greggio & Renzini (1983) Greggio L., Renzini A., 1983, Memorie della Società Astronomica Italiana, 54, 311
- Gunn & Gott (1972) Gunn J.E., Gott J.R., 1972, ApJ, 176, 1
- Harrison et al. (2011) Harrison C.D., Colless M., Kuntschner H., Couch W.J., de Propris R., Pracy M.B., 2011, MNRAS, 413, 1036
- Heavens et al. (2004) Heavens A., Panter B., Jimenez R., Dunlop J., 2004, Nat, 428, 625
- Hester (2006) Hester J.A., 2006, ApJ, 647, 910
- Henry & Worthey (1999) Henry R.B.C., Worthey G., 1999, PASP, 111, 919
- Hilz et al. (2012) Hilz M., Naab T., Ostriker J.P., Thomas J., Burkert A., Jesseit R., 2012, MNRAS, 425, 3119
- Hilz et al. (2013) Hilz M., Naab T., Ostriker J.P., 2013, MNRAS, 429, 2924
- Hoffer et al. (2012) Hoffer A., Donahue M., Hicks A., Barthelemy R.S., 2012, ApJS, 199, 23
- Hogg et al. (2003) Hogg D.W. et al., 2003, ApJ, 585, L5
- Hopkins et al. (2009) Hopkins P.F., Bundy K., Murray N., Quataert E., Lauer T.R., Ma C.-P., 2009, MNRAS, 398, 898
- Hopkins et al. (2010) Hopkins P.F., Bundy K., Hernquist L., Wuyts S., Cox T.J., 2010, MNRAS, 401, 1099
- Hoyle et al. (2005) Hoyle F., Rojas R.R., Vogeley M.S., Brinkmann J., 2005, ApJ, 620, 618
- Jimenez et al. (2007) Jimenez R., Bernardi M., Haiman Z., Panter B., Heavens A.F., 2007, ApJ, 669, 947
- Jørgensen et al. (1996) Jørgensen I., Franx M., Kjærgaard P., 1996, MNRAS, 280, 167
- Juneau et al. (2005) Juneau S. et al., 2005, ApJ, 619, L135
- Kereš et al. (2005) Kereš D., Katz N., Weinberg D.H., Davé R., 2005, MNRAS, 363, 2
- Khochfar & Silk (2006) Khochfar S., Silk J., 2006, ApJ, 648, L21
- Kodama et al. (2004) Kodama T. et al., 2004, MNRAS, 350, 1005
- Koester et al. (2007) Koester B.P. et al., 2007, ApJ, 660, 239
- Koleva et al. (2011) Koleva M., Prugniel P., de Rijcke S., Zeilinger W.W., 2011, MNRAS, 417, 1643
- Laporte et al. (2013) Laporte C.F.P., White S.D.M., Naab T., Gao L., 2013, arXiv:1301.5319
- Larson et al. (1980) Larson R.B., Tinsley B.M., Caldwell C.N., 1980, ApJ, 237, 692
- Lea & De Young (1976) Lea S.M., De Young D.S., 1976, ApJ, 210, 647
- Lewis et al. (2002) Lewis I. et al., 2002, MNRAS, 334, 673
- Li et al. (2006) Li C., Kauffmann G., Wang L., White S.D.M., Heckman T.M., Jing Y.P., 2006, MNRAS, 373, 457
- Loken et al. (1999) Loken C., Melott A.L., Miller C.J., 1999, ApJ, 520, L5
- Matteucci (1994) Matteucci F., 1994, A&A, 288, 57
- Miller et al. (1999) Miller C.J., Melott A.L., Gorman P., 1999, ApJ, 526, L61
- Miller et al. (2005) Miller C.J. et al., 2005, AJ, 130, 968
- Mo et al. (2004) Mo H.J., Yang X., van den Bosch F.C., Jing Y.P., 2004, MNRAS, 349, 205
- Moore et al. (1996) Moore B., Katz N., Lake G., Dressler A., Oemler A., 1996, Nat, 379, 613
- Naab et al. (2007) Naab T., Johansson P.H., Ostriker J.P., Efstathiou G., 2007, ApJ, 658, 710
- Naab et al. (2009) Naab T., Johansson P.H., Ostriker J.P., 2009, ApJ, 699, L178
- Naab & Ostriker (2009) Naab T., Ostriker J.P., 2009, ApJ, 690, 1452
- Nelan et al. (2005) Nelan J.E., Smith R.J., Hudson M.J., Wegner G.A., Lucey J.R., Moore S.A.W., Quinney S.J., Suntzeff N.B., 2005, ApJ, 632, 137
- Nipoti et al. (2009a) Nipoti C., Treu T., Bolton A.S., 2009a, ApJ, 703, 1531
- Nipoti et al. (2009b) Nipoti C., Treu T., Auger M.W., Bolton A.S., 2009b, ApJ, 706, L86
- Nipoti et al. (2012) Nipoti C., Treu T., Leauthaud A., Bundy K., Newman A.B., Auger M.W., 2012, MNRAS, 422, 1714
- O’dea et al. (2008) O’dea C.P. et al., 2008, ApJ, 681, 1035
- Oogi & Habe (2013) Oogi T., Habe A., 2013, MNRAS, 428, 641
- Oser et al. (2010) Oser L., Ostriker J.P., Naab T., Johansson P.H., Burkert A., 2010, ApJ, 725, 2312
- Oser et al. (2012) Oser L., Naab T., Ostriker J.P., Johansson P.H., 2012, ApJ, 744, 63
- Pasquali et al. (2010) Pasquali A., Gallazzi A., Fontanot F., van den Bosch F.C., De Lucia G., Mo H.J., Yang X., 2010, MNRAS, 407, 937
- Peek & Graves (2010) Peek J.E.G., Graves G.J., 2010, ApJ, 719, 415
- Poggianti et al. (2001) Poggianti B.M. et al., 2001, ApJ, 563, 118
- Proctor et al. (2004) Proctor R.N., Forbes D.A., Hau G.K.T., Beasley M.A., De Silva G.M., Contreras R., Terlevich A.I., 2004, MNRAS, 349, 1381
- Quilis et al. (2000) Quilis V., Moore B., Bower R., 2000, Sci, 288, 1617
- Quillen et al. (2008) Quillen A.C. et al., 2008, ApJS, 176, 39
- Rettura et al. (2011) Rettura A. et al., 2011, ApJ, 732, 94
- Rogers et al. (2010) Rogers B., Ferreras I., Pasquali A., Bernardi M., Lahav O., Kaviraj S., 2010, MNRAS, 405, 329
- Ruszkowski & Springel (2009) Ruszkowski M., Springel V., 2009, ApJ, 696, 1094
- Sánchez-Blázquez et al. (2006) Sánchez-Blázquez P., Gorgas J., Cardiel N., González J.J., 2006, A& A, 457, 787
- Schiavon (2007) Schiavon R.P., 2007, ApJS, 171, 146
- Sheth & Tormen (2004) Sheth R.K., Tormen G., 2004, MNRAS, 350, 1385
- Skibba et al. (2006) Skibba R., Sheth R.K., Connolly A.J., Scranton R., 2006, MNRAS, 369, 68
- Skibba et al. (2009) Skibba R.A. et al., 2009, MNRAS, 399, 966
- Smith et al. (2007) Smith R.J., Lucey J.R., Hudson M.J., 2007, MNRAS, 381, 1035
- Springob et al. (2012) Springob C.M. et al., 2012, MNRAS, 420, 2773
- Tanaka et al. (2004) Tanaka M., Goto T., Okamura S., Shimasaku K., Brinkmann J., 2004, AJ, 128, 2677
- Terlevich & Forbes (2002) Terlevich A.I., Forbes D.A., 2002, MNRAS, 330, 547
- Thomas et al. (2005) Thomas D., Maraston C., Bender R., Mendes de Oliveira C., 2005, ApJ, 621, 673
- Tinker et al. (2011) Tinker J., Wetzel A., Conroy C., 2011, preprint (arXiv:1107.5046)
- Tinsley (1979) Tinsley B.M., 1979, ApJ, 229, 1046
- Trager et al. (2000a) Trager S.C., Faber S.M., Worthey G., Jesús González J., 2000a, AJ, 119, 1645
- Trager et al. (2000b) Trager S.C., Faber S.M., Worthey G., Jesús González J., 2000b, AJ, 120, 165
- Trager & Somerville (2009) Trager S.C., Somerville R.S., 2009, MNRAS, 395, 608
- Trujillo et al. (2011) Trujillo I., Ferreras I., de la Rosa I.G., 2011, MNRAS, 415, 3903
- van den Bosch et al. (2007) van den Bosch F.C. et al., 2007, MNRAS, 376, 841
- van den Bosch et al. (2008) van den Bosch F.C., Aquino D., Yang X., Mo H.J., Pasquali A., McIntosh D.H., Weinmann S.M., Kang X., 2008, MNRAS, 387, 79
- van der Wel et al. (2009) van der Wel A., Bell E.F., van den Bosch F.C., Gallazzi A., Rix H.-W., 2009, ApJ, 698, 1232
- van Dokkum et al. (2010) van Dokkum P.G. et al., 2010, ApJ, 709, 1018
- Villumsen (1983) Villumsen J.V., 1983, MNRAS, 204, 219
- Wake et al. (2004) Wake D.A. et al., 2004, ApJ, 610, L85
- Wake et al. (2012) Wake D.A., van Dokkum P.G., Franx M., 2012, ApJ, 751, L44
- Wang et al. (2010) Wang J., Overzier R., Kauffmann G., von der Linden A., Kong X., 2010, MNRAS, 401, 433
- Weinmann et al. (2006) Weinmann S.M., van den Bosch F.C., Yang X., Mo H.J., 2006, MNRAS, 366, 2
- Wetzel et al. (2013) Wetzel A.R., Tinker J.L., Conroy C., van den Bosch F.C., 2013, MNRAS, 432, 336
- Wilman et al. (2010) Wilman D.J., Zibetti S., Budavári T., 2010, MNRAS, 406, 1701
- Worthey et al. (1992) Worthey G., Faber S.M., González J.J., 1992, ApJ, 398, 69
- Yan et al. (2006) Yan R., Newman J.A., Faber S.M., Konidaris N., Koo D., Davis M., 2006, ApJ, 648, 281
- Yang et al. (2005) Yang X., Mo H.J., van den Bosch F.C., Jing Y.P., 2005, MNRAS, 356, 1293
- Yang et al. (2007) Yang X., Mo H.J., van den Bosch F.C., Pasquali A., Li C., Barden M., 2007, ApJ, 671, 153