Nano-Kelvin thermometry and temperature control: beyond the thermal noise limit
Abstract
We demonstrate thermometry with a resolution of 80 using an isotropic crystalline whispering-gallery mode resonator based on a dichroic dual-mode technique. We simultaneously excite two modes that have a mode frequency ratio very close to two (ppm). The wavelength- and temperature-dependence of the refractive index means that the frequency difference between these modes is an ultra-sensitive proxy of the resonator temperature. This approach to temperature sensing automatically suppresses sensitivity to thermal expansion and vibrationally induced changes of the resonator. We also demonstrate active suppression of temperature fluctuations in the resonator by controlling the intensity of the driving laser. The residual temperature fluctuations are shown to be below the limits set by fundamental thermodynamic fluctuations of the resonator material.
- PACS numbers
-
07.20.Dt, 42.60.Da, 42.62.Fi
pacs:
Valid PACS appear hereThe high-resolution measurement of energy has long fascinated humans with its culmination seen in ultra-high sensitivity calorimeters Hansen and Hart (2004); Wadsö (2002) and bolometers Richards (1994). These, and related ideas have found a broad range of applications including bolometric superconducting photon-counters for quantum communication Takesue et al. (2007), ultra-sensitive radio astronomy Piat et al. (2003); Woods et al. (2010). The record for absolute thermometric sensitivity has been realised at cryogenic temperatures, achieving better than Sergatskov et al. (2003).
In this letter we develop a new method to measure temperature based on excitation of a millimetre-scale Whispering-Gallery (WG) optical resonator with two widely frequency spaced modes. These compact resonators have exceptionally high Q-factors and offer the potential to provide high-stability microwave and optical signals Mann et al. (2001); Tobar et al. (2006); Sprenger et al. (2010); Liang et al. (2010); Alnis et al. (2011). Recently they been applied to high-sensitivity label-free sensors for molecules and viruses Armani et al. (2007); Vollmer et al. (2008) and for optical comb generation Kippenberg et al. (2011). Nonetheless, an issue that afflicts all these applications is the high temperature sensitivity of WG resonators Matsko et al. (2007); Alnis et al. (2011), particularly when compared to conventional vacuum-spaced Fabry-Perot resonators Kessler et al. (2012); Amairi et al. (2012); Numata et al. (2004); Webster et al. (2008); Millo et al. (2009). In this letter we turn this problem to our advantage by using the WG resonator as an ultra-sensitive thermometer.
To suppress unwanted temperature fluctuations in WG resonators several groups have demonstrated in situ thermometry by measuring the frequency difference between two orthogonally polarised modes. The best of these techniques have demonstrated a resolution of Strekalov et al. (2011), and subsequent temperature stabilisation based on this sensing has resulted in improvement to the long term frequency stability Fescenko et al. (2012); Baumgartel et al. (2012). In contrast, we present a two-colour approach to measure the resonator temperature with high resolution. In comparison to the birefringent dual-mode technique, our approach can be used in both anisotropic and isotropic resonators, which expands the range of material candidates. Isotropic materials have shown the highest Q-factors to date Savchenkov et al. (2007a), which offers potentially higher temperature resolution. On the other hand, a combination of the dual-colour and dual-polarisation approaches in an anisotropic material (e.g. MgF2) can further enhance the temperature sensitivity. Furthermore, our dual-colour technique strongly rejects noise from thermal expansion fluctuations and vibrations, giving us the ability to measure the mode-averaged temperature with a resolution below that of the fundamental thermal temperature fluctuations Braginsky et al. (1999); Gorodetsky and Grudinin (2004); Matsko et al. (2007).
The frequency of a WG mode depends on temperature through: (a) the temperature dependence of the refractive index (thermo-optic effect) as well as (b) the thermal expansion of the resonator. The first dependence leads to sensitivity to the temperature solely within the the optical mode, while in the latter the the mode frequency depends on the temperature distribution throughout the entire resonator volume. For simplicity, we assume a steady-state temperature distribution, , when the resonator is excited by some input optical power, , that is solely dependent on the radial co-ordinate, . This approximation reflects the typical triple cylindrical symmetry exhibited by the (i) resonator geometry, (ii) optical power distribution and (iii) thermal coupling to the external environment. When the power-induced temperature changes from ambient are small (i.e. ), we can express the frequency, , of the mode as:
| (1) |
where is the frequency of the mode in the absence of excitation power, is the linear thermal expansion coefficient, and and are the thermo-optic coefficient and refractive index of the resonator material, respectively, is the radius at the mode intensity maximum, and characterises the refractive index dependence upon the optical intensity, which depends on the Kerr coefficient , and finesse Schliesser (2009). and are the intrinsic Q-factor and coupling Q-factor respectively. We define an effective mode area , where is the amplitude of the mode in the transverse plane and is the field amplitude of the resonant energy (which allows for more than 1 mode to be excited simultaneously).
The basis of our thermometer is to simultaneously lock two optical signals to two WG modes that have frequencies and with . These modes are chosen to be within the same transverse mode family (i.e identical polar and radial field maxima numbers Little et al. (1999)) to maximise their spatial overlap. For simplicity the two optical signals are derived from a single laser with frequency .
The direct output of the laser is locked using the Pound-Drever-Hall (PDH) technique Drever et al. (1983) to the lower frequency WG mode, i.e. . We frequency double this laser signal and shift it into resonance with the second WG mode using an Acousto-Optic Modulator (AOM), so that . From Eq. 1, it follows that
| (2) |
where , is the relative non-linear Kerr shift, and which accounts for residual errors in the laser locking systems, i.e and . Importantly, the high degree of spatial overlap between the two modes gives rise to nearly identical frequency dependence on thermal expansion, so that the distributed thermal expansion term appearing in Eq. 1 is strongly suppressed in Eq. 2; we estimate its fractional contribution to be less than 1 part in and so we ignore it in what follows.
The first term on right hand side in Eq. 2 indicates that the AOM frequency provides a high-quality read-out of the resonator temperature if the thermo-optic coefficient at and is sufficiently different to dominate over the noise terms, . We show that this is the case for this resonator with sensing in the nK regime 111 We note that suppressing mode-averaged temperature fluctuations using this technique does not significantly improve the absolute frequency stability of the WGM resonator. Eq. 1 shows that the mode frequency depends on the temperature distribution throughout the resonator, which is not fixed by mode-averaged temperature control Fescenko et al. (2012); Baumgartel et al. (2012). .
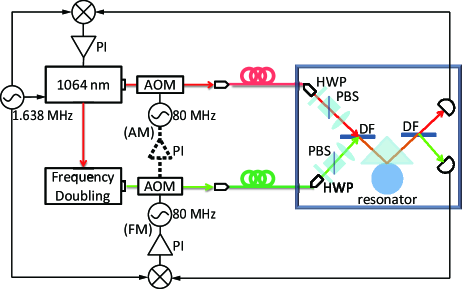
The experimental setup is shown in Fig. 1. A 5 mm radius CaF2 WGM resonator is mounted on a piezo-actuated translation stage within an acoustic and thermal shield. The laser light was coupled into the resonator using a high index prism. A conventional thermometer/heater pair was used to pre-stabilise the temperature of the system at 0.1 K level. Light from a Nd:YAG laser at 1064 nm, together with its second harmonic at 532 nm (generated in a single-pass nonlinear crystal), were transferred into the shielded volume using single-mode optical fibres. The 532 nm light was double-passed through an AOM to enable independent frequency tuning of this beam. The 1064 nm light was also double-passed through a second AOM for reasons explained below. The two AOMs were driven with independent oscillators with nominal frequency around 80 MHz and were set to shift the frequency upwards. Both beams were recombined inside the shielded volume using a dichroic filter before being coupled into the resonator. The transmitted beams were separated using a second dichroic filter and then registered by two photodetectors. The laser was frequency modulated at 1.638 MHz and the two detected signals were synchronously demodulated using the traditional PDH technique to generate independent error signals appropriate to lock the laser signals onto their respective modes. The error signal generated from the 1064 nm mode was integrated and sent directly back to the laser controller to maintain the frequency lock. The second harmonic light was frequency locked by controlling the frequency of the synthesiser that drove the AOM.
As the evanescent field has different scale lengths for the two modes Little et al. (1999), it was necessary to over-couple the 1064 nm mode in order to achieve adequate coupling for the 532 nm mode. Thus, the loaded Q for the modes was and for the 1064 nm and 532 nm modes respectively. This situation may be overcome by designing an appropriate coupling scheme Ghulinyan et al. (2013).
The fast fluctuations of the WG-resonator thermometer were monitored by observing the frequency fluctuations of with a spectrum analyser, while slower fluctuations were monitored by a frequency counter. In addition, we measured the frequency of the lower frequency mode () with a stabilised frequency comb ( for time scales 1 s). For these experiments, the excitation power was deliberately kept at low levels (50 W for 532 nm and 70 W for 1064 nm) so that photo-thermal Matsko et al. (2007); Goda et al. (2005) and Kerr noise were both at least 10 dB below the measured spectrum at all frequencies. The low levels of these noise sources during operation was verified by increasing the input power until both effects were observed and then turning the power back down by a factor of ten when in operation.
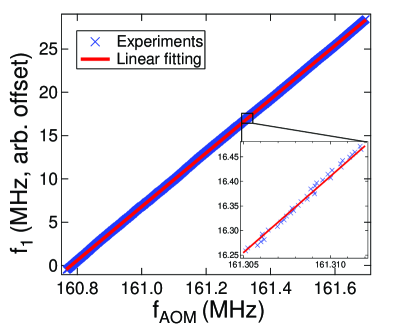
Fig. 2 displays the variation of the lower mode frequency () as a function of the frequency of the AOM (a proxy for the mode temperature) where the resonator temperature drifts by 10 mK. As expected, there is a very high degree of correlation between and (see inset), with slope . We calculate the expected mode-frequency sensitivity from the known parameter values for CaF2 at 1064 nm (, /K and /K at 1064 nm Savchenkov et al. (2007b); Feldman et al. (1979)) as GHz/K. We were able to verify this calculated value at the level of 10% by changing the temperature of the resonator mount intentionally. The mode-frequency to temperature relation is combined with the observed relation to the AOM frequency to give a thermometer calibration of MHz/K. In what follows, we examine the fluctuations of in more detail, but first we explain the means for temperature control of the resonator.
The resonator temperature can be controlled with a high bandwidth by actively controlling the input optical power. For these experiments we increased the 1064 nm power to mW to increase the range of the temperature control system. By directly measuring the transfer function between and the 1064 nm power, we find the control bandwidth is kHz. The control actuator is indicated on Fig. 1 as the dotted line in which the drive power of the 1064 nm AOM is actively controlled to maintain the frequency of the AOM at a fixed value, which locks the resonator temperature. With this thermal control, the average mode temperature can be stabilised at the 100 nK level for more than an hour as seen on Fig. 3(a). A residual drift of MHz/hr in the mode frequency arises because it depends upon the entire temperature distribution, which is uncontrolled. The ripples with a s period are associated with room temperature modulation from the air-conditioning. Fig.3(b) shows a time-domain representation of the temperature fluctuations of the controlled and uncontrolled resonator using the Allan deviation Allan (1966). We see that the control system suppresses the long-term temperature fluctuations by more than 4 orders of magnitude to the 30 nK level. The long term temperature stability appears flat as a result of the interaction of the free running fluctuations and the transfer function of our control loop: a more sophisticated control system could result in further suppression. In Fig. 3(c), we show the Allan deviation of the locked 1064 nm mode frequency when the temperature is stabilised. The performance is substantially worse than one would expect if the mode frequency only depended upon the temperature in the mode ( at 1 second averaging time). Nonetheless, the temperature control technique suppressed the mode frequency fluctuations by nearly 1 order of magnitude.
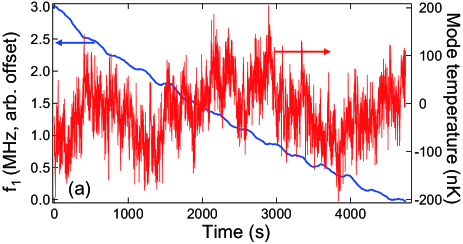
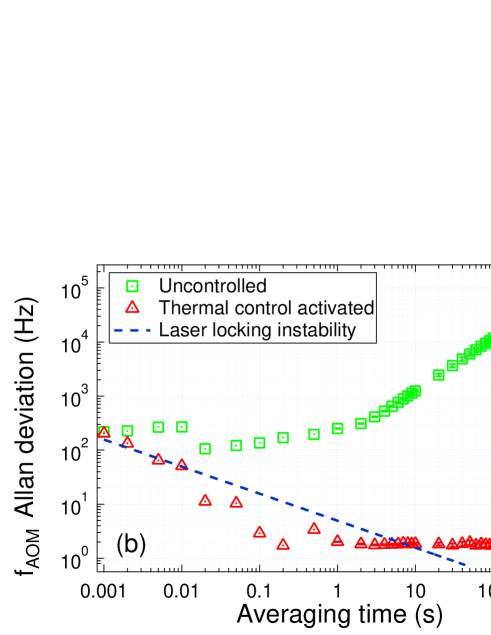
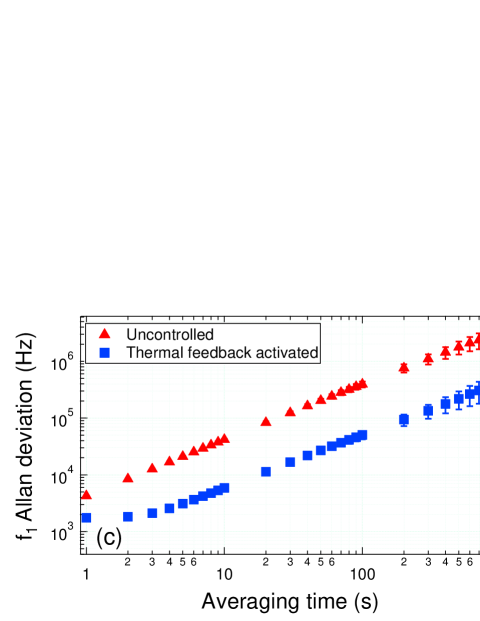
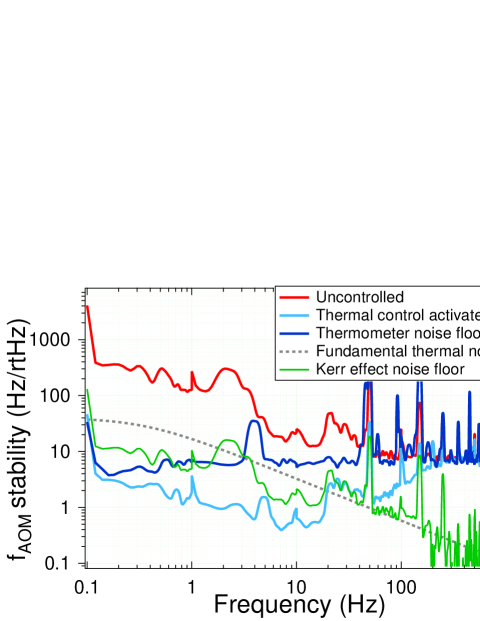
Fig. 4 shows the power spectral density (PSD) of when it is free-running, and when it is actively controlled. We also display the fundamental temperature fluctuations calculated using the method in Matsko et al. (2007). We assume that the two optical modes have large spatial overlap, which is reasonable given that the thermal wavelength of even the highest frequency thermal noise ( kHz) considered here is much larger than the transverse extent of the optical modes, or their separation Matsko et al. (2007). The unstabilised mode temperature fluctuation exceeds the calculated fundamental thermal fluctuations by a factor of 10 at low frequencies because the resonator is also subject to fluctuations in ambient temperature and input-power.
Fig. 4 also shows the noise floor of the temperature sensor (i.e. in Eq. 2), which arises from the residual frequency noise in the two optical frequency stabilisation loops as well as the effect of Kerr fluctuations induced by the input intensity control. Residual frequency noise in the stabilisation loops was independently estimated by measuring the noise in the frequency locking systems when the lasers were detuned from resonance: in these circumstances, we measure the sum of any electronic, shot-noise, residual amplitude modulation (RAM) and residual intensity noise (RIN) that limit the frequency stabilization loops. The RIN in the environs of the PDH modulation frequency was seen to be the dominant contributor to this noise limit and sets a resulting 80 temperature sensitivity that is reasonably frequency-independent. It can be seen that this sensitivity is below the fundamental thermal noise of the resonator for thermal frequencies below 3 Hz.
Finally, Fig. 4 shows the residual temperature fluctuations once the mode temperature is stabilised: the fluctuations are strongly suppressed by the control system within its 200 Hz thermal control bandwidth.
We note that an additional noise floor arises when the resonator temperature is actively controlled: the required intensity modulation causes frequency shifts both through the desired temperature changes but also through an unwanted Kerr effect. This arises because the self-mode Kerr shift and cross-Kerr mode shift differ because of the differing cross-sectional areas for the two modes. This type of noise floor could be minimised by modulating the power of both excited modes together in a judiciously chosen ratio that results in the same effective Kerr shift in the two modes. We have not undertaken this procedure here since it was not the limiting factor in the performance of the temperature sensor. This induced noise floor is also shown on Fig. 4 and was determined by measuring the spectrum of the intensity modulation required to keep the temperature stabilised. The transfer coefficient between intensity and the resulting Kerr frequency shift was measured by applying an intentionally large intensity modulation. The resulting Kerr sensitivity was in broad agreement with the theoretical shifts expected from the relatively large mode volumes ( cm).
This experiment demonstrates the potential of the technique. There are several routes to further improve the sensitivity and resolution: (a) Reduce the residual noise in the frequency locking system by increasing the Q-factor of the modes. To this end, a more sophisticated coupling would reduce the current difference in evanescent coupling strengths, thereby improving the Q-factor Ghulinyan et al. (2013). (b) Increase the difference between the thermo-optic coefficients for the fundamental and second harmonic by moving to fundamental wavelength of 800-900 nm. This difference can be times larger than that of the two wavelengths used here Ghosh (1998). (c) Combine the wavelength- and polarisation-dependent thermal-sensing techniques in a material such as MgF2. Combining these approaches, we estimate that it is feasible to obtain a sensitivity below 10 with the same detection noise.
To conclude, we report a dichroic mode temperature sensing and thermal stabilisation scheme in a WGM resonator. The experiment achieves tens of nano-Kelvin temperature stability by suppressing thermal fluctuations below the fundamental thermal noise level. This technique opens the possibility for the WG mode resonator as an ultra-sensitive thermometer.
Acknowledgements The authors gratefully acknowledge financial support from the Australian Research Council under grants DP0877938, FT0991631, LE110100054 and LE100100009 that enabled this work. The authors also wish to acknowledge the South Australian Government who have provided generous financial support through the Premier’s Science and Research Fund. The authors thank Ping Koy Lam for developing the facility for shaping the resonator and Frank Van Kann for useful discussions. W. Weng gratefully acknowledges financial support from China Scholarship Council and University of Western Australia.
References
- Hansen and Hart (2004) L. D. Hansen and R. M. Hart, Thermochim. Acta 417, 257 (2004).
- Wadsö (2002) I. Wadsö, Thermochim. Acta 394, 305 (2002).
- Richards (1994) P. Richards, J. Appl. Phys. 76, 1 (1994).
- Takesue et al. (2007) H. Takesue, S. W. Nam, Q. Zhang, R. H. Hadfield, T. Honjo, K. Tamaki, and Y. Yamamoto, Nature photonics 1, 343 (2007).
- Piat et al. (2003) M. Piat, J.-M. Lamarre, J. Meissonnier, J.-P. Torre, P. Camus, A. Benoit, J.-P. Crussaire, P. A. Ade, J. J. Bock, A. E. Lange, et al., in Astronomical Telescopes and Instrumentation (International Society for Optics and Photonics, 2003) pp. 740–748.
- Woods et al. (2010) S. I. Woods, S. M. Carr, T. M. Jung, A. C. Carter, and R. U. Datla, Journal of Applied Physics 108, 024505 (2010).
- Sergatskov et al. (2003) D. A. Sergatskov, P. K. Day, A. V. Babkin, R. C. Nelson, T. D. McCarson, S. T. P. Boyd, and R. V. Duncan, AIP Conference Proceedings 684, 1009 (2003).
- Mann et al. (2001) A. G. Mann, C. Sheng, and A. N. Luiten, IEEE Trans. Instrum. Meas. 50, 519 (2001).
- Tobar et al. (2006) M. E. Tobar, E. N. Ivanov, C. R. Locke, P. L. Stanwix, J. G. Hartnett, A. N. Luiten, R. B. Warrington, P. T. Fisk, M. A. Lawn, M. J. Wouters, et al., IEEE Trans. Ultrason., Ferroelectr. Freq. Control 53, 2386 (2006).
- Sprenger et al. (2010) B. Sprenger, H. Schwefel, Z. Lu, S. Svitlov, and L. Wang, Opt. Lett. 35, 2870 (2010).
- Liang et al. (2010) W. Liang, V. Ilchenko, A. Savchenkov, A. Matsko, D. Seidel, and L. Maleki, Opt. Lett. 35, 2822 (2010).
- Alnis et al. (2011) J. Alnis, A. Schliesser, C. Y. Wang, J. Hofer, T. J. Kippenberg, and T. W. Hänsch, Phys. Rev. A 84, 011804 (2011).
- Armani et al. (2007) A. M. Armani, R. P. Kulkarni, S. E. Fraser, R. C. Flagan, and K. J. Vahala, Science 317, 783 (2007).
- Vollmer et al. (2008) F. Vollmer, S. Arnold, and D. Keng, Proc. Natl. Acad. Sci. USA 105, 20701 (2008).
- Kippenberg et al. (2011) T. Kippenberg, R. Holzwarth, and S. Diddams, Science 332, 555 (2011).
- Matsko et al. (2007) A. B. Matsko, A. A. Savchenkov, N. Yu, and L. Maleki, J. Opt. Soc. Am. B 24, 1324 (2007).
- Kessler et al. (2012) T. Kessler, C. Hagemann, C. Grebing, T. Legero, U. Sterr, F. Riehle, M. Martin, L. Chen, and J. Ye, Nat. Photonics 6, 687 (2012).
- Amairi et al. (2012) S. Amairi, T. Legero, T. Kessler, U. Sterr, J. B. Wübbena, O. Mandel, and P. O. Schmidt, Appl. Phys. B , 1 (2012).
- Numata et al. (2004) K. Numata, A. Kemery, and J. Camp, Phys. Rev. Lett. 93, 250602 (2004).
- Webster et al. (2008) S. A. Webster, M. Oxborrow, S. Pugla, J. Millo, and P. Gill, Phys. Rev. A 77, 033847 (2008).
- Millo et al. (2009) J. Millo, D. V. Magalhaes, C. Mandache, Y. Le Coq, E. M. L. English, P. G. Westergaard, J. Lodewyck, S. Bize, P. Lemonde, and G. Santarelli, Phys. Rev. A 79, 053829 (2009).
- Strekalov et al. (2011) D. V. Strekalov, R. J. Thompson, L. M. Baumgartel, I. S. Grudinin, and N. Yu, Opt. Express 19, 14495 (2011).
- Fescenko et al. (2012) I. Fescenko, J. Alnis, A. Schliesser, C. Wang, T. Kippenberg, and T. Hänsch, Opt. Express 20, 19185 (2012).
- Baumgartel et al. (2012) L. M. Baumgartel, R. J. Thompson, and N. Yu, Opt. Express 20, 29798 (2012).
- Savchenkov et al. (2007a) A. A. Savchenkov, A. B. Matsko, V. S. Ilchenko, and L. Maleki, Opt. Express 15, 6768 (2007a).
- Braginsky et al. (1999) V. Braginsky, M. Gorodetsky, and S. Vyatchanin, Phys. Lett. A 264, 1 (1999).
- Gorodetsky and Grudinin (2004) M. L. Gorodetsky and I. S. Grudinin, J. Opt. Soc. Am. B 21, 697 (2004).
- Schliesser (2009) A. Schliesser, Cavity Optomechanics and Optical Frequency Comb Generation with Silica Whispering-Gallery-Mode Microresonators, Ph.D. thesis, Ludwig Maximilian University of Munich (2009).
- Little et al. (1999) B. E. Little, J.-P. Laine, and H. A. Haus, J. Lightwave Technol. 17, 704 (1999).
- Drever et al. (1983) R. Drever, J. L. Hall, F. Kowalski, J. Hough, G. Ford, A. Munley, and H. Ward, Appl. Phys. B 31, 97 (1983).
- Note (1) We note that suppressing mode-averaged temperature fluctuations using this technique does not significantly improve the absolute frequency stability of the WGM resonator. Eq. 1 shows that the mode frequency depends on the temperature distribution throughout the resonator, which is not fixed by mode-averaged temperature control Fescenko et al. (2012); Baumgartel et al. (2012).
- Ghulinyan et al. (2013) M. Ghulinyan, F. Ramiro-Manzano, N. Prtljaga, R. Guider, I. Carusotto, A. Pitanti, G. Pucker, and L. Pavesi, Phys. Rev. Lett. 110, 163901 (2013).
- Goda et al. (2005) K. Goda, K. McKenzie, E. E. Mikhailov, P. K. Lam, D. E. McClelland, and N. Mavalvala, Phys. Rev. A 72, 043819 (2005).
- Savchenkov et al. (2007b) A. A. Savchenkov, A. B. Matsko, V. S. Ilchenko, N. Yu, and L. Maleki, J. Opt. Soc. Am. B 24, 2988 (2007b).
- Feldman et al. (1979) A. Feldman, D. Horowitz, R. M. Waxler, and M. J. Dodge, Optical Materials Characterization, Final Technical Report February 1, 1978-September 30, 1978, Tech. Rep. (DTIC Document, 1979).
- Allan (1966) D. W. Allan, Proc. IEEE 54, 221 (1966).
- Ghosh (1998) G. Ghosh, Handbook of Optical Constants of Solids: Handbook of Thermo-Optic Coefficients of Optical Materials with Applications (Academic Press, 1998).