Collapse of the Normal State Pseudogap at a Lifshitz Transition in Bi2Sr2CaCu2O8+δ Cuprate Superconductor
Abstract
We report a fine tuned doping study of strongly overdoped Bi2Sr2CaCu2O8+δ single crystals using electronic Raman scattering. Combined with theoretical calculations, we show that the doping, at which the normal state pseudogap closes, coincides with a Lifshitz quantum phase transition where the active hole-like Fermi surface becomes electron-like. This conclusion suggests that the microscopic cause of the pseudogap is sensitive to the Fermi surface topology. Furthermore, we find that the superconducting transition temperature is unaffected by this transition, demonstrating that their origins are different on the overdoped side.
pacs:
74.72.Gh,74.72.Kf,74.25.nd,74.62.DhRevealed more than twenty five years ago by nuclear magnetic resonanceAlloul et al. (1989); Warren et al. (1989); Imai et al. (1989), the pseudogap phase in cuprates remains hitherto a mysterious state of matter out of which the high-temperature superconductivity emerges. The pseudogap appears below the temperature and manifests itself as a loss of quasiparticle spectral weight. Although intensely studied in the underdoped regime Timusk and Statt (1999); Norman et al. (2005); Taillefer (2010), relatively less is known about the pseudogap on the overdoped side, where it weakens and eventually disappears. Thus, a logical line of enquiry is to study the pseudogap closing as a function of doping , and to identify what triggers it in the first place.
In systems where intersects the superconducting dome described by the critical temperature , this task is complicated by the appearance of the superconducting phase. One way to proceed is to perform such a study at the lowest available temperatures, either in the superconducting phase Loram et al. (2001); Shekhter et al. (2013); Mangin-Thro et al. (2014); Fujita et al. (2014); He et al. (2014); Liu et al. (2008), or by suppressing it with magnetic field Daou et al. (2009) or disorderAlloul et al. (2009). Often such studies have inferred a quantum phase transition Varma (1999); Tallon and Loram (2001); Sachdev (2010) associated with the pseudogap closing.
A second possibility is to track the normal state pseudogap at a higher temperature, and to study the vicinity of the doping where it closes. Since , defined as the doping where , is essentially a finite temperature property, a priori it is not clear if it is linked to a quantum phase transition.
In this work our main result is to show that in Bi2Sr2CaCu2O8+δ (Bi-2212) is indeed tied to a Lifshitz quantum phase transition where the underlying hole-like active Fermi surface becomes electron-like at a van Hove singularity. Interestingly, we find that is unaffected by this transition. Moreover, comparing our results with existing photoemission and tunnelling data of several hole-doped cuprates, we infer that the microscopic origins of the pseudogap and the superconductivity are generically different on the overdoped side. Only the former is tied to the change in the Fermi surface topology, which removes quasiparticles from regions in momentum space of high scattering rate (hot regions). While the collapse of the normal state pseudogap Sacuto et al. (2013); Chatterjee et al. (2011); Vishik et al. (2012), as well as the change of Fermi surface topology Kaminski et al. (2006) have been reported earlier, to the best of our knowledge, the link between the two has not been demonstrated before in Bi-2212. Consequently, our result provides important clue regarding the microscopic origin of the normal state pseudogap, and its relation with superconductivity.
One technical obstacle to study pseudogap closing is the lack of sufficiently overdoped samples belonging to the same family of cuprates. Indeed, our study was made possible due to the availability of several high quality Bi-2212 single crystals with doping close to , as reported in Supplemental Material (SM). The level of doping was controlled only by oxygen insertion, and the highest doping achieved was around . This allowed us to perform a careful finely tuned electronic Raman study of the doping dependence and determine .
The Raman measurements were performed in geometries that probe respectively the antinodal (AN) region near and and the nodal (N) region near , (cf. SM). Our spectra are comparable with earlier studies with a different laser line Venturini et al. (2002a, b), thereby demonstrating absence of resonance effects in the overall conclusions. In the following the quantity of importance is the integrated Raman intensity defined by
| (1) |
extracted from the Raman response where is a cutoff. We experimentally demonstrate our main result in two steps.
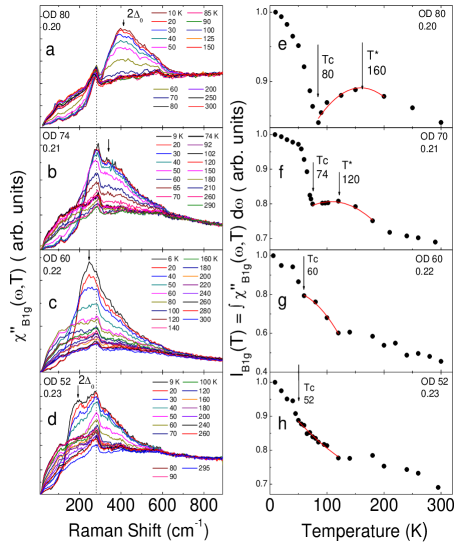
In the first step we determine precisely, which is a refinement of our earlier work Sacuto et al. (2013). In Fig. 1, (a)-(d), we report Raman responses at different temperatures and for different overdoped (OD) compounds. The temperature dependence of the corresponding integrated intensities are shown in Fig. 1,(e)-(h). In Fig. 1.a, we show the spectra for the Bi-2212 OD80 compound. We observe that the pair-breaking peak (), located at 408 cm-1, decreases in intensity with increasing temperature and disappears at . Correspondingly, decreases monotonically exhibiting a dip at (Fig.1.e). Just above however, the low energy spectral weight (below 408 cm-1) increases (positive slope) with temperature.
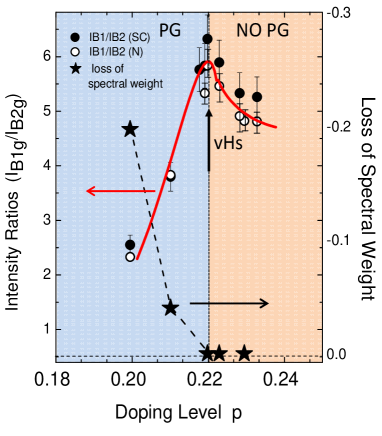
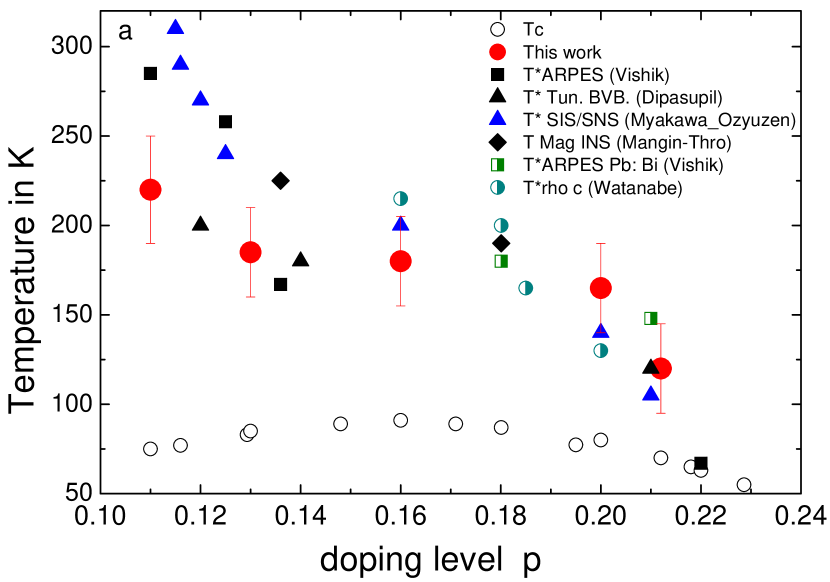
This recovery of spectral weight,which can be as large as 15% for (cf. Fig. 3 in SM), is the signature of the presence of the pseudogap in the normal state spectra. Note that, this -dependence is opposite to that of a normal metal. Therefore, above , increases monotonically, until it reaches a maximum at a temperature that defines the onset temperature of the pseudogap (Fig.1.e). Above , the T-dependence of is the one of a normal metal. Our estimate of is in good agreement with previous transport and spectroscopy measurements (cf. Fig. 4 of SM). As the doping level increases (Fig. 1. a-d), the difference between and shrinks, and disappears at , indicating the collapse of the normal state pseudogap. For the slope of just above is negative, implying there is no signature of the normal state pseudogap anymore. Quantitatively, this behavior is captured by the doping dependence of the loss of the spectral intensity, defined by and which we report in Fig. 3 as black stars. Note that a change in the slope of at appears at K which is definitely higher than the pseudogap K. Consequently, this feature is not related to the pseudogap, and its origin is currently under investigation.
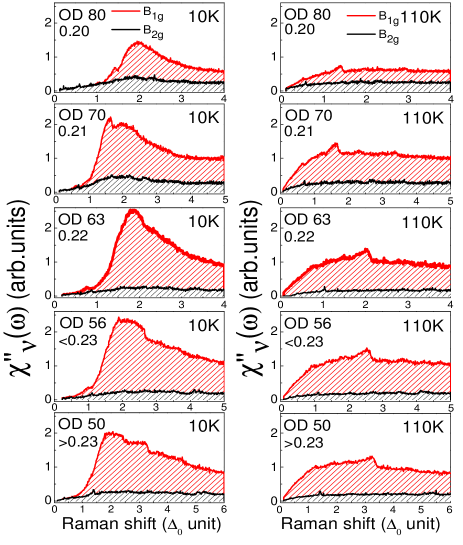
The second step involves comparing the spectra in the and geometries, and following their doping evolutions around at fixed temperatures. Importantly, we succeeded in measuring the and Raman responses of each crystal on the same laser spot (see SM). We first show in Fig. 2 representative (red/grey) and (black) Raman responses, at (superconducting state) and at (normal state) for selected doping levels. The Raman shift is expressed in units of the superconducting gap , in order to compare better samples with varying gap values. Note that, both in the superconducting and the normal states, the response increases continuously in magnitude compared to the response for , consistently with earlier studies Venturini et al. (2002a); Blanc et al. (2009); Hewitt and Irwin (2002); Munnikes et al. (2011); Masui et al. (2003, 2009); Naeini et al. (1999); Gasparov et al. (1998). However, the crucial finding of the current work is that this trend changes and the response starts to decrease beyond 0.22 doping.
The above non-monotonic doping dependence is best quantified by extracting the ratio of the integrated intensities from the Raman responses using Eq. 1. Studying the intensity ratio, rather than the absolute intensities, allow us to avoid spurious effects due to non intrinsic intensity modulations that may occur when passing from one crystal to another (cf.SM). Note that, in principle contains not only the contribution of the electronic background (which is what we are interested in), but also that of the phonon peaked sharply at 300 cm-1 (see the dotted line in Fig. 1). However, by comparing the current spectra with that obtained using 647.1 nm laser line, in which the phonon peak is absent, we are able to confirm that , and especially its doping dependence, is mostly due to the electronic background not .
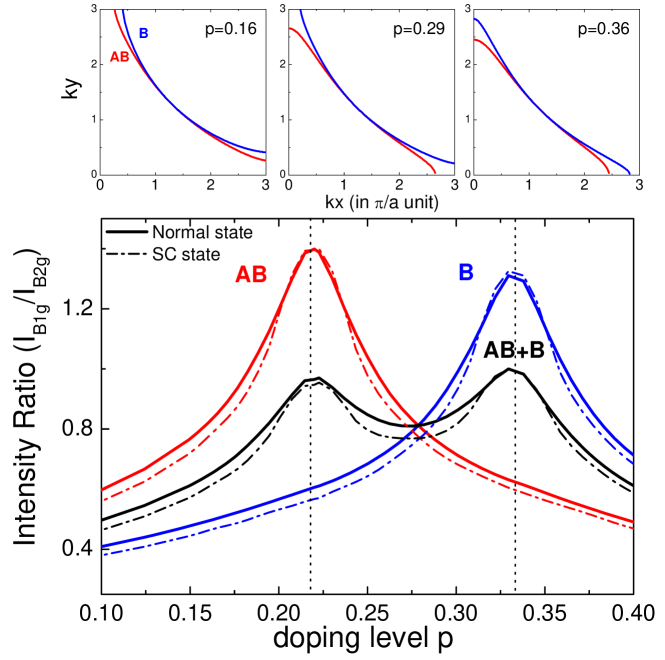
In Fig. 3 we report the doping dependencies of the intensity ratios in the superconducting (filled circles) and the normal states (open circles). Note that, the ratios in the two phases are nearly the same, thereby indicating that is unaffected by the superconducting gap. Most importantly, the ratios change non-monotonically as a function of , and they reveal a sharp peak located at , the doping where the normal state pseudogap closes (black stars). We confirmed that the sharp peak is not a resonance effect, since it is visible with two distinct laser lines (532 nm and 647.1 nm).
Note that the peak in cannot be attributed to the doping dependence of the pseudogap which is monotonic. Instead, the temperature independence of the sharp peak position indicates that it is related to enhanced density of states of the underlying band structure around the AN region of the Brillouin zone. This invariably leads to the possibility of a doping induced Lifshitz transition wherein, as a van Hove singularity crosses the chemical potential, the open hole-like anti-bonding Fermi surface closes around the and points and becomes electron-like. An electron-like anti-bonding band in Bi-2212 at has been reported by ARPES data Kaminski et al. (2006), but this change of topology was not linked with the closing of the pseudogap.
In order to support this scenario we perform theoretical calculation of the Raman response function using a minimal tight-binding model
with the normal state dispersion Kordyuk et al. (2003): Here refer to the anti-bonding (AB) and the bonding (B) bands. The superconducting dispersion is
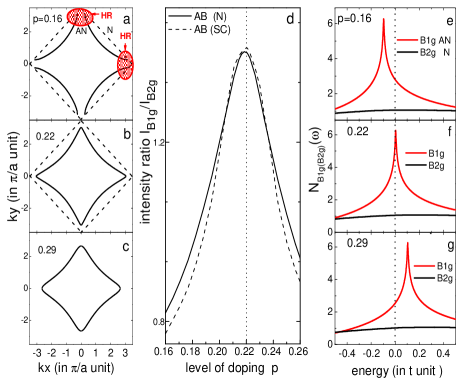
, with . We take , , and a doping independent . We change by varying the chemical potential . As shown in Fig. 4(a)-(c), this model undergoes a Lifshitz transition at where the AB band changes from being hole- to electron-like (the B band remains hole-like in this doping range, see SM). For simplicity we take a constant electron scattering rate and in the normal and the superconducting states respectively. An earlier work has shown that the scattering rates measured from the slopes of the Raman responses become isotropic around Venturini et al. (2002a). The calculation of and are standard (for details, cf. SM). The doping dependence of the calculated ratio shows prominent peaks at (see Fig. 4 (d)), both in the normal and the superconducting states, and reproduces qualitatively the experimental trend of Fig. 3.
The origin of the peak can be captured conveniently by tracking the doping dependence of the Raman vertex -weighted density of states which enter the calculation of . As shown in Fig. 4(e)-(g), the van Hove singularity shows up in , and the peak in the intensity corresponds to the van Hove singularity crossing the chemical potential. Simultaneously, since the geometry probes the diagonal directions of the Brillouin zone, is unaffected by the van Hove singularity and therefore has no significant doping dependence.
Based on the Mott formula, at the Lifshitz transition we expect a change in the sign of the Seebeck coefficient, provided the scattering rates are isotropic Buhmann and Sigrist (2013). However, as noted in an earlier work Kaminski et al. (2006), the Hall coefficient may remain positive across the Lifshitz transition, as observed in thin film studies Konstantinović et al. (2000).
A possible interpretation of our results is that the Lifshitz transition avoids the pseudogap by effectively moving quasiparticles from regions of strong scattering (hot regions) located around and (see panels (a)-(c), Fig. 4). Note that, this possibility is independent of the origin of the hot regions which could arise from fluctuations of antiferromagnetic spin-waves Chubukov (1998); Schmalian et al. (1998); Ioffe and Millis (1998); Chakravarty et al. (2001) or charge-density waves (related to long-ranged incommensurate charge modulations)Wang and Chubukov (2014); Comin et al. (2014); da Silva Neto et al. (2014); Wu et al. (2014); Sebastian et al. (2014); Pépin et al. (2014), or from Mott-related physics Civelli et al. (2005); Kyung et al. (2006); Ferrero et al. (2009); Sakai et al. (2013); Sordi et al. (2011). A second quantum critical point at inside the superconducting dome, separating a small from a large FS phase, has been inferred for example in recent scanning tunnelling microscopy Fujita et al. (2014); He et al. (2014) and ARPES Vishik et al. (2012) experiments.
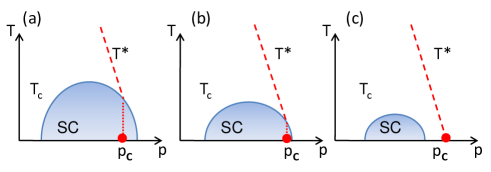
An intriguing pattern emerges upon comparing our results with those on other hole doped cuprate families near . In contrast with Bi-2212 and La1.6-xNd0.4SrxCuO4 Daou et al. (2009) where is located well inside the superconducting dome, in ARPES measurements on La2-xSrxCuO4 (LSCO) of Ref. Ino et al. (2002) the endpoints of the pseudogap and the superconducting phases are nearby in doping. Scanning tunneling spectroscopy on Bi2Sr2CuO6+δ,(Bi-2201) instead, found the pseudogap extending well into the normal phase Piriou et al. (2011). This suggests that the position of with respect to the superconducting dome is material dependent (see Fig. 5). Interestingly, just as we established here for Bi-2212, for both LSCO and Bi-2201 data analyses have suggested the coincidence of the pseudogap closing with a Lifshitz transition Ino et al. (2002); Piriou et al. (2011). Taken together, this appears to be a universal feature of the hole doped cuprates, and our findings establish an intimate connection between the normal state pseudogap and Fermi surface topology. In Tl2Ba2CuO6+δ (Tl-2201) the scenario is less clear, as the observation of the pseudogap is still debated Peets et al. (2007).
Few studies Ando et al. (2004); Tallon and Loram (2001) on Bi-2212 and YBa2Cu3O7-x,(Y-123) have reported the pseudogap closing at . This might simply imply that the normal state and the superconducting pseudogaps close at different dopings Vishik et al. (2012). Alternately, this apparent discrepancy could be related to the fact that in-plane transport and superfluid density are mostly sensitive to the nodal properties Ioffe and Millis (1998), while -axis transport and Raman probe mostly the antinodal properties Andersen et al. (1995). Next, in our scenario it is possible that for the pseudogap exists in the hole-like B band, but we do not find any signature of it in the Raman spectra, consistently with ARPES results Vishik et al. (2012). One possibility is that the response is predominantly from the AB band since it is close to a density of states singularity. We notice this trend in the theoretical calculation as well (cf. SM).
In conclusion, our results demonstrate that the mechanism that gives rise to the normal state pseudogap is sensitive to the topology of the Fermi surface, and is operational only when the latter is hole-like. Furthermore, we conclude that, on the overdoped side of the cuprates, the microscopic origins of the pseudogap and the superconductivity are different.
We are grateful to A. Georges, J. Tallon, A. Chubukov, M. Norman, L. Taillefer, C. Pépin, Ph. Bourges, Y. Sidis and A. Damascelli for very helpful discussions. Correspondences and requests for materials should be addressed to A.S (alain.sacuto@univ-paris-diderot.fr)
SUPPLEMENTAL MATERIAL
A. Raman Experiments
Raman experiments have been carried out using a triple grating spectrometer (JY-T64000) equipped with a liquid-nitrogen-cooled CCD detector. Two laser excitation lines were used: 532 nm and 647.1 nm from respectively a diode pump solid state laser and a Ar+/Kr+ mixed laser gas. The and geometries were obtained from cross polarizations at 45o from the Cu-O bond directions and along them respectively. The change from to geometries was obtained by keeping fixed the orientations of the analyzers and the polarizers and by rotating the crystal using an Attocube piezo-driven rotator. We got an accuracy on the crystallographic axes orientation with respect to the polarizers close to . Importantly, we succeeded in measuring the and Raman responses of each crystal on the same laser spot. This allowed us to keep constant the solid angle of collection and made reliable the to Raman integrated intensity ratio. Studying the intensity ratio rather than the absolute intensities of the Raman response prevent us from some non intrinsic intensity modulations when passing from one crystal to another.
All the spectra have been corrected for the Bose factor and the instrumental spectral response. They are thus proportional to the imaginary part of the Raman response function . Measurements between K and K have been performed using an ARS closed-cycle He cryostat. The laser power at the entrance of the cryostat was maintained below to avoid over heating of the crystal estimated to K/mW at K.
B. Crystal Growth and Characterization
The Bi-2212 single crystals were grown by using a floating zone method. The optimal doped sample with was grown at a velocity of 0.2 mm per hour in air Wen et al. (2008). In order to get overdoped samples down to , the as-grown single crystal was put into a high oxygen pressured cell between and bars and then was annealed from to during 3 days Mihaly et al. (1993). The overdoped samples below was obtained from as-grown Bi-2212 single crystals put into a pressure cell (Autoclave France) with bars oxygen pressure and annealed from to days at . Then the samples were rapidly cooled down to room temperature by maintaining a pressure of bars. The critical temperature for each crystal has been determined from magnetization susceptibility measurements at a Gauss field parallel to the c-axis of the crystal. More than 30 crystals have been measured among tested. The selected crystals exhibit a quality factor of larger than . is the full width of the superconducting transition. A complementary estimate of was achieved from electronic Raman scattering measurements by defining the temperature from which the superconducting pair breaking peak collapses.
C. Estimate of and its relationship to
The determination of was achieved by subtracting the normal Raman response at from the one in the superconducting state at . We define as the maximum of the electronic background in the subtracted spectra, see Fig.1.
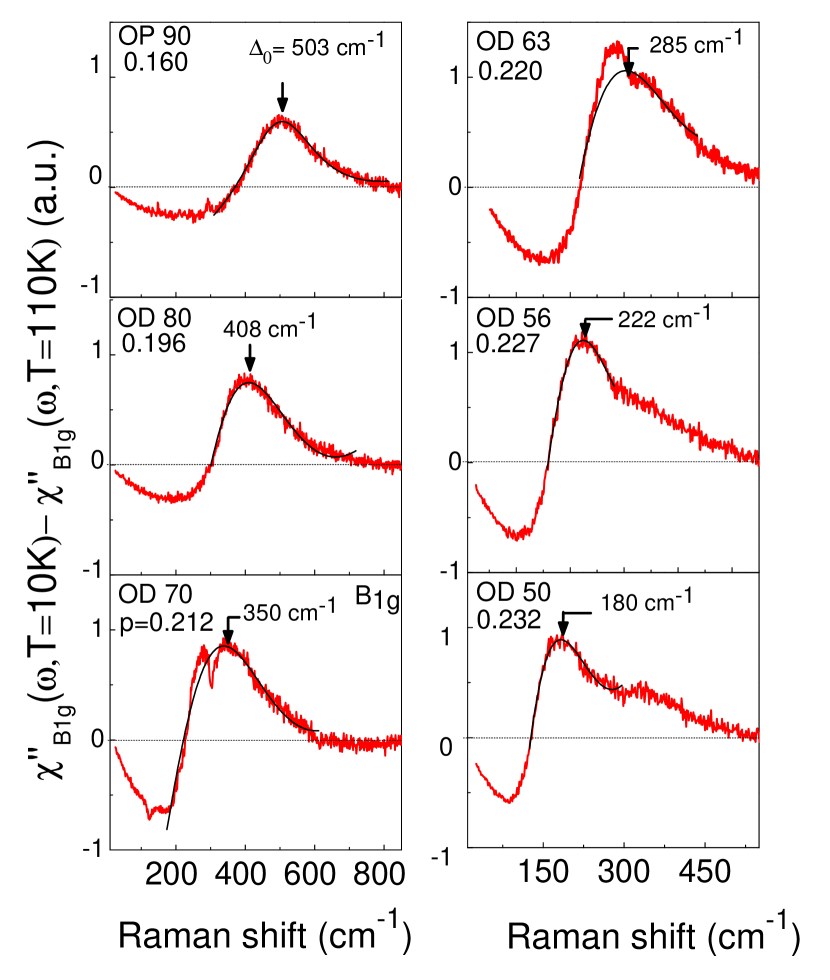
Special care has been devoted to select single crystals which exhibit the same value in the Raman spectra measured from distinct laser spots on a freshly cleaved surface. We find that increases linearly with in the overdoped regime and reaches its maximum value at . From a linear fit of the values in a short range between and , we find the reliable relationship: . In the underdoped regime falls down abruptly as a function of (see Fig. 7). The level of doping was defined from using Presland and Tallon’s equationPresland et al. (1991): . In the overdoped regime, estimate of can be directly determined from using the above two equations.

D. Signature of the pseudogap from integrated Raman Intensity
In Fig.8 is reported the temperature dependence of the Raman response and its integrated Raman intensity for several doping levels.
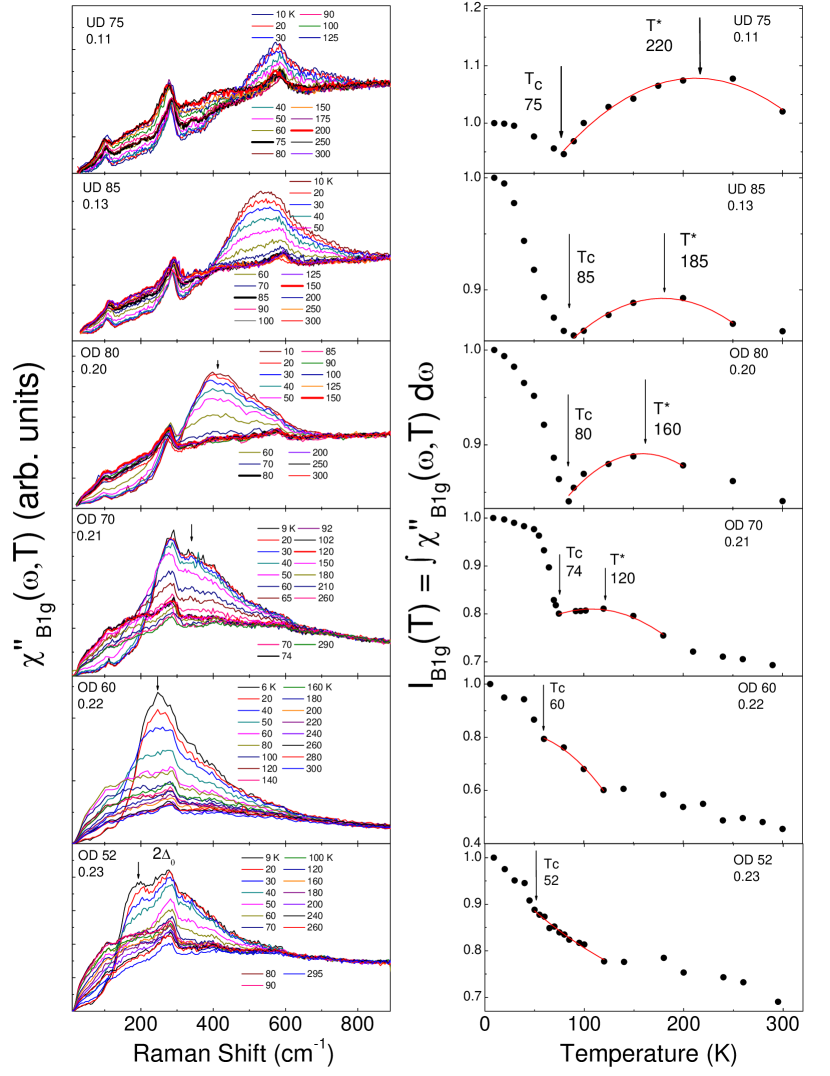
Below the Raman integrated intensity curves exhibit a dip at and reaches a maximum at that defines the onset of the pseudogap. The loss of spectral intensity is taken as the strength of the pseudogap. For p=0.11 (UD 75 crystal, Fig. 8, first row) the strength of the pseudogap is clearly detected and represents of the integrated Raman intensity at . Importantly, the signature of the pseudogap manifests itself by a positive slope of just above .This slope stays positive for , and changes sign only above . This change of sign has been underlined by fitting with a second order polynomial function (red curve in Fig.8) just above Tc. The absence of the pseudogap is then characterized by a negative slope of just after .
E. Comparison between determined from Raman and c-axis transport and other spectroscopy probes
It is important to point out that the doping evolution of from our Raman results on Bi-2212 is in good agreement with angle resolved photoemission (ARPES), recent neutron scattering, tunneling and resistivity measurements along the c-axis. This is displayed in Fig.9 and show that the electronic Raman scattering is a reliable probe for detecting the pseudogap and for studying its doping evolution. Note that got from Raman response has been compared to the c-axis tunneling and transport measurements because all these experiments probe mostly the anti-nodal properties (cf. O. K. Anderson, J. Phys. Chem. Sol. 56, 1573, 1995).
F. Theoretical Raman calculation
We calculate the electronic Raman response using standard zero-temperature linear response theory Devereaux and Hackl (2007); Chubukov and Norman (2008). This is given by
| (2) |
where the Raman vertex in the geometry is , with denoting spatial directions , and are polarization vectors for the incident and the scattered light respectively. The normal-state one particle propagator is given by , while in the superconducting state it can be written in a Nambu formalism:
| (5) | |||
| (8) |
Here we have introduced constant scattering rates and in the normal and superconducting states respectively.
The superconducting gap is given by , with . Since our aim is to study only the effect of the Fermi surface topology change and the associated van Hove singularity on the Raman response, we do not change with doping.
The Lifshitz transition in the AB band at the critical doping is clearly visible in the Raman response, since in this geometry one probes mainly the antinodal parts of the Fermi surface close to the and . The Raman-vertex-weighted density of states (defined in the main text) presents in this case a singularity at the chemical potential (see Fig. 3.(f), main text), and therefore the increases substantially and present a maximum at , see top panels of Fig. 10 (a) and (b). Instead, the does not present any singularity, since in this geometry one probes mainly the nodal regions of the Brillouin zone. Consequently the Raman response is not affected by the Lifshitz transition, and it displays little doping dependence.
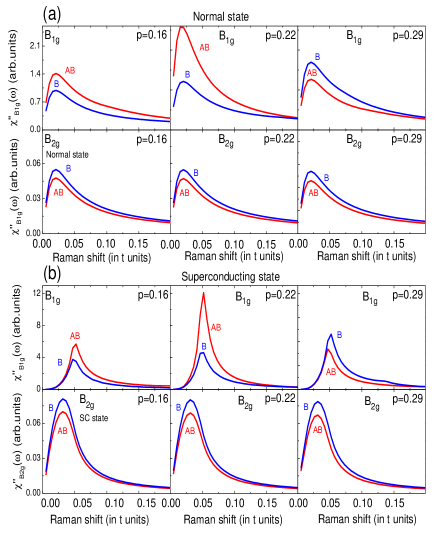
In this doping range the B band is far from its own Lifshitz transition, which would take place at a much higher doping which is inaccessible experimentally. Therefore, its contribution to the Raman response (blue/ dark gray) curves in Fig. 10) is less relevant than the AB band one (red/light gray) around .
For the sake of completeness in Fig. 11 we show the calculated ratio of the total integrated Raman intensities (defined in main text) for a doping range larger than what is accessible experimentally. Two peaks are clearly discernable, both in the normal and the superconducting cases, at and at , the first corresponding to the AB band Lifshitz transition, the second to that of the B band.
For clarity we also plot the for the AB and B bands separately, which shows that the contribution of each band peaks at its respective Lifshitz transition point.
In particular, as we previously stated, the B band contribution to the Raman response at doping is substantially smaller than the AB band one (while the converse is true at ). We also display in the top panels of Fig. 11 the Fermi surface in the first quadrant of the Brillouin zone. We clearly observe the change of topology from an hole- to electron-like Fermi surface in the AB and B bands, for and for respectively.
References
- Alloul et al. (1989) H. Alloul, T. Ohno, and P. Mendels, Phys. Rev. Lett. 63, 1700 (1989), URL http://link.aps.org/doi/10.1103/PhysRevLett.63.1700.
- Warren et al. (1989) W. W. Warren, R. E. Walstedt, G. F. Brennert, R. J. Cava, R. Tycko, R. F. Bell, and G. Dabbagh, Phys. Rev. Lett. 62, 1193 (1989), URL http://link.aps.org/doi/10.1103/PhysRevLett.62.1193.
- Imai et al. (1989) T. Imai, H. Yasuoka, T. Shimizu, Y. Ueda, K. Yoshimura, and K. Kosuge, Physica C: Superconductivity 162–164, Part 1, 169 (1989), ISSN 0921-4534, URL http://www.sciencedirect.com/science/article/pii/0921453489909714.
- Timusk and Statt (1999) T. Timusk and B. Statt, Reports on Progress in Physics 62, 61 (1999), URL http://stacks.iop.org/0034-4885/62/i=1/a=002.
- Norman et al. (2005) M. R. Norman, D. Pines, and C. Kallin, Advances in Physics 54, 715 (2005).
- Taillefer (2010) L. Taillefer, Annual Review of Condensed Matter Physics 1, 51 (2010), URL http://dx.doi.org/10.1146/annurev-conmatphys-070909-104117.
- Loram et al. (2001) J. Loram, J. Luo, J. Cooper, W. Liang, and J. Tallon, Journal of Physics and Chemistry of Solids 62, 59 (2001), ISSN 0022-3697, URL http://www.sciencedirect.com/science/article/pii/S0022369700001013.
- Shekhter et al. (2013) A. Shekhter, B. J. Ramshaw, L. R, H. W. N., B. D. A., B. F. F., R. D. McDonald, B. J. B., R. S. C., and M. A, Nature 498, 75 (2013), ISSN 0028-0836, URL http://dx.doi.org/10.1038/nature12165.
- Mangin-Thro et al. (2014) L. Mangin-Thro, Y. Sidis, P. Bourges, S. De Almeida-Didry, F. Giovannelli, and I. Laffez-Monot, Phys. Rev. B 89, 094523 (2014), URL http://link.aps.org/doi/10.1103/PhysRevB.89.094523.
- Fujita et al. (2014) K. Fujita, C. K. Kim, I. Lee, J. Lee, M. H. Hamidian, I. A. Firmo, S. Mukhopadhyay, H. Eisaki, S. Uchida, M. J. Lawler, et al., Science 344, 612 (2014), URL http://www.sciencemag.org/content/344/6184/612.abstract.
- He et al. (2014) Y. He, Y. Yin, M. Zech, A. Soumyanarayanan, M. M. Yee, T. Williams, M. C. Boyer, K. Chatterjee, W. D. Wise, I. Zeljkovic, et al., Science 344, 608 (2014).
- Liu et al. (2008) Y. H. Liu, Y. Toda, K. Shimatake, N. Momono, M. Oda, and M. Ido, Phys. Rev. Lett. 101, 137003 (2008), URL http://link.aps.org/doi/10.1103/PhysRevLett.101.137003.
- Daou et al. (2009) R. Daou, N. Doiron-Leyraud, D. LeBoeuf, S. Y. Li, F. Laliberte, O. Cyr-Choiniere, Y. J. Jo, L. Balicas, J.-Q. Yan, J.-S. Zhou, et al., Nat Phys 5, 31 (2009), ISSN 1745-2473, URL http://dx.doi.org/10.1038/nphys1109.
- Alloul et al. (2009) H. Alloul, J. Bobroff, M. Gabay, and P. J. Hirschfeld, Rev. Mod. Phys. 81, 45 (2009), URL http://link.aps.org/doi/10.1103/RevModPhys.81.45.
- Varma (1999) C. M. Varma, Phys. Rev. Lett. 83, 3538 (1999), URL http://link.aps.org/doi/10.1103/PhysRevLett.83.3538.
- Tallon and Loram (2001) J. Tallon and J. Loram, Physica C: Superconductivity 349, 53 (2001), ISSN 0921-4534, URL http://www.sciencedirect.com/science/article/pii/S0921453400015240.
- Sachdev (2010) S. Sachdev, Physica C: Superconductivity 470, Supplement 1, S4 (2010), ISSN 0921-4534, proceedings of the 9th International Conference on Materials and Mechanisms of Superconductivity, URL http://www.sciencedirect.com/science/article/pii/S0921453409007205.
- Sacuto et al. (2013) A. Sacuto, Y. Gallais, M. Cazayous, M.-A. Méasson, G. D. Gu, and D. Colson, Reports on Progress in Physics 76, 022502 (2013), URL http://stacks.iop.org/0034-4885/76/i=2/a=022502.
- Chatterjee et al. (2011) U. Chatterjee, D. Ai, J. Zhao, S. Rosenkranz, A. Kaminski, H. Raffy, Z. Li, K. Kadowaki, M. Randeria, M. R. Norman, et al., Proceedings of the National Academy of Sciences 108, 9346 (2011), URL http://www.pnas.org/content/108/23/9346.abstract.
- Vishik et al. (2012) I. M. Vishik, M. Hashimoto, R.-H. He, W.-S. Lee, F. Schmitt, D. Lu, R. G. Moore, C. Zhang, W. Meevasana, T. Sasagawa, et al., Proceedings of the National Academy of Sciences 109, 18332 (2012), URL http://www.pnas.org/content/109/45/18332.abstract.
- Kaminski et al. (2006) A. Kaminski, S. Rosenkranz, H. M. Fretwell, M. R. Norman, M. Randeria, J. C. Campuzano, J.-M. Park, Z. Z. Li, and H. Raffy, Phys. Rev. B 73, 174511 (2006), URL http://link.aps.org/doi/10.1103/PhysRevB.73.174511.
- Venturini et al. (2002a) F. Venturini, M. Opel, T. P. Devereaux, J. K. Freericks, I. Tütto, B. Revaz, E. Walker, H. Berger, L. Forró, and R. Hackl, Phys. Rev. Lett. 89, 107003 (2002a), URL http://link.aps.org/doi/10.1103/PhysRevLett.89.107003.
- Venturini et al. (2002b) F. Venturini, M. Opel, R. Hackl, L. Berger, H.and Forró, and B. Revaz, J. of Phys. Chem. of Solids 63, 2345 (2002b).
- Blanc et al. (2009) S. Blanc, Y. Gallais, A. Sacuto, M. Cazayous, M. A. Méasson, G. D. Gu, J. S. Wen, and Z. J. Xu, Phys. Rev. B 80, 140502 (2009), URL http://link.aps.org/doi/10.1103/PhysRevB.80.140502.
- Hewitt and Irwin (2002) K. C. Hewitt and J. C. Irwin, Phys. Rev. B 66, 054516 (2002), URL http://link.aps.org/doi/10.1103/PhysRevB.66.054516.
- Munnikes et al. (2011) N. Munnikes, B. Muschler, F. Venturini, L. Tassini, W. Prestel, S. Ono, Y. Ando, D. C. Peets, W. N. Hardy, R. Liang, et al., Phys. Rev. B 84, 144523 (2011), URL http://link.aps.org/doi/10.1103/PhysRevB.84.144523.
- Masui et al. (2003) T. Masui, M. Limonov, H. Uchiyama, S. Lee, S. Tajima, and A. Yamanaka, Phys. Rev. B 68, 060506 (2003), URL http://link.aps.org/doi/10.1103/PhysRevB.68.060506.
- Masui et al. (2009) T. Masui, T. Hiramachi, K. Nagasao, and S. Tajima, Phys. Rev. B 79, 014511 (2009), URL http://link.aps.org/doi/10.1103/PhysRevB.79.014511.
- Naeini et al. (1999) J. G. Naeini, X. K. Chen, J. C. Irwin, M. Okuya, T. Kimura, and K. Kishio, Phys. Rev. B 59, 9642 (1999), URL http://link.aps.org/doi/10.1103/PhysRevB.59.9642.
- Gasparov et al. (1998) L. V. Gasparov, P. Lemmens, N. N. Kolesnikov, and G. Güntherodt, Phys. Rev. B 58, 11753 (1998), URL http://link.aps.org/doi/10.1103/PhysRevB.58.11753.
- (31) The phonon peak contribution is less than 3% of the total integrated area.
- Kordyuk et al. (2003) A. A. Kordyuk, S. V. Borisenko, M. Knupfer, and J. Fink, Phys. Rev. B 67, 064504 (2003), URL http://link.aps.org/doi/10.1103/PhysRevB.67.064504.
- Buhmann and Sigrist (2013) J. M. Buhmann and M. Sigrist, Phys. Rev. B 88, 115128 (2013), URL http://link.aps.org/doi/10.1103/PhysRevB.88.115128.
- Konstantinović et al. (2000) Z. Konstantinović, Z. Z. Li, and H. Raffy, Phys. Rev. B 62, R11989 (2000), URL http://link.aps.org/doi/10.1103/PhysRevB.62.R11989.
- Chubukov (1998) A. V. Chubukov, EPL (Europhysics Letters) 44, 655 (1998), URL http://stacks.iop.org/0295-5075/44/i=5/a=655.
- Schmalian et al. (1998) J. Schmalian, D. Pines, and B. Stojković, Phys. Rev. Lett. 80, 3839 (1998), URL http://link.aps.org/doi/10.1103/PhysRevLett.80.3839.
- Ioffe and Millis (1998) L. B. Ioffe and A. J. Millis, Phys. Rev. B 58, 11631 (1998), URL http://link.aps.org/doi/10.1103/PhysRevB.58.11631.
- Chakravarty et al. (2001) S. Chakravarty, R. B. Laughlin, D. K. Morr, and C. Nayak, Phys. Rev. B 63, 094503 (2001), URL http://link.aps.org/doi/10.1103/PhysRevB.63.094503.
- Wang and Chubukov (2014) Y. Wang and A. Chubukov, Phys. Rev. B 90, 035149 (2014), URL http://link.aps.org/doi/10.1103/PhysRevB.90.035149.
- Comin et al. (2014) R. Comin, A. Frano, M. M. Yee, Y. Yoshida, H. Eisaki, E. Schierle, E. Weschke, R. Sutarto, F. He, A. Soumyanarayanan, et al., Science 343, 390 (2014), URL http://www.sciencemag.org/content/343/6169/390.abstract.
- da Silva Neto et al. (2014) E. H. da Silva Neto, P. Aynajian, A. Frano, R. Comin, E. Schierle, E. Weschke, A. Gyenis, J. Wen, J. Schneeloch, Z. Xu, et al., Science 343, 393 (2014), URL http://www.sciencemag.org/content/343/6169/393.abstract.
- Wu et al. (2014) T. Wu, H. Mayaffre, S. Krämer, M. Horvatić, C. Berthier, W. N. Hardy, R. Liang, D. A. Bonn, and M.-H. Julien (2014), eprint 1404.1617.
- Sebastian et al. (2014) S. E. Sebastian, N. Harrison, F. F. Balakirev, M. M. Altarawneh, P. A. Goddard, R. Liang, D. A. Bonn, W. N. Hardy, and G. G. Lonzarich, Nature 511, 61 (2014), ISSN 0028-0836, URL http://dx.doi.org/10.1038/nature13326.
- Pépin et al. (2014) C. Pépin, V. S. de Carvalho, T. Kloss, and X. Montiel (2014), eprint 1408.5908.
- Civelli et al. (2005) M. Civelli, M. Capone, S. S. Kancharla, O. Parcollet, and G. Kotliar, Phys. Rev. Lett. 95, 106402 (2005), URL http://link.aps.org/doi/10.1103/PhysRevLett.95.106402.
- Kyung et al. (2006) B. Kyung, S. S. Kancharla, D. Sénéchal, A.-M. S. Tremblay, M. Civelli, and G. Kotliar, Phys. Rev. B 73, 165114 (2006), URL http://link.aps.org/doi/10.1103/PhysRevB.73.165114.
- Ferrero et al. (2009) M. Ferrero, P. S. Cornaglia, L. De Leo, O. Parcollet, G. Kotliar, and A. Georges, Phys. Rev. B 80, 064501 (2009), URL http://link.aps.org/doi/10.1103/PhysRevB.80.064501.
- Sakai et al. (2013) S. Sakai, S. Blanc, M. Civelli, Y. Gallais, M. Cazayous, M.-A. Méasson, J. S. Wen, Z. J. Xu, G. D. Gu, G. Sangiovanni, et al., Phys. Rev. Lett. 111, 107001 (2013), URL http://link.aps.org/doi/10.1103/PhysRevLett.111.107001.
- Sordi et al. (2011) G. Sordi, K. Haule, and A.-M. S. Tremblay, Phys. Rev. B 84, 075161 (2011), URL http://link.aps.org/doi/10.1103/PhysRevB.84.075161.
- Ino et al. (2002) A. Ino, C. Kim, M. Nakamura, T. Yoshida, T. Mizokawa, A. Fujimori, Z.-X. Shen, T. Kakeshita, H. Eisaki, and S. Uchida, Phys. Rev. B 65, 094504 (2002), URL http://link.aps.org/doi/10.1103/PhysRevB.65.094504.
- Piriou et al. (2011) A. Piriou, N. Jenkins, C. Berthod, I. Maggio-Aprile, and O. Fischer, Nat Commun 2, 221 (2011), URL http://dx.doi.org/10.1038/ncomms1229.
- Peets et al. (2007) D. C. Peets, J. D. F. Mottershead, B. Wu, I. S. Elfimov, R. Liang, W. N. Hardy, D. A. Bonn, M. Raudsepp, N. J. C. Ingle, and A. Damascelli, New Journal of Physics 9, 28 (2007).
- Ando et al. (2004) Y. Ando, S. Komiya, K. Segawa, S. Ono, and Y. Kurita, Phys. Rev. Lett. 93, 267001 (2004), URL http://link.aps.org/doi/10.1103/PhysRevLett.93.267001.
- Andersen et al. (1995) O. Andersen, A. Liechtenstein, O. Jepsen, and F. Paulsen, Journal of Physics and Chemistry of Solids 56, 1573 (1995), ISSN 0022-3697, proceedings of the Conference on Spectroscopies in Novel Superconductors, URL http://www.sciencedirect.com/science/article/pii/0022369795002693.
- Wen et al. (2008) J. Wen, Z. Xu, G. Xu, M. Hücker, J. Tranquada, and G. Gu, Journal of Crystal Growth 310, 1401 (2008), ISSN 0022-0248, the Proceedings of the 15th International Conference on Crystal Growth (ICCG-15) in conjunction with the International Conference on Vapor Growth and Epitaxy and the {US} Biennial Workshop on Organometallic Vapor Phase Epitaxy, URL http://www.sciencedirect.com/science/article/pii/S0022024807007865.
- Mihaly et al. (1993) L. Mihaly, C. Kendziora, J. Hartge, D. Mandrus, and L. Forro, Review of Scientific Instruments 64, 2397 (1993), URL http://scitation.aip.org/content/aip/journal/rsi/64/8/10.1063/1.1144459.
- Presland et al. (1991) M. Presland, J. Tallon, R. Buckley, R. Liu, and N. Flower, Physica C: Superconductivity 176, 95 (1991), ISSN 0921-4534, URL http://www.sciencedirect.com/science/article/pii/0921453491907009.
- Devereaux and Hackl (2007) T. P. Devereaux and R. Hackl, Rev. Mod. Phys. 79, 175 (2007), URL http://link.aps.org/doi/10.1103/RevModPhys.79.175.
- Chubukov and Norman (2008) A. V. Chubukov and M. R. Norman, Phys. Rev. B 77, 214529 (2008), URL http://link.aps.org/doi/10.1103/PhysRevB.77.214529.