Galaxy pairs in the Sloan Digital Sky Survey - IX: Merger-induced AGN activity as traced by the Wide-field Infrared Survey Explorer.
Abstract
Interactions between galaxies are predicted to cause gas inflows that can potentially trigger nuclear activity. Since the inflowing material can obscure the central regions of interacting galaxies, a potential limitation of previous optical studies is that obscured Active Galactic Nuclei (AGNs) can be missed at various stages along the merger sequence. We present the first large mid-infrared study of AGNs in mergers and galaxy pairs, in order to quantify the incidence of obscured AGNs triggered by interactions. The sample consists of galaxy pairs and post-mergers drawn from the Sloan Digital Sky Survey that are matched to detections by the Wide Field Infrared Sky Explorer (WISE). We find that the fraction of AGN in the pairs, relative to a mass-, redshift- and environment-matched control sample, increases as a function of decreasing projected separation. This enhancement is most dramatic in the post-merger sample, where we find a factor of 10-20 excess in the AGN fraction compared with the control. Although this trend is in qualitative agreement with results based on optical AGN selection, the mid-infrared selected AGN excess increases much more dramatically in the post-mergers than is seen for optical AGN. Our results suggest that energetically dominant optically obscured AGNs become more prevalent in the most advanced mergers, consistent with theoretical predictions.
keywords:
Galaxies: interactions, galaxies: active, galaxies: evolution, galaxies: Seyfert1 Introduction
Based on the current cold dark matter cosmological framework, it is now well-established that galaxy interactions are ubiquitous and that they play a pivotal role in the formation and evolution of galaxies. From both a theoretical and observational perspective, galaxy interactions are undoubtedly responsible for enhanced nuclear star formation (e.g., Mihos & Hernquist , 1996; Larson & Tinsley , 1978; Sanders & Mirabel , 1996; Kennicutt et al., 1987; Perez et al. , 2006; Woods et al., 2006; Woods & Geller , 2007; Di Matteo et al. , 2007, 2008; Ellison et al., 2008; Cox et al., 2008; Smith & Struck , 2010; Patton et al., 2011; Liu et al. , 2012; Scudder et al. , 2012; Patton et al., 2013), and the formation of spheroids (e.g., Toomre, 1977; Lake & Dressler , 1986; Shier & Fischer , 1998; Rothberg & Joseph , 2006). A natural assumption from the tight correlation between central black hole mass and bulge velocity dispersion (e.g., Gebhardt et al., 2000) is that in addition to bulge growth, interactions trigger accretion onto a central supermassive black hole. However, despite over three decades of extensive research, it is still a topic of debate whether or not there is observational evidence for a causal connection between mergers and Active Galactic Nuclei (AGN), and, if so, how this connection depends on merger and host galaxy parameters. A number of studies have found evidence for mergers in luminous quasar hosts (e.g., Canalizo & Stockton, 2001; Bennert et al. , 2008; Urrutia et al. , 2008; Foreman, Volonteri & Dotti , 2009; Ramos Almeida et al., 2011; Bessiere et al. , 2012; Urrutia et al. , 2012), where the link to interactions is fairly well accepted. On the other hand, the connection to the less luminous AGN population remains controversial. In particular, studies that have looked for an excess of tidal features or distorted morphologies in AGN versus non-AGN galaxies, have found no statistical difference both at low (e.g., Gabor et al. , 2009; Reichard et al., 2009; Cisternas et al., 2011; Kocevski et al. , 2011; Bohm et al. , 2012), intermediate(0.5z0.8) (e.g., Villforth et al., 2014) and higher (z1) redshifts (e.g., Karouzos et al., 2014; Fan et al., 2014) . Conversely, studies of close pairs have found enhanced fractions of AGN (or accretion rates), which supports a link between mergers and nuclear activity (e.g., Alonso et al., 2007; Woods & Geller , 2007; Koss et al. , 2010; Ellison et al., 2011; Silverman et al. , 2011; Koss et al. , 2012; Liu et al. , 2012; Ellison et al. , 2013; Sabater et al. , 2013). This discrepancy may be due in part to the low surface brightness of tidal features and the time during the interaction at which they are expected to be visible (e.g. Lotz et al. , 2008). If the luminosity of the AGN is variable over a wide dynamic range on timescales shorter than the lifetime of merger signatures, any observed trends of merger fraction as a function of AGN luminosity will be weak, while the incidence of AGNs in merging galaxies will be still higher than in isolated systems (Hickox et al., 2014). Furthermore, since tidal features can be faint and appear only in the gas instead of the stars (e.g. Kuo et al., 2008), the sensitivity (e.g. Canalizo & Stockton, 2001; Ramos Almeida et al., 2011) and the wavelength (e.g., Hancock et al., 2007; Boselli et al., 2005) of the observations may play a role in identifying merger signatures in AGN hosts. However, an alternative way of reconciling the apparently conflicting results is if mergers can trigger AGN, but the majority of AGN are not produced through an interaction (e.g. Draper & Ballantyne , 2012).
It is now well-known that observations in only one waveband cannot provide a complete census of AGNs in galaxy samples due to obscuration of the central source or contamination of the observed emission by the host galaxy (e.g. Satyapal et al., 2008; Goulding & Alexander, 2009; Hickox et al., 2009; Donley et al., 2010; Juneau et al., 2013). Although AGN excesses in samples of galaxy pairs have been found at optical, radio and X-ray wavelengths (e.g., Woods & Geller , 2007; Koss et al. , 2010; Silverman et al. , 2011; Koss et al. , 2012; Liu et al. , 2012; Sabater et al. , 2013), a direct comparison of these selection techniques has not been previously performed, and we have little understanding of what the complete census of merger-induced AGN might be. In our previous work on galaxy pairs and post-mergers in the Sloan Digital Sky Survey, we have used optical emission line diagnostics to identify an enhanced AGN fraction relative to a control that increases with decreasing pair separations (Ellison et al., 2011) and peaks post-coalescence (Ellison et al. , 2013). However, since the centres of interacting galaxies may be more obscured than isolated galaxies, a potential limitation of this and previous optical studies, is that obscured AGNs can be missed at various stages along the merger sequence (Goulding et al., 2012). In such cases, mid-infrared observations are a powerful tool for finding optically obscured AGNs. While there have been a number of mid-infrared studies of interacting galaxies, virtually all past studies have employed small samples of galaxies and/or have targeted the most advanced stage mergers (e.g., Genzel et al., 1998; Veilleux et al., 2009; Armus et al., 2007, 2009; Farrah et al., 2007; Petric et al., 2011). The all-sky survey carried out by the Wide-field Infrared Survey Explorer (WISE) (Wright et al., 2010) has opened up a new window in the search for optically hidden AGNs in a large number of galaxies. This is because hot dust surrounding AGNs produces a strong mid-infrared continuum and infrared spectral energy distribution (SED) that is clearly distinguishable from star forming galaxies in both obscured and unobscured AGNs (e.g. Lacy et al., 2004; Stern et al., 2005; Donley et al., 2007; Stern et al., 2012). The WISE survey enables a more statistically significant study of the optically obscured AGN population in interacting galaxies.
The goal of this paper is to complement our previous optical AGN study of SDSS galaxy pairs with a measurement of the incidence of obscured AGN, using mid-infrared colour selection with WISE. This is the first large mid-infrared study of galaxy pairs. In Section 2 we describe the selection of our samples of galaxy pairs, post-mergers, and their matched controls. In Section 3, we discuss our WISE AGN classification criteria, followed in Section 4 by a discussion of the fidelity of our WISE photometry for close pairs. in Section 5, we determine the mid-infrared colour-selected AGN fraction in the merger samples using WISE compared to the control sample. In Section 6 we discuss other causes of red WISE colours, followed by a summary of our results in Section 7. Throughout the manuscript we adopt a cosmology with = 70 km s-1, and =0.7.
2 Sample Selection
The galaxy merger sample is based on a combination of close spectroscopic galaxy pairs and visually classified post-mergers, which represent the early and late stages of galaxy interactions, respectively. The sample is described in detail in Ellison et al. (2013). In brief, the pairs sample is constructed from the SDSS DR7 Main Galaxy Sample (14.0 17.77) with a redshift range and spectroscopically classified as a galaxy (specclass=2). We require projected separations of 80 kpc, relative velocities of V 300 km s-1 and ratios of stellar mass taken from Mendel et al. (2014) of 0.25 M1/M2 4. Culling of wide separation pairs accounts for fibre collisions (Ellison et al., 2008; Patton & Atfield , 2008). We note that not all paired galaxies show visible signs of interacting, and many may never merge. The sample of visually classified post-mergers is initially drawn from the Galaxy Zoo (Lintott et al. , 2008) catalogue presented by Darg et al. (2010), with further visual inspection and refinement by Ellison et al. (2013). For convenience, we will refer collectively to the pairs and the post-mergers as the ‘merger’ sample.
The merger sample is matched to the public final all-sky WISE source catalogue111http://wise2.ipac.caltech.edu/docs/release/allsky/, where a galaxy is considered ‘matched’ if the positions agree to within 6 arcseconds (the resolution of WISE)222The conclusions in this paper are unchanged if a more strict matching criterion of 2 arcseconds is used, although the statistics are slightly poorer.. For the majority of this paper, we will use the 3.4 m and 4.6m bands (W1 and W2 respectively) to classify AGN. We therefore additionally require that WISE matches to SDSS galaxies are detected at better than 5 in each of these two bands. After WISE matching, we are left with 80 post-mergers and 5026 galaxies in the pairs sample.
In order to compare the merger sample to a control sample, we follow the procedure described in Ellison et al. (2013). In brief, every galaxy that is matched to a WISE source and has no spectroscopic companion within 80 kpc and a relative velocity within 10,000 km s-1, and has a Galaxy Zoo merger vote fraction = 0, is considered as part of a control ‘pool’. There are 204, 596 galaxies in the control pool. For a given galaxy in the merger sample, we compile a set of controls that are matched in stellar mass, redshift and local environment. This latter parameter is defined as
| (1) |
where is the projected distance in Mpc to the nearest neighbour within 1000 km s-1. Normalized densities, , are computed relative to the median within a redshift slice 0.01. Following our previous work, we adopt . The tolerances for matches are 0.1 dex in stellar mass, 0.005 in redshift and 0.1 dex in . If less than 5 matches are found for a given merger galaxy, the tolerance is grown by 0.005 in redshift, 0.1 dex in stellar mass and 0.1 dex in normalized local density until the required number of matches is achieved. In practice, several hundred control galaxies are typically matched to each merging galaxy, without the need for extending the baseline tolerances.
3 Selection of AGNs by WISE
Extensive efforts over the past decade have demonstrated the power and reliability of mid-infrared observations in discovering optically hidden AGNs (e.g., Lacy et al., 2004; Stern et al., 2005; Donley et al., 2007; Hickox et al., 2007; Donley et al., 2008; Eckart et al., 2010; Stern et al., 2012; Mateos et al., 2013). This is because hot dust surrounding AGNs produces a strong mid-infrared continuum and infrared SED that is clearly distinguishable from normal star-forming galaxies for both obscured and unobscured AGNs in galaxies where the emission from the AGN dominates over the host galaxy emission (e.g. Donley et al., 2007; Stern et al., 2012; Mateos et al., 2013). In particular, at low redshift, the (3.4 m) - (4.6 m) colour of galaxies dominated by AGNs is considerably redder than that of inactive galaxies (see Figures 1 in Stern et al., 2012; Assef et al., 2013). At higher redshifts ( z 1.5) the host galaxy becomes red across these bands but becomes undetectable by WISE.
There are several WISE colour diagnostics that have been employed in the literature to select AGNs. Based on the Spitzer-WISE COSMOS data, Stern et al. (2012) show that a mid-infrared colour cut of robustly identifies AGNs previously identified by Spitzer with a reliability of 95%. However, at redshifts below 0.2, even the most extreme star forming templates from Assef et al. (2013), have colour well below 0.5. In this work, we adopt a robust colour cut of to identify AGNs. Given that the redshifts of the galaxies in our pairs sample are less than 0.2, we also discuss the results with a more inclusive colour cut of and demonstrate that our results are qualitatively unchanged.
We emphasize that while mid-IR colour selection is sensitive to the optically obscured AGN population and can also select unobscured AGNs, it is sensitive only to AGNs that dominate over the host galaxy emission that are efficiently accreting (e.g., Gürkan et al., 2014). Based on the templates from Assef et al. (2010), the colour drops below 0.8 when the host galaxy emission exceeds 50% of the total galaxy light. When the host galaxy contamination of the mid-infrared emission is large, the colour cut adopted here will not select the AGN. This effect is born out observationally in recent studies that show that the fraction of optically and X-ray identified AGNs identified by WISE is highest for the most luminous AGNs (based on X-ray or [OIII] luminosity) and drops considerably with decreasing AGN luminosity (e.g., Mateos et al., 2013; Rovilos et al., 2013)
4 The fidelity of WISE colours in close pairs
The analysis presented in this paper relies on the measurement of colours in close pairs of galaxies. As we have previously found for the SDSS photometry, contamination from the companion becomes problematic at small angular separations (Simard et al., 2011). Since WISE has an even lower spatial resolution that the SDSS (6.1 and 6.4 arcsec in the W1 and W2 bands used in this work), we might expect blending to also affect the WISE photomerty.
We investigate the possible effects of contamination by utilizing Spitzer Infrared Array Camera (IRAC) observations that cover very similar wavelength ranges to the W1 and W2 bands, but whose spatial resolution is 1.7 arcsec in the bands considered here. We use data from the Spitzer Deep Wide-Field Survey (SDWFS; Ashby et al. (2009)), who performed deep observations with IRAC over 8 deg2 in the Boötes multiwavelength survey area. We select bright SDWFS sources with , 1 magnitude fainter than the typical WISE limit used in this study, and therefore the flux above which contamination may be significant. We do not include IRAC sources near bright stars and other areas of bad IRAC photometry (e.g., Hickox et al., 2011). We match the WISE All-Sky Survey source positions to these bright IRAC sources, with a matching radius of 2″, and compare the WISE colours to the colours of the matched IRAC sources. To accurately compare the colours, we correct for a known colour dependence in the difference between WISE and IRAC photometry 333http://wise2.ipac.caltech.edu/docs/release/allsky/expsup/. For the sources in our sample, red objects () have colours such that and , and we apply these corresponding offsets to the observed IRAC magnitudes.We further calculate the distance from each matched IRAC source to the closest other bright source in the SDWFS catalogue; for closer IRAC pairs (particularly within 10″) we may expect stronger contamination of the observed WISE flux from the companion source.
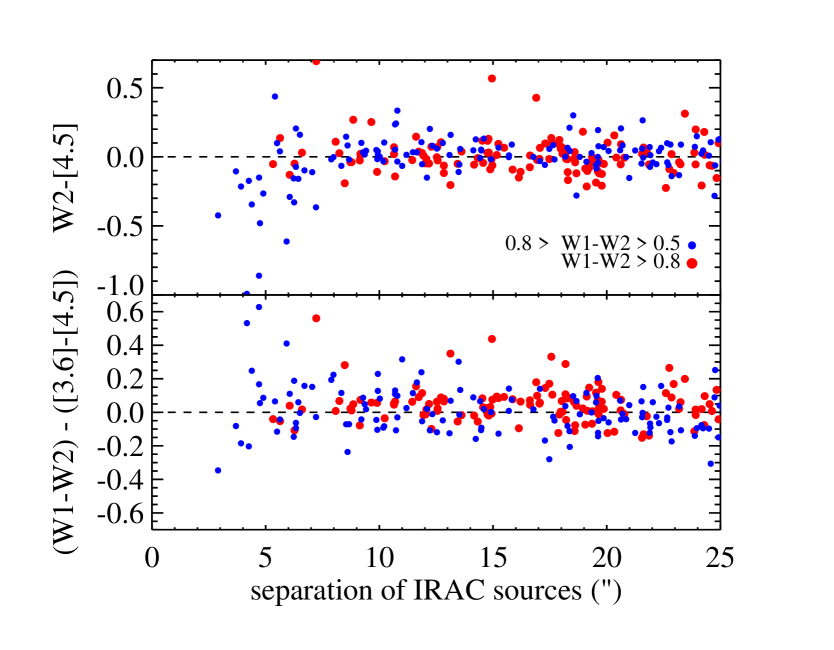
The contamination in the WISE photometry is demonstrated in the top panel of Figure 1, which shows the difference between the WISE W2 and IRAC [4.5] magnitudes for AGN candidates as a function of distance from the matched IRAC source to the nearest bright () IRAC source. AGN candidates with and are marked with red and blue symbols, respectively. For large IRAC pair separations the average . For separations below 10″, the WISE flux becomes increasingly brighter than the flux of the matched IRAC source, by up to 0.5-1 mag, indicating that blending of the two IRAC sources contaminates the WISE fluxes.
However, if we examine the difference in WISE and IRAC colours as a function of IRAC separation (bottom panel of Figure 1), there is no significant change in the average colour difference even to small separations ″, and only a small increase in the number of outliers; for 366 IRAC sources in pairs with separation , the dispersion in the colour differences () is only slightly larger than that for all separations (0.17). Of these IRAC sources with close companions, 15 have WISE colours consistent with AGN (; see Section 3), and in 13 cases, the matched IRAC source would have been identified as an AGN based on the (Stern et al., 2005) criterion. We therefore conclude that for close pairs of mid-IR sources, contamination of WISE photometry due to unresolved mid-IR companions has a small but relatively unimportant effect on the selection of AGNs based on observed WISE colours.
In addition to the tests described above, two other observational factors mitigate the susceptibility of our conclusions to contamination. First, whilst previous studies of the optical colours of close pairs have shown an effect in the mean values (Patton et al., 2011), we will quantify the fraction of galaxies with colours above a certain threshold. The small magnitude of colour changes is unlikely to shift a large number of galaxies from the star-forming to AGN class; there is at least 0.2 mags difference between these two classes in W1 – W2 colour space. Second, even if we exclude pairs with angular separations 5 arcsec, our basic result remains unchanged. This is largely thanks to the inclusion of post-mergers in our sample, giving us a data point that probes the final stage of the interaction without being susceptible to contamination from a near neighbour.
5 WISE AGN fraction in the merger sample
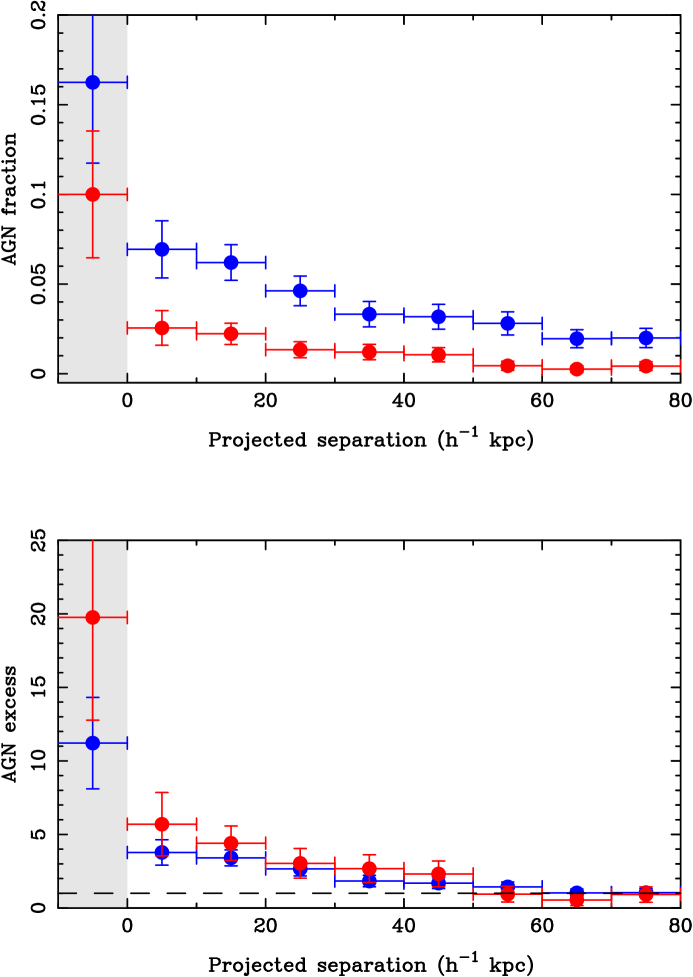
Applying a WISE colour criteria of to identify WISE-AGNs in our merger samples, we find that 52 of 5026 (1%) paired galaxies and 7 of 80 (9%)post-mergers are WISE-AGNs, compared with 0.5% the corresponding matched controls. In Figure 2, we plot the AGN fraction and the AGN excess, which is the fraction of AGNs in the pairs sample relative to their controls, as a function of pair separation . There is a steady increase in the AGN excess with decreasing pair separations for galaxies at separations less than 50 kpc with a dramatic increase seen in the post-merger sample (shaded region in Figure 2). Since the redshift range of our sample is low, and the colour cut of only selects the most energetically dominant AGNs (see Section 3), we also repeat the calculation for the less stringent colour cut of (blue points in figure). As can be seen, the AGN excess is replicated using both colour cuts, with a moderately higher excess seen with the more stringent colour cut (red points in figure). Indeed, in the post-merger bin, AGNs with are 20 times more frequent than their matched control sample, compared to an excess of 11 obtained with the AGNs. Since the mid-infrared colour of galaxies increases as the AGN contribution to the galaxy light increases, the larger AGN excess seen with the more stringent colour cut, most notably in the post-merger sample, is likely due to an increase in the AGN contribution to the total galaxy light.
5.1 Comparison with Optical AGN
We compared the WISE AGN selection with optical emission line selection using the [NII]/H versus [OIII]/H, line ratios using the widely-adopted BPT diagram (Baldwin, Phillips & Terlevich 1981). In Figure 3, we plot the optical BPT diagram for the pairs and post-merger samples. Only those galaxies with all four emission lines detected with a signal to noise are included. Using the classification scheme from Kewley et al. (2001), there are 200 optically identified AGNs in the pairs sample, of which 175 are not identified as AGN using the colour cut. This number reduces to 138 with the less stringent colour cut.
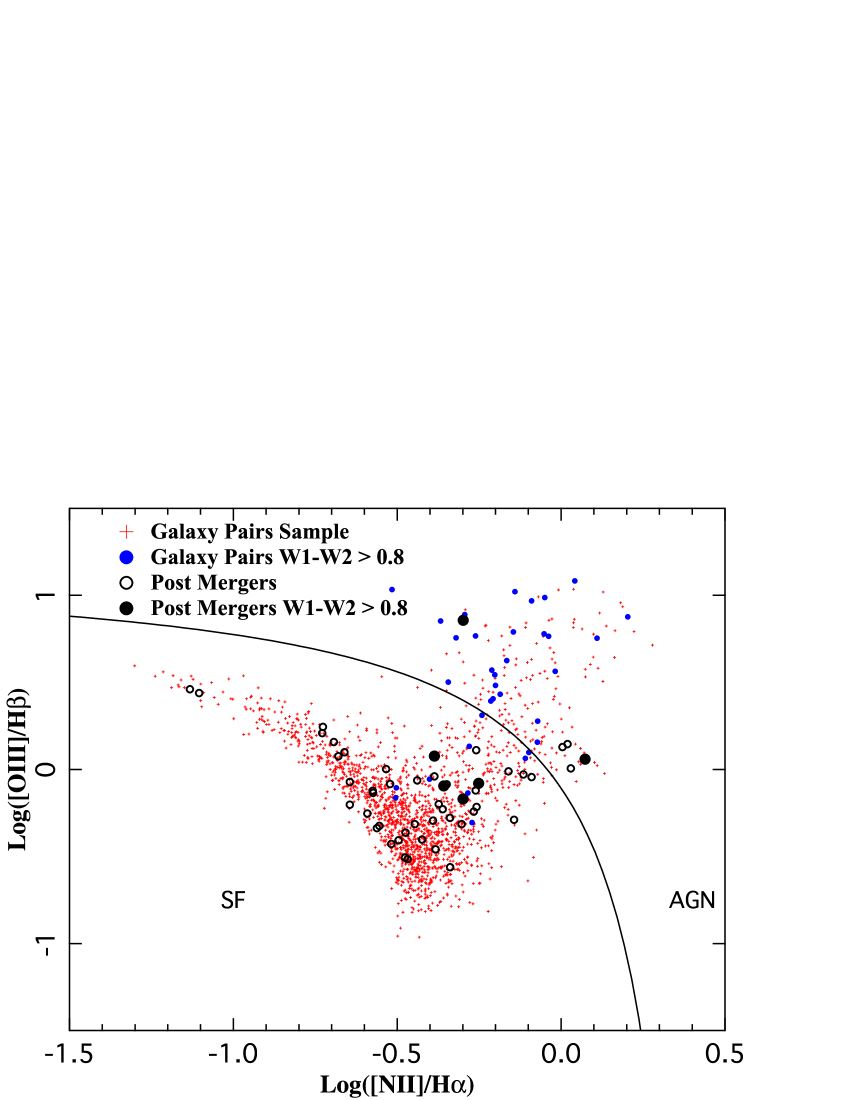
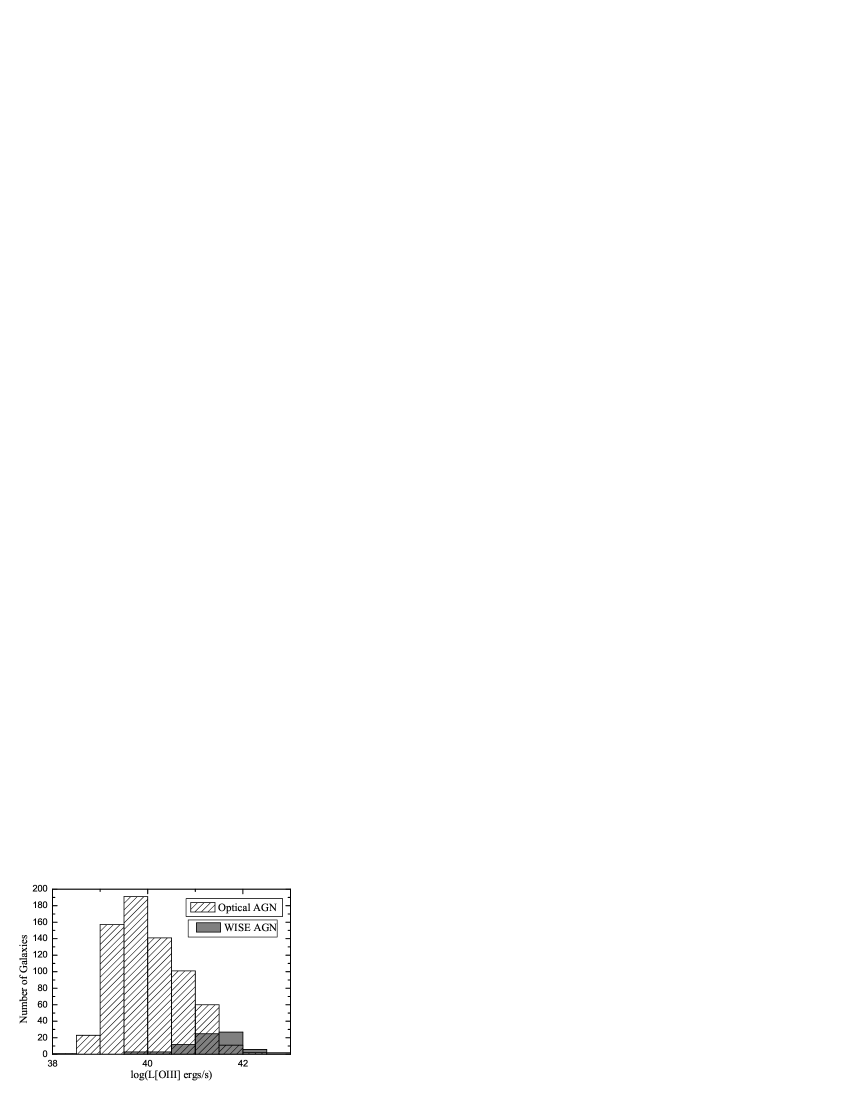
It is clear that WISE selects a different population of AGNs than does the optical emission line diagnostics. As pointed in Section 4, mid-infrared colour selection identifies AGNs when the AGN dominates the host galaxy emission. This is reinforced by several studies that have shown that the fraction of optically selected AGNs identified as AGNs by mid-IR colour selection increases with AGN luminosity (e.g., Rovilos et al., 2013; Mateos et al., 2013; Yan et al., 2013) . We find a similar trend with WISE AGN fraction and AGN luminosity for the optically classified AGNs in our pairs sample. For the optical AGN in our pairs sample we used the [OIII] 5007 emission line as an indicator of the luminosity of the AGN. The [OIII] 5007 line is found to be well correlated with the AGN bolometric luminosity in optically classified AGNs (Heckman et al., 2004). As seen in Figure 4 the optical AGNs that are WISE AGNs tend to have higher [OIII] luminosities than optical AGN that are not WISE AGN. The most luminous AGNs in the sample are all identified as WISE AGNs. For [OIII] luminosities greater than 1042 ergs s-1 we find that 60% of the optical AGN are identified as WISE AGN. For luminosities between 1041 and 1042 ergs s-1, the WISE AGN fraction drops to 16% and to 1% for [OIII] luminosities less than 1041 ergs s-1. Based on this analysis, WISE colour selection identifies the more powerful AGNs in our samples.
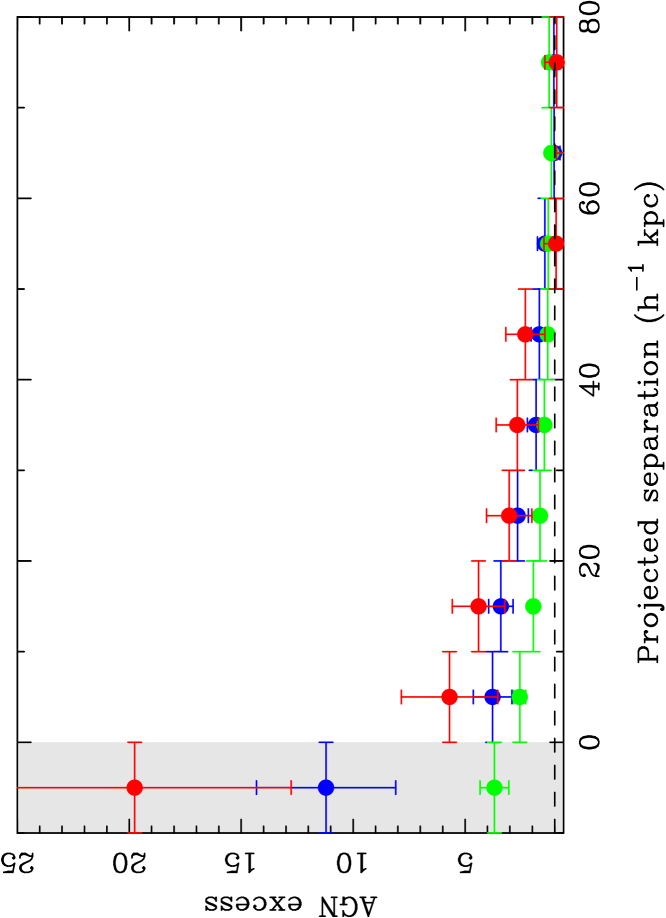
In Figure 5 we compare the excess of merger AGN classified by WISE, to the excess determined from optical emission lines, as presented by Ellison et al. (2013). The optical classification uses the diagnostic of Stasinska et al. (2006) which is sensitive to even modest contributions from an AGN. It should be noted that, as with any criterion for AGN classification, the exact AGN fraction depends sensitively on diagnostic choice. For optical classifications, the choice of emission line S/N threshold also plays a role (Ellison et al., 2011). Comparing the exact fractions of AGN between the WISE and optical classifications is therefore not instructive. However, a comparison of the AGN excess in the optical and WISE samples as a function of projected separation can tell us about the evolving properties of merger-induced AGN as a function of interaction stage.
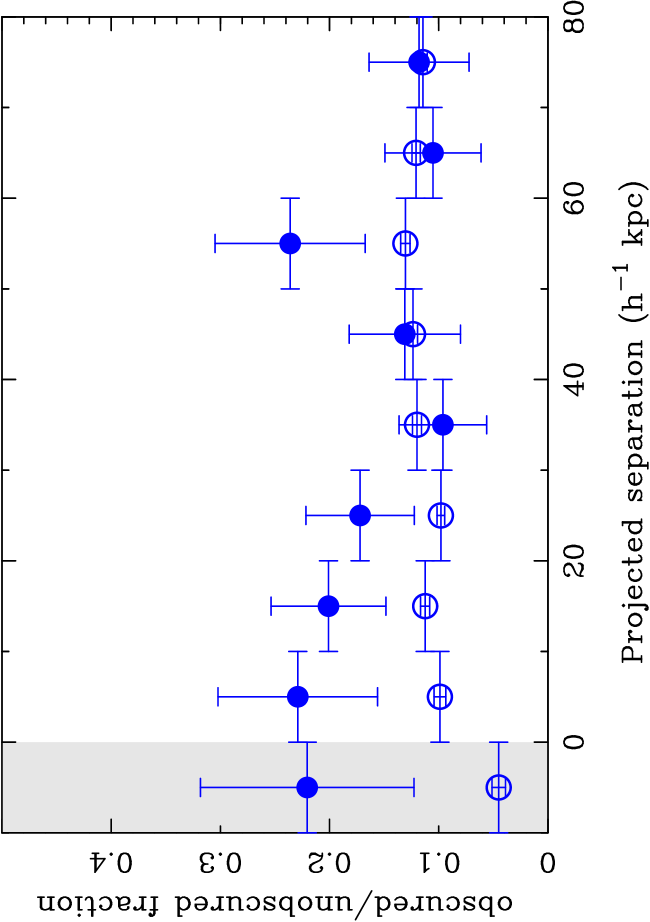
As can be seen from Figure 5, the trend of increasing WISE-AGN excess with decreasing pair separation, peaking in the post-merger sample, is in qualitative agreement with results based on optical AGN selection. However, the AGN excess based on infrared colour selection is significantly larger than the AGN excess based on optical spectroscopic diagnostics for the galaxy pairs at the smallest pair separations, with the most dramatic discrepancy seen in the post mergers. This is most extreme for the more stringent colour cut, which selects the most energetically dominant AGNs. This plot implies that the AGNs are more energetically dominant with decreasing pair separation. In Figure 6, we plot the ratio of the fraction of galaxies that are identified as AGNs only with WISE to the fraction of galaxies that are optical AGNs in the pairs (solid symbols) compared with the matched controls (open symbols) as a function of pair separation. Since we have demonstrated that the observed trends are reproduced using both colour cuts discussed in this paper, for this figure we adopt a colour cut to improve the signal to noise of the plot. Note that WISE identifies AGNs only if they are energetically dominant regardless of whether or not they are obscured in the optical (Stern et al., 2012). However, if a galaxy is selected as an AGN with WISE but optically unidentified as an AGN, its broad and narrow line regions are optically obscured. Figures 5 and 6 therefore together imply that the AGNs are : 1) more energetically dominant and 2) more heavily obscured over large scales with decreasing pair separation. Theory predicts that as a merger progresses, gravitational instabilities cause large radial gas inflows toward the nuclear regions. This inflowing material can potentially obscure both the narrow and broad line regions of AGNs, causing any putative AGN to be unidentified at optical wavelengths. These numerical simulations show that multiple gas inflow epochs along the merger sequence occur, with enhanced nuclear accretion in the most advanced mergers, just prior to coalescence (e.g., Mihos & Hernquist, 1996; Cox et al., 2006; Barnes & Hernquist, 1996; Cox et al., 2008). Our results are consistent with these theoretical predictions, suggesting that AGNs are both more obscured and more energetically dominant in the most advanced mergers.
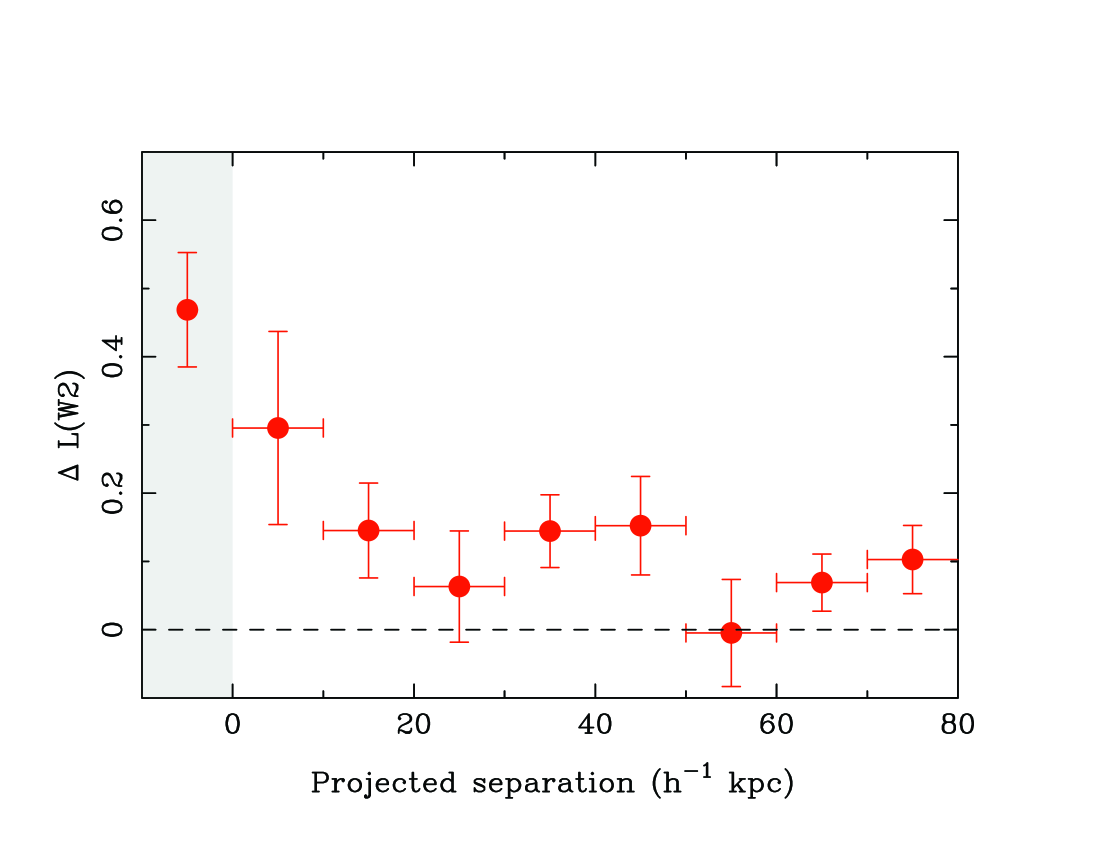
To investigate further the effect of a merger on the AGN luminosity we determined the excess W2 band luminosities of our pairs and post-merger sample WISE-AGN compared to a matched control sample of WISE-AGN. In galaxies dominated by an AGN, the W2 luminosity is well-correlated with the AGN bolometric luminosity (Richards et al., 2006). In order to calculate the AGN contribution in mergers, relative to that in isolated AGN, we repeated the control matching process, but now only match control galaxies that are also classified as AGN, according to our WISE colour criterion. We can now compare the properties of merger-induced AGN with control AGN. Using the luminosity in the W2 band 444http://wise2.ipac.caltech.edu/docs/release/allsky/expsup/ , we compute the offset between the merger and control AGN luminosities as
| (2) |
where is the median luminosity of all controls matched to a given merging galaxy. Figure 7 shows the enhancement in the W2 band luminosity of the pairs and post-merger galaxies. In order to improve the signal to noise of the plot, we have adopted the colour cut. The AGNs in galaxy pairs show a significant enhancement of W2 band luminosity out to 80 kpc, which is the widest separation in our sample, with an enhancement of a factor of 2 for pairs separated by less than 10 kpc .The post-mergers show a clear enhancement of W2 luminosity by a factor of 3. This is consistent with the results from (Ellison et al. , 2013) which show a similar trend using the [OIII] luminosity of optical AGN indicative of enhanced black hole accretion rate for close pairs and post-mergers over isolated galaxies.
6 Other Causes of Red WISE Colours
Ultra-luminous infrared galaxies (ULIRGs) are defined to have a total infrared luminosity log L L⊙, with their lower luminosity cousins, the luminous infrared galaxies (LIRGs) a factor of 10 less luminous. ULIRGs may also produce red W1-W2 colours (Wright et al., 2010) and therefore may be misclassified as an AGN, although many ULIRGs may also host obscured AGNs (Veilleux et al., 2009). We matched our pairs sample to the 1 Jy sample, a flux-limited sample of ULIRGs from Kim & Sanders (1998),and we found only 1 match. ULIRGs are almost exclusively advanced mergers (Sanders & Mirabel , 1996; Veilleux et al., 2009). The low incidence of ULIRGs in our pairs sample is a consequence of the deficiency of very close pairs in the sample. The results from this matching procedure are in good agreement with Ellison et al. (2013), who studied the fraction of LIRGs in the close pairs sample. Although the fraction of LIRGs was found to increase with decreasing projected separation, and the fraction of galaxies in pairs found to increase with increasing LIR, only 1 ULIRG was identified in the pairs sample. A sub-sample of 74 ULIRGs from Veilleux et al. (2009) reveal that over half of the ULIRGs have separations of less than 3 kpc and 86% have separations less than 10kpc. In contrast only 3% of our pairs sample have separations less than 10kpc with none less than 3kpc. Therefore the fraction of WISE AGN in our pairs sample is not significantly affected by the presence of ULIRGs with red W1-W2 colours.
7 Summary
We have conducted a mid-infrared study aimed at finding obscured AGNs using WISE matched to a large sample of galaxy pairs and post-mergers selected from the SDSS. This is the first mid-infrared investigation of a large sample of galaxy pairs. Our main results can be summarized as follows:
-
1.
We find a higher fraction of AGNs in galaxy pairs compared to a carefully constructed control sample of isolated galaxies matched in redshift, mass and local environment for pair separations less than 50 kpc .
-
2.
The excess in the AGN fraction over the matched control increases with decreasing pair separation. The excess is most dramatic in the post-merger sample, where we find a factor of 10-20 excess in the AGN fraction compared to the control, depending on the adopted colour threshold.
-
3.
The trend of increasing infrared selected AGN fraction with decreasing pair separation, peaking in the post-merger sample, is in qualitative agreement with results based on AGN selection obtained from optical emission line diagnostics. However, the AGN excess based on infrared colour selection is significantly larger than the AGN excess based on optical spectroscopic diagnostics for the galaxy pairs at the smallest pair separations, with the most dramatic discrepancy seen in the post mergers. Our results imply that AGNs are both more energetically dominant and obscured with decreasing pair separation, as expected based on theoretical predictions.
-
4.
The AGNs in galaxy pairs show a significant enhancement of W2 band luminosity compared to their matched control out to at least 80 kpc, and is largest (by a factor of 3) for the post-mergers. This is consistent with the results from (Ellison et al. , 2013) which show a similar trend using the [OIII] luminosity of optical AGN indicative of enhanced black hole accretion rate for close pairs and post-mergers over isolated galaxies.
Acknowledgments
SS and WM gratefully acknowledge support from NASA grant NNX12AH53G for this project. SLE and DRP acknowledge the receipt of NSERC Discovery grants which funded this research. RCH was partially supported by NASA through ADAP award NNX12AE38G and by the National Science Foundation through grant number 1211096. This paper benefited greatly from insightful discussions with Jessica Rosenberg and Nathan Secrest. We thank the referee for carefully reading the draft and providing comments that improved this paper.
This publication makes use of data products from the Wide-field Infrared Survey Explorer, which is a joint project of the University of California, Los Angeles, and the Jet Propulsion Laboratory/California Institute of Technology, funded by the National Aeronautics and Space Administration.
Funding for the SDSS and SDSS-II has been provided by the Alfred P. Sloan Foundation, the Participating Institutions, the National Science Foundation, the U.S. Department of Energy, the National Aeronautics and Space Administration, the Japanese Monbukagakusho, the Max Planck Society, and the Higher Education Funding Council for England. The SDSS Web Site is http://www.sdss.org/.
The SDSS is managed by the Astrophysical Research Consortium for the Participating Institutions. The Participating Institutions are the American Museum of Natural History, Astrophysical Institute Potsdam, University of Basel, University of Cambridge, Case Western Reserve University, University of Chicago, Drexel University, Fermilab, the Institute for Advanced Study, the Japan Participation Group, Johns Hopkins University, the Joint Institute for Nuclear Astrophysics, the Kavli Institute for Particle Astrophysics and Cosmology, the Korean Scientist Group, the Chinese Academy of Sciences (LAMOST), Los Alamos National Laboratory, the Max-Planck-Institute for Astronomy (MPIA), the Max-Planck-Institute for Astrophysics (MPA), New Mexico State University, Ohio State University, University of Pittsburgh, University of Portsmouth, Princeton University, the United States Naval Observatory, and the University of Washington.
References
- Alonso et al. (2007) Alonso, M. S., Lambas, D. G., Tissera, P. B., Coldwell, G., 2007, MNRAS, 375, 1017
- Armus et al. (2007) Armus L. et al., 2007, ApJ, 656, 148
- Armus et al. (2009) Armus L. et al., 2009, PASP, 121, 559
- Ashby et al. (2009) Ashby, M. L. N., Stern, D., Brodwin, M., et al., 2009, ApJ, 701, 428
- Assef et al. (2010) Assef, R. J., et al., 2010, ApJ, 713, 970
- Assef et al. (2013) Assef, R. J., et al., 2013, Apj, 772, 26
- Baldwin et al. (1981) Baldwin, J. A., Phillips, M. M., Terlevich, R., 1981, PASP, 93, 5
- Barnes & Hernquist (1996) Barnes, J. E. & Herquist, L. 1996, ApJ, 471, 115
- Bennert et al. (2008) Bennert, N., Canalizo, G., Jungwiert, B., Stockton, A., Schweizer, F., Peng, C. Y., Lacy, M., 2008, ApJ, 677, 846
- Bessiere et al. (2012) Bessiere, P. S., Tadhunter, C. N., Ramos Almeida, C., Villar Martin, M., 2012, MNRAS, 426, 276
- Bohm et al. (2012) Bohm, A., et al., 2013, A&A, 549, 46
- Boselli et al. (2005) Boselli, A., et al., 2005, ApJ, 623, L13
- Canalizo & Stockton (2001) Canalizo, G., Stockton, A., 2001, ApJ, 555, 719
- Cisternas et al. (2011) Cisternas, M., et al., 2011, ApJ , 726, 57
- Cox et al. (2006) Cox T. J., Jonsson P., Primack J. R., Somerville R. S., 2006, MNRAS, 373, 1013
- Cox et al. (2008) Cox, T. J., Jonsson, P., Somerville, R. S., Primack, Joel R., Dekel, A., 2008, MNRAS, 384, 386
- Dahari (1985) Dahari, O., 1985, AJ, 90, 1772
- Darg et al. (2010) Darg, D. W., et al., 2010, MNRAS, 401, 1043
- Di Matteo et al. (2007) Di Matteo, P., Combes, F., Melchior, A.-L., Semelin, B., 2007, A&A, 468, 61
- Di Matteo et al. (2008) Di Matteo, P., Bournaud, F., Martig, M., Combes, F., Melchior, A.-L., Semelin, B., 2008, A&A, 492, 31
- Donley et al. (2007) Donley, J. L., Rieke, G. H., Pérez-González, P. G., Rigby, J. R., & Alonso-Herrero, A. 2007, ApJ, 660, 167
- Donley et al. (2008) Donley, J. L., Rieke, G. H., Pérez-González, P. G., & Barro, G. 2008, ApJ, 687, 111
- Donley et al. (2010) Donley, J. L., Rieke, G. H., Alexander, D. M., Egami, E., & Pérez-González, P. G. 2010, ApJ, 719, 1393
- Draper & Ballantyne (2012) Draper, A. R., Ballantyne, D. R., 2012, ApJ, 751, 72
- Eckart et al. (2010) Eckart, M. E., McGreer, I. D., Stern, D., Harrison, F. A., & Helfand, D. J. 2010, ApJ, 708, 584
- Ellison et al. (2013) Ellison, S. L., Mendel, J. T., Patton, D. R., Scudder, J. M., 2013a, MNRAS, 435, 3627
- Ellison et al. (2013) Ellison, S. L., Mendel, J. T., Scudder, J. M., Patton, D. R., Palmer, M. J. D., 2013b, MNRAS, 430, 3128
- Ellison et al. (2011) ApJ Ellison, S. L., Patton, D. R., Mendel, J. T., Scudder, J. M., 2011, MNRAS, 418, 2043
- Ellison et al. (2008) Ellison, S. L., Patton, D. R., Simard, L., McConnachie, A. W., 2008, AJ 135, 1877
- Fan et al. (2014) Fan, L., Fang, G., Chen, Y., et al. 2014, ApJ, 784, L9
- Farrah et al. (2007) Farrah D. et al., 2007, ApJ, 667, 149
- Ferrarese & Merritt (2000) Ferrarese, L., & Merritt, D., 2000, ApJ, 539, L9
- Foreman, Volonteri & Dotti (2009) Foreman, G., Volonteri, M., Dotti, M., 2009, ApJ, 693, 1554
- Gabor et al. (2009) Gabor, J. M., et al., 2009, ApJ, 691, 705
- Gebhardt et al. (2000) Gebhardt, K., et al., 2000, ApJ, 539, L13
- Genzel et al. (1998) Genzel R., et al., 1998, ApJ, 498, 579
- Goulding & Alexander (2009) Goulding, A. D., & Alexander, D. M. 2009, MNRAS, 398, 1165
- Goulding et al. (2012) Goulding, A. D., Alexander, D. M., Bauer, F. E., et al. 2012, ApJ, 755, 5
- Gürkan et al. (2014) Gürkan, G., Hardcastle, M. J., & Jarvis, M. J. 2014, MNRAS, 438, 1149
- Hancock et al. (2007) Hancock, M., Smith, B. J., Struck, C., Giroux, M. L., Appleton, P. N., Charmandaris, V., Reach, W. T., 2007, AJ, 133, 676
- Heckman et al. (2004) Heckman, T. M., Kauffmann, G., Brinchmann, J., Charlot, S., Tremonti, C., White, S. D. M., 2004, ApJ, 613, 109
- Hickox et al. (2007) Hickox, R. C., Jones, C., Forman, W. R., et al. 2007, ApJ, 671, 1365
- Hickox et al. (2009) Hickox, R. C., Jones, C., Forman, W. R., et al. 2009, ApJ, 696, 891
- Hickox et al. (2011) Hickox, R. C., Myers, A. D., Brodwin, M., et al., 2011, ApJ, 731, 117
- Hickox et al. (2014) Hickox, R. C., Mullaney, J. R., Alexander, D. M., et al. 2014, ApJ, in press
- Juneau et al. (2013) Juneau, S., Dickinson, M., Bournaud, F., et al. 2013, ApJ, 764, 176
- Karouzos et al. (2014) Karouzos, M., Jarvis, M. J., & Bonfield, D. 2014, MNRAS, 439, 861
- Keel et al. (1985) Keel, W. C., Kennicutt, Jr., R. C., Hummel, E., van der Hulst, J. M 1985, AJ, 90, 708
- Kennicutt et al. (1987) Kennicutt, Jr., R. C., Roettiger, K. A., Keel, W. C., van der Hulst, J. M., Hummel, E., 1987, AJ, 93, 1011
- Kewley et al. (2001) Kewley, L. J., Heisler, C. A., Dopita, M. A., Lumsden, S., 2001, ApJS, 132, 37
- Kim & Sanders (1998) Kim, D.-C., Sanders, D. B., 1998, ApJS, 119, 41
- Kocevski et al. (2011) Kocevski, D., et al. 2012, ApJ, 744, 148
- Koss et al. (2012) Koss, M., Mushotzky, R., Treister, E., Veilleux, S., Vasudevan, R., Trippe, M., 2012, ApJ, 746, L22
- Koss et al. (2010) Koss, M., Mushotzky, R., Veilleux, S., Winter, L., 2010, ApJ, 716, L125
- Kuo et al. (2008) Kuo C. -Y., Lim J., Tang Y. -W., Ho P. T. P., 2008, ApJ, 679, 1047
- Lacy et al. (2004) Lacy, M., Storrie-Lombardi, L. J., Sajina, A., et al. 2004, ApJS, 154, 166
- Lake & Dressler (1986) Lake, G., Dressler, A., 1986, ApJ, 310, 605
- Larson & Tinsley (1978) Larson R. B., Tinsley B. M., 1978, ApJ, 219, 46
- Lintott et al. (2008) Lintott, C. J., et al., 2008, MNRAS, 389, 1179
- Liu et al. (2012) Liu, X., Shen, Y., Strauss, M. A., 2012, ApJ, 745, 94
- Lotz et al. (2008) Lotz, J. M., Jonsson, P., Cox, T. J., Primack, J. R., 2008, MNRAS, 391, 1137
- Mateos et al. (2013) Mateos, S., Alonso-Herrero, A., Carrera, F. J., et al., 2013, MNRAS, 434, 941
- Mihos & Hernquist (1996) Mihos, J., & Hernquist, L. 1996, ApJ, 464, 641
- Mendel et al. (2014) Mendel, J. T., Simard, L., Palmer, M., Ellison, S. L., & Patton, D. R. 2014, ApJS, 210, 3
- Mihos & Hernquist (1996) Mihos J., Hernquist L., 1996, ApJ, 464, 641
- Patton & Atfield (2008) Patton, D. R., Atfield, J. E., 2008, ApJ, 685, 235
- Patton et al. (2011) Patton, D. R., Ellison, S. L., Simard, L., McConnachie, A. W., Mendel, J. T., 2011, MNRAS, 412, 591
- Patton et al. (2013) Patton, D. R., Torrey, P., Ellison, S. L., Mendel, J. T., Scudder, J. M., 2013, MNRAS, 433, L59
- Perez et al. (2006) Perez, M. J., Tissera, P. B., Lambas, D. G., Scannapieco, C., 2006, A&A, 449, 23
- Petric et al. (2011) Petric A. O. et al., 2011, ApJ, 730, 28
- Ramos Almeida et al. (2011) Ramos Almeida, C., Tadhunter, C. N., Inskip, K. J., Morganti, R., Holt, J., Dicken, D., 2011, MNRAS, 410, 1550
- Reichard et al. (2009) Reichard, T. A., Heckman, T. M., Rudnick, G., Brinchmann, J., Kauffmann, G., Wild, V., 2009, ApJ, 691, 1005
- Richards et al. (2006) Richards, G. T., Lacy, M., Storrie-Lombardi, L. J., et al., 2006, ApJS, 166, 470
- Rothberg & Joseph (2006) Rothberg, B., Joseph, R. D., 2006, AJ, 131, 185
- Rovilos et al. (2013) Rovilos, E., Georgantopoulos, I., Akylas, A., et al. 2013, MNRAS, 2867
- Sanders & Mirabel (1996) Sanders, D. B., Mirabel, I. F. 1996, ARA&A, 34, 749
- Sabater et al. (2013) Sabater, J., Best, P. N., Argudo-Fernandez, M.., 2013, MNRAS, 430, 638
- Satyapal et al. (2008) Satyapal, S., Vega, D., Dudik, R. P., Abel, N. P., & Heckman, T. 2008, ApJ, 677, 926
- Scudder et al. (2012) Scudder, J. M., Ellison, S. L., Torrey, P., Patton, D. R., Mendel, J. T., 2012, MNRAS, 426, 549
- Shier & Fischer (1998) Shier, L. M., Fischer, J., 1998, ApJ, 497, 163
- Silverman et al. (2011) Silverman, J. D., et al., 2011, ApJ, 743, 2
- Simard et al. (2011) Simard, L., Mendel, J. T., Patton, D. R., Ellison, S. L., McConnachie, A. W., 2011, ApJS, 196, 11
- Smith & Struck (2010) Smith, B. J., Struck, C., 2010, AJ, 140, 1975
- Stasinska et al. (2006) Stasinska, G., Cid Fernandes, R., Mateus, A., Sodre, L., Asari, N. V., 2006, MNRAS, 371, 972
- Stern et al. (2005) Stern, D., Eisenhardt, P., Gorjian, V., et al. 2005, ApJ, 631, 163
- Stern et al. (2012) Stern, D., et al., 2012, ApJ, 753, 30
- Surace et al. (1998) Surace, J. A., Sanders, D. B., Vacca, W. D., Veilleux, S., Mazzarella, J. M., 1998, ApJ, 492, 116
- Toomre (1977) Toomre. A., 1977, in Tinsley B.M., Larson R.B., eds, The Evolution of Galaxies and Stellar Populations. Yale University Observatory, New Haven, p. 401
- Urrutia et al. (2008) Urrutia, T., Lacy, M., Becker, R. H., 2008, ApJ, 674, 80
- Urrutia et al. (2012) Urrutia, T., Lacy, M., Spoon, H., Glikman, E., Petric, A., Schulz, B., 2012, ApJ, 757, 125
- Veilleux et al. (2009) Veilleux, S., et al., 2009, ApJS, 182, 628
- Villforth et al. (2014) Villforth, C., Hamann, F., Rosario, D. J., et al. 2014, MNRAS, 372
- Woods & Geller (2007) Woods, D. F., Geller, M. J., 2007, AJ, 134, 527
- Woods et al. (2006) Woods, D. F., Geller, M. J., Barton, E. J., 2006, AJ, 132, 197
- Wright et al. (2010) Wright, E. L., et al., 2010, AJ, 140, 1868
- Yan et al. (2013) Yan, L., et al., 2013 AJ, 145, 55