Broadening of meson produced coherently in the photonuclear reaction
Swapan Das 111email: swapand@barc.gov.in
Nuclear Physics Division,
Bhabha Atomic Research Centre
Mumbai-400085, India
Abstract
The invariant mass distribution spectra are calculated to estimate the hadron parameters of the meson produced coherently in the photonuclear reaction. The elementary reaction occurring in the nucleus is considered to proceed as . We describe the elementary meson photoproduction by the experimentally determined reaction amplitude . The meson propagator is presented by the eikonal form, and the meson nucleus optical potential appearing in it is estimated using the “” approximation. The meson nucleon scattering amplitude extracted from the measurements is used to generate this potential. The calculated invariant mass distribution spectra are compared with those measured at Jefferson Laboratory. The calculated results for the transparency ratio are also presented.
Keywords: meson photoproduction, meson nucleus interaction, in-medium properties
PACS number(s): 25.20.Lj, 13.60.Le
1 Introduction
The vector meson production in the nuclear reaction has drawn considerable attention to look for its properties in the nucleus [1, 2, 3, 4, 5]. Experimentally, large modification of the meson was indicated first in the enhanced dilepton yield (between 300 and 700 MeV) in CERES and HELIOS ultra-relativistic heavy ion collision data taken sometime around 1995 in CERN-SPS [6, 7, 8, 9]. Since the statistics and resolution of this yield was poor, the quantitative estimation of the meson parameters could not be made in that time. Theoretically, these data have been found compatible with two different approaches: (i) the dropping of meson mass [10, 11, 12, 13], and (ii) the many body interaction of meson with other hadrons in the nuclear medium [14, 15, 16, 17, 18]. Almost a decade later, the STAR experiment at RHIC-BNL [19] found the decrease in meson mass MeV in the analysis of the production data from the peripheral Au+Au collisions. In contrast, significant broadening in the meson mass distribution spectrum, but essentially no shift in mass, was reported by the upgraded CERES experiment [20] and dimuon measurements (in the In-In collision) in the NA60 experiment at CERN [21, 22, 23].
The in-medium properties of vector meson can be searched in the normal nuclear density and zero temperature where the calculations and interpretations for these quantities can be done judiciously. The scaling hypothesis due to Brow and Rho [24] and the QCD sum rule calculation due to Hatsuda and Lee [25] envisage the reduction of vector meson mass in the nucleus. Saito et al. [26], using the quark meson coupling model, have established a relation which describes the drop of and meson mass in the nuclear medium. The vector meson dominance model calculations due to Asakawa et al. [27, 28, 29] show the reduction of the meson mass with the increase in nuclear density. The modification of the vector mesons is elucidated large enough to observe it in the nuclear reactions with photon and pion beams [30, 31, 32]. The broadening in the meson width, in addition to the upward mass-shift and the appearance of additional peaks of this meson, in the nuclear matter are reported in Ref. [33]. The nuclear bound state calculation for the meson [34] show the drop of mass and increase in width of this meson in the hadron induced nuclear reactions. The modification of meson in the nuclear matter as well as in the proton and photon induced nuclear reactions is discussed in Ref. [35, 36, 37].
During the last decade, extensive measurements had been pursued to search the hadron parameters of the vector meson in the normal nucleus. The CBELSA/TAPS collaboration measured the invariant mass distribution spectrum to look for the meson parameters in Nb nucleus [38]. The line shape of the meson in this reaction, as shown in our calculation [39], does not show medium effect on it [40]. Other experiments on reaction corroborate this result [41, 42]. Recent measurements on the nuclear transparency ratio [43, 44] reported large in-medium width of the and mesons. The KEK-PS E325 collaboration at KEK [45, 46, 47] found the enhancement in the yield in the A reaction at 12 GeV. This enhancement is well understood due to the reduction of the vector meson mass in the nucleus. TAGX collaboration [48] reported the in-medium boardening (without mass-shift) of the meson produced in the reaction on 12C nucleus. The recent data measured by CLAS collaboration in Jefferson Laboratory also show no mass-shift but significant broadening of the meson produced in the photonuclear reaction [49, 50]. In this measurement, the meson was produced in nuclei by the tagged photon beam of energy range GeV and it was probed by for its momentum 0.8 to 3.0 GeV/c.
To study the in-medium properties of meson, we calculate the differential cross section of the invariant mass distribution in the coherent meson photoproduction reaction on nuclei. The coherent meson production in the nuclear reaction is a potential tool to investigate the meson dynamics in the nucleus. In our study, the elementary reaction occurring in the nucleus is visualized as . The meson photoproduction is described by the reaction amplitude . We address the meson propagator by the eikonal form. The meson nucleus interaction appearing in it is described by the corresponding optical potential, evaluated using approximation. The decay of is described by the corresponding decay width. It could be mentioned that there exist other mechanisms for the meson production in the photonuclear reaction. We will study those separately. The calculated invariant mass (i.e., meson mass) are compared with the data from Jefferson Laboratory [49, 50] to see at what extent the calculated results can reproduce the measured spectrum.
The meson production in the photonuclear reaction in the energy region of Jefferson Laboratory is also studied by Effenberger et al., [30] and Riek et al., [51, 52]. The previous authors have done semiclassical transport model calculation where they have discussed various aspect of emission in the photonuclear reaction. For the meson production, they have accounted it by the parameterization of the elementary meson photoproduction (on a nucleon) data. The medium effect is evaluated though the collision broadening and the potential extracted from the mass-shift formulated by the Hatsuda and Lee [25]. This potential is multiplied by a factor to incorporate the momentum dependence for it. The later authors have described the elementary meson photoproduction by the meson/pomeron exchange at GeV. At lower energy, they have described it by the wave resonances whose parameters are taken from the in-medium meson self-energy appearing in its spectral function. In fact, this self-energy (calculated in the hadronic many body theory) is used to estimate the medium effect on the meson. We describe the meson photoproduction and the meson potential (which illustrates the medium effect on this meson) by its scattering amplitude. The energy dependent values for this amplitude is extracted from the elementary reaction data. Therefore, we use (unlike others) the experimentally determined inputs in the calculation.
2 Formalism
The production of meson in the photonuclear reaction can be described by the generalized optical potential or self-energy of this meson [39, 53] as
| (1) |
where and are the energies of the meson and nucleon respectively in the c.m. system of energy equal to c.m. energy. denotes the amplitude for the reaction, and represents the spatial density distribution of the nucleus. These quantities are described elaborately in the next section.
The propagation of the meson from its production point to its decay point can be expressed as [39, 54]. It is shown later the emission of meson of 0.8 to 3.0 GeV/c momentum is strongly focused towards the forward direction. This occurs since the kinetic energy of the meson is much larger than its potential energy. We, therefore, represent the scalar part of the meson propagator by the eikonal form [55, 56], i.e.,
| (2) |
The factor in this equation describes the nuclear medium effect on the properties of meson. The form for it is
| (3) |
where is the momentum of the meson. represents the meson nucleus optical potential. This potential can modify the hadronic parameters of the meson during its passage through the nucleus. denotes the meson (on-shell) propagator in free space: . Here, and represent the resonant mass and total decay width respectively of the meson.
The differential cross section for the dilepton invariant mass (arising due to the decay of meson of mass ) distribution in the coherent reaction on a nucleus can be written as
| (4) |
where stands for the width of the meson of mass decaying at rest into dilepton: [57, 58, 59]. denotes the kinematical factor associated in the reaction. It is given by
| (5) |
with . is the energy of the recoil nucleus. All other symbols carry their usual meanings.
The factor in Eq. (4) describes the photoproduction of meson in the nucleus as well as the propagation of this meson through the nucleus. The expression for is
| (6) |
where is given by
| (7) |
It should be mentioned that carries the information about the in-medium properties of the meson, see in Eq. (3).
The Eq. (4) can be used to estimate the differential cross section for the meson mass distribution due to fixed beam energy . As mentioned earlier, the tagged photon beam was used in the measurements done at Jefferson Laboratory [49, 50]. The energies of this beam are weighted in 6 bins to simulate the beam profile used by CLAS collaboration [51] (also see the reference there in). Therefore, the cross section can be expressed as
| (8) |
where is given in Eq. (4). consists of six bins of photon energies, (GeV) = 1.0, 1.5, 2.0, 2.5, 3.0 and 3.5 with relative weights of , , , , and respectively [52].
3 Results and Discussions
We calculate the differential cross sections for the dilepton invariant mass, i.e., the meson mass , distribution in the coherent reaction on 12C, 48Ti, 56Fe and 208Pb nuclei. Since this meson, as mentioned earlier, is detected for its momentum range 0.8 to 3.0 GeV/c [49, 50], we imposed this constrain in the calculation. The meson nucleus optical potential, i.e., appearing in Eq. (3), is estimated using the approximation [55, 61, 62]:
| (9) |
where is the velocity of the meson. , the nuclear density distribution, for 12C nucleus can be written as
| (10) |
with , fm [63]. For 48Ti, 56Fe and 208Pb nuclei, is given by
| (11) |
where is equal to 3.754 fm for 48Ti, 3.971 fm for 56Fe and 6.624 fm for 208Pb. The value of (in fm) is equal to 0.567 for 48Ti, 0.5935 for 56Fe and 0.549 for 208Pb [63]. The above forms of density distribution are extracted from the electron scattering data, and they are normalized to the mass number of the corresponding nucleus.
The scattering parameters and in Eq. (9) represent the ratio of the real to imaginary part of the meson nucleon scattering amplitude , and the corresponding total cross section respectively. Since the meson is a short lived ( second) particle, can’t be obtained directly from measurements. But this amplitude for the meson momentum GeV/c is extracted from the elementary meson photoproduction () data [64]. We use this amplitude to estimate the forward four-momentum transfer in the reaction, i.e., [64]:
| (12) |
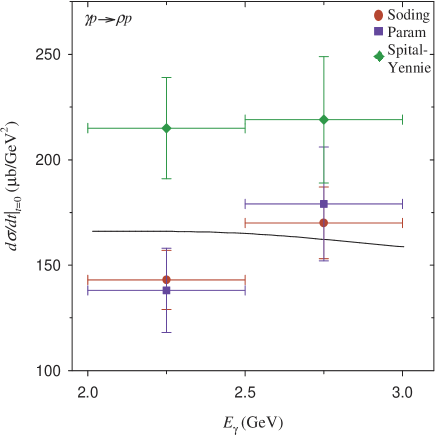
where is the fine structure constant and the value of is 2.52. and are the c.m. momenta of the and systems at the same c.m. enery. The calculated is presented in Fig. 1 along with that extracted from the measured in the reaction. The later arises (as discussed elaborately in Ref. [65]) due to Sding model (solid circle), parametric fit (solid rectangle) and Spital-Yennie procedure (solid diamond). This figure shows that , calculated for GeV of beam energy, are within the range of measured values. It could be mentioned that the vector meson dominance model relates the reaction amplitude in Eq. (1) to as [64]. The quantity , as required to calculate the cross section in few GeV regoin, can be extracted directly from the measured differential cross section [66]: .
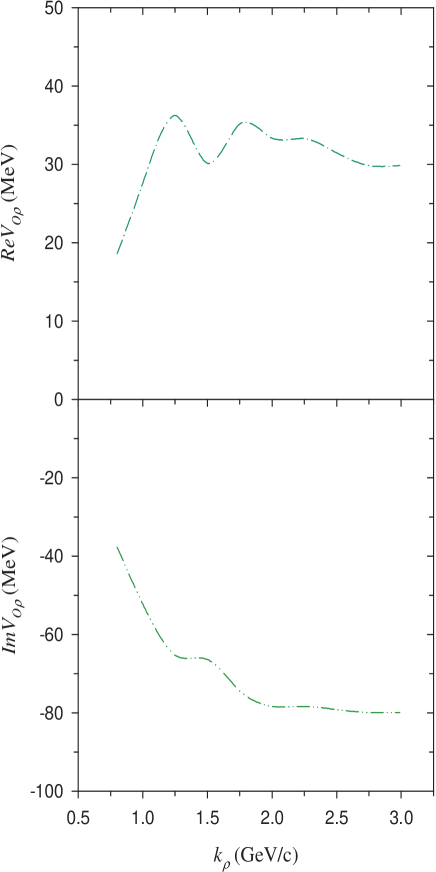
The meson optical potential in Eq. (9), evaluated using the meson nucleon scattering parameters, is presented in Fig. 2 for 12C nucleus. This potential can modify the in-medium meson spectral function , defined as
| (13) |
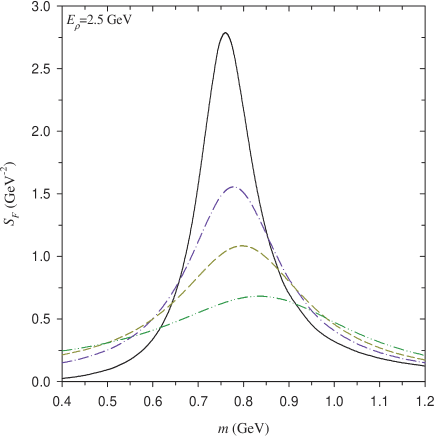
The behavior of at GeV is presented in Fig. 3 for several nuclear densities, including that in the free space. This figure illustrates that the spectral function broadens and its peak position shifts towards the higher values, as the density of the nucleus increases. Compare to free space , the width of the in-medium is enhanced from 146 MeV to 546 MeV and its peak position is shifted from 760 MeV to 830 MeV due to the meson potential resulting from the nuclear saturation density , i.e., 0.17 fm-3.
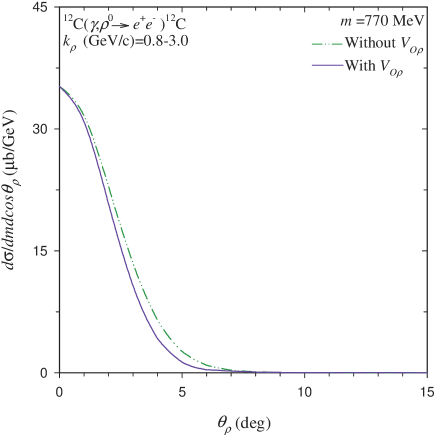
The calculated angular distribution of the meson photoproduced in the 12C nucleus is presented in Fig. 4. The meson mass is taken equal to 770 MeV. The dot-dot-dashed curve in this figure refers to the meson angular distribution for its free propagation through the nucleus, i.e., the meson nucleus interaction is not included in the calculated results. The solid curve represents that for incorporated in the calculated angular distribution. The peak cross section is reduced by a factor of 2.55 (i.e., from 35.25 b/GeV to 13.81 b/GeV) due to , where as the change in the shape of the angular distribution due to it is negligible. As shown in this figure, the meson of momentum GeV/c is emitted distinctly in the forward direction.
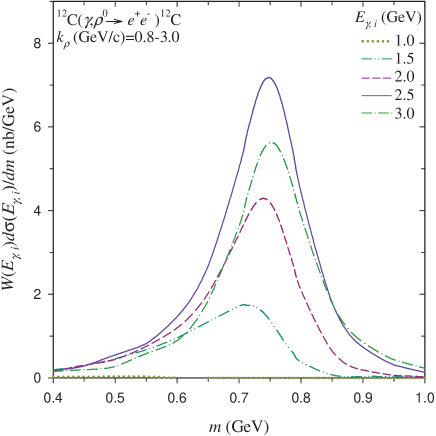
In Eq. (8), represents the cross section of the meson mass distribution at the beam energy . We plot this cross section for various in Fig. 5. The solid curve in this figure shows the cross section is maximum, i.e., 7.18 nb/GeV, at 2.5 GeV beam energy. The cross sections for beam energies equal to 2.0 GeV (dashed curve) and 3.0 GeV (dot-dashed curve) are also significant. At 3.5 GeV, the meson momentum is larger than 3.0 GeV/c. Therefore, the cross section is not calculated for this energy because of the kinematical restriction, i.e., GeV/c, imposed on the meson momentum.
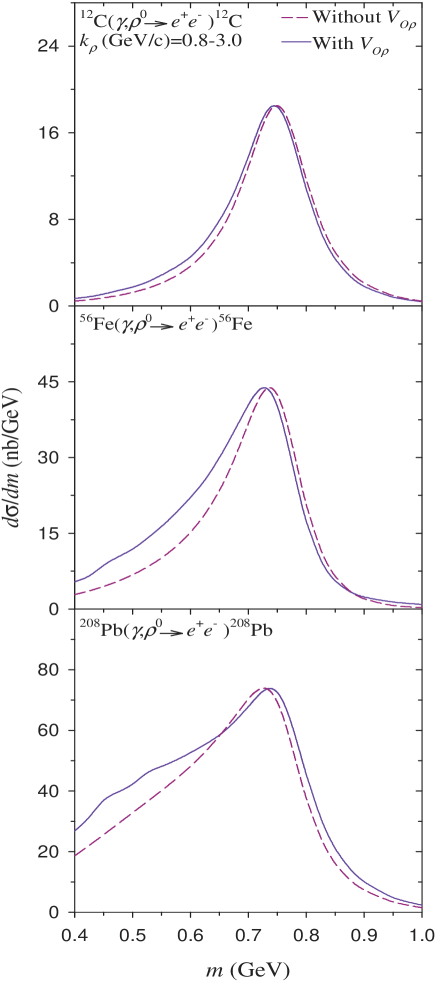
The meson parameters can be modified in the nuclear reaction due to its interaction with the nucleus, i.e., in Eq. (9). Therefore, the calculated results with and without can elucidate the nuclear medium effect on the meson. The dashed curves in Fig. 6 represent the calculated meson mass distribution spectra without this interaction. The solid curves in this figure represent those due to the inclusion of in the calculation. The cross sections are attenuated due to from 56.42 nb/GeV to 18.43 nb/GeV for 12C, from 196.88 nb/GeV to 43.78 nb/GeV for 56Fe and from 262.12 nb/GeV to 73.78 nb/GeV for 208Pb at the respective peaks which appear at the meson mass around 740 MeV. The shift in the peak position due to this potential is insignificant, i.e., 10 MeV, for all of these nuclei. The calculated results in Fig. 6 also show that the width of the meson mass distribution spectrum increases with the size of the nucleus due to the meson nucleus interaction . The enhancement in the width is found equal to 6 MeV for 12C, 35 MeV for 56Fe, and 92 MeV for 208Pb.
The change in the shape of meson mass distribution spectrum occurs due to the decay of this meson inside the nucleus. For illustration [56], we consider the meson decay within the nuclear density as the meson decay inside the nucleus. The mass distribution of the meson decaying inside and outside the nucleus can be studied by splitting in Eq. (7) into two parts [56]:
| (14) |
where and describe the meson decay inside and outside the nucleus respectively. Using Eq. (7), they can be written as
| (15) | |||||
| (16) |
with . is the radius of the nucleus where its density falls to of the saturation density.
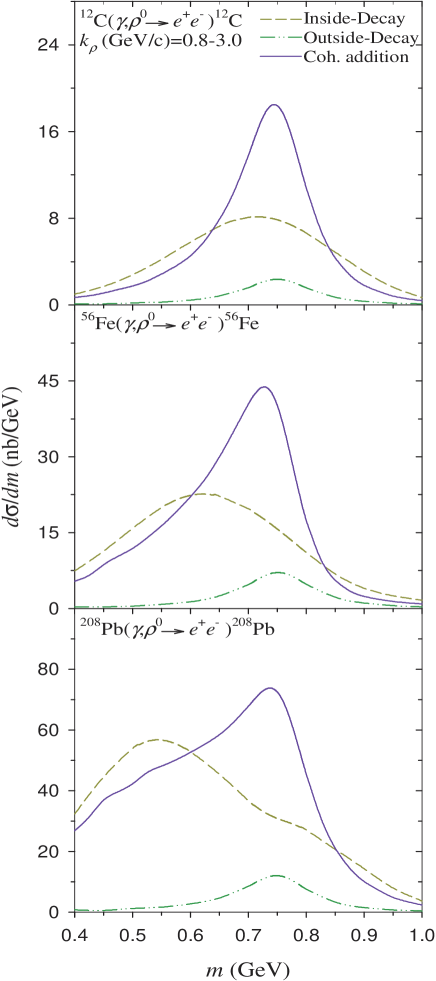
The dashed curves in Fig. 7 distinctly elucidate that the meson mass distribution becomes wider and the peak shifts towards the lower value when it decays inside the larger nucleus. The width (in MeV) of the meson decaying inside 12C, 56Fe and 208Pb nuclei are 327.69, 347.68 and 401.53 respectively. The corresponding peak appears at 710, 620 and 540 MeV. For the meson decaying outside the nucleus, its mass distribution spectra (shown by the dot-dot-dashed curves) do not change with the nucleus. These distributions show the peak appears at 750 MeV and the width is 150 MeV for all nuclei. The solid curves represent the cross section due to the coherent addition of the amplitudes of the meson decaying inside and outside the nucleus.
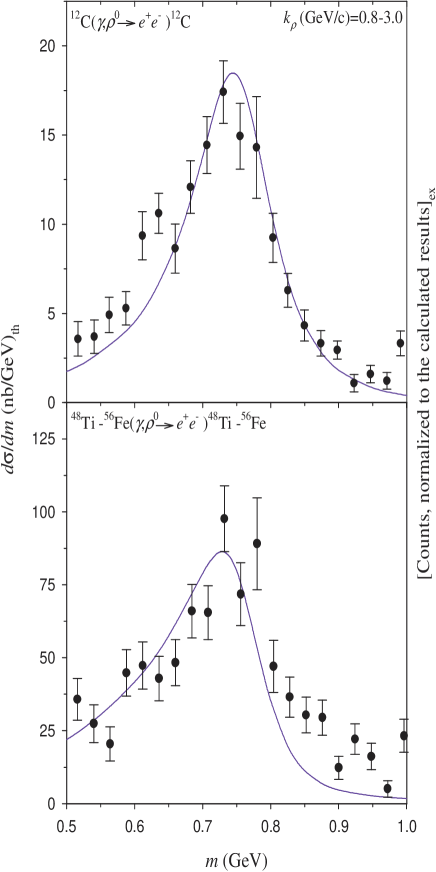
The calculated meson mass distribution spectra (solid curve) are presented in Fig. 8 along with the measured invariant mass distribution spectra [49, 50], since the dilepton pair arises (as mentioned earlier) due to the decay of the meson photoproduced in the nucleus. We compare the calculated results with the data to investigate at what extent these results can reproduce the shape of the measured spectra. The upper part of this figure shows the calculated and measured spectra for 12C nucleus, where as those for 48Ti and 56Fe nuclei are shown in the lower part of it. For these nuclei, we add the cross sections calculated separately and show them with the data. As shown in this figure, the calculated spectra reproduce reasonably the shape of the measured distributions.
The nuclear transparency ratio is another way to look for the nuclear effect on the meson propagating through the nucleus. It is the ratio of the cross section per nucleon in a nucleus relative to that of the free nucleon. Hence, measures the suppression of the elementary cross section in the nucleus. As discussed in Ref. [52], we can write
| (17) |
The values for are 0.34 for 12C, 0.26 for 56Fe and 0.32 for 208Pb nuclei. It shows anomalous result for Pb nucleus.
The calculated results showing emission in the photonuclear reaction (in the energy region of Jefferson Laboratory) also have been reported by Effenberger et al., [30] and Riek et al., [51, 52]. The previous authors have shown an additional peak in the dilepton yield at 650 MeV due to the mass modification of the vector mesons, which gets washed out because of the inclusion of the collision broadening. With the use of the momentum-dependent potential they have obtained the results close to that of the bare mass case. The later authors have studied emission due to the decay of the meson, and their results reproduce well the measured spectrum reported from Jefferson Laboratory [49, 50]. They have also shown systematically the enhancement in the meson width with the nuclear density as well as with the size of the nucleus. We also consider the meson as the source of emission. Our results show the broadening of the meson with the size of the nucleus, and reproduce reasonably the data from Jefferson Laboratory [49, 50]. For the calculation of the transparency ratio, we get consistent results for C and Fe nuclei but obtain anomalous result for Pb nucleus where as Riek et al., [52] have shown consistent results for all nuclei.
4 Conclusions
We have studied the mechanism for the coherent reaction on the nucleus, and calculated the differential cross sections for the invariant mass (i.e., meson mass) distribution in this reaction. The reduction in the cross section as well as the enhancement in the width (specifically in the heavy nucleus) of the meson mass distribution spectrum occur due to the meson nucleus interaction. The peak-shift of the calculated spectrum due to this interaction is found insignificant. The modification of the meson width arises due to the decay of this meson inside the nucleus, which increases with the size of the nucleus. The calculated spectra are accord with the data. However, the calculated transparency ratio shows anomalous result for Pb nucleus.
5 Acknowledgement
The author thanks Prof. R. Nasseripour for sending the data for Fe-Ti nuclei.
References
- [1] C. M. Ko, V. Koch and G. Li, Annu. Rev. Nucl. Part. Sci. 47, 505 (1997).
- [2] W. Cassing and E. L. Bratkovskaya, Phys. Rep. 308, 65 (1999).
- [3] R. Rapp and J. Wambach, Adv. Nucl. Phys. 25, 1 (2000).
- [4] S. Leupold, V. Metag and U. Mosel, Int. J. Mod. Phys. E 19, 147 (2010) arXiv:nucl-th/0907.2388.
- [5] R. S. Hayano and T. Hatsuda, Rev. Mod. Phys. 82, 2949 (2010) arXiv:nucl-ex/0812.1702.
- [6] A. Drees, Nucl. Phys. A610, 536c (1996).
- [7] Th. Ullrich, (CERES Collaboration), Nucl. Phys. A610, 317c (1996).
- [8] M. Masera, (HELIOS-3 Collaboration), Nucl. Phys. A590, 93c (1995).
- [9] E. Scomparin, (NA50 Collaboration), Nucl. Phys. A610, 331c (1996).
- [10] G. Q. Li, C. M. Ko and G. E. Brown, Phys. Rev. Lett. 75, 4007 (1995).
- [11] G. Q. Li, C. M. Ko, G. E. Brown and H. Sorge, Nucl. Phys. A611, 539 (1996).
- [12] W. Cassing, W. Ehehalt and C. M. Ko, Phys. Lett. B 363, 35 (1995).
- [13] W. Cassing, W. Ehehalt and I. Karlik, Phys. Lett. B 377, 5 (1996).
- [14] G. Chanfray, R. Rapp and J. Wambach, Phys. Rev. Lett. 76, 368 (1996).
- [15] R. Rapp, G. Chanfray and J. Wambach, Nucl. Phys. A617, 472 (1997).
- [16] W. Cassing, E. L. Bratkovskaya, R. Rapp and J. Wambach, Phys. Rev. C 57, 916 (1998).
- [17] R. Rapp, J. Wambach, Eur. Phys. J A6, 415 (1999).
- [18] T. Renk, R. Schneider and W. Weise, Phys. Rev. C 66, 014902 (2002).
- [19] J. Adams et al., Phys. Rev. Lett. 92, 092301 (2004).
- [20] D. Adamová et al., Phys. Lett. B 666 425 (2008) arXiv:nucl-ex/0611022v3.
- [21] R. Arnaldi et al., Phys. Rev. Lett. 96, 162302 (2006).
- [22] R. Arnaldi et al., Eur. Phys. J. C 49 235 (2007).
- [23] S. Damjanovic et al., Nucl. Phys. A 783 327c (2007).
- [24] G. E. Brown and M. Rho, Phys. Rev. Lett. 66, 2720 (1991).
- [25] T. Hatsuda and S. H. Lee, Phys. Rev. C 46, R34 (1992).
- [26] K. Saito, K. Tsushima and A. W. Thomas, Phys. Rev. C 55, 2637 (1997).
- [27] M. Asakawa, C. M. Ko, P. Levai and X. J. Qiu, Phys. Rev. C 46, R1159 (1992).
- [28] M. Asakawa and C. M. Ko, Phys. Rev. C 48, R526 (1993).
- [29] M. Asakawa and C. M. Ko, Nucl. Phys. A560, 399 (1993).
- [30] M. Effenberger, E. L. Bratkovskaya, and U. Mosel, Phys. Rev. C 60, 044614 (1999).
- [31] Th. Weidmann, E. L. Bratkovskaya, W. Cassing and U. Mosel, Phys. Rev. C 59, 919 (1999).
- [32] M. Effenberger, E. L. Bratkovskaya, W. Cassing and U. Mosel, Phys. Rev. C 60, 027601 (1999).
- [33] D. Cabrera, E. Oset and M. J. Vicente Vacas, Nucl. Phys. A 705 90 (2002).
- [34] F. Klingl et al., Nucl. Phys. A 650 299 (1999).
- [35] D. Cabrera and M. J. Vicente Vacas, Phys. Rev. C 67, 045203 (2003).
- [36] D. Cabrera, L. Roca, E. Oset, H. Toki and M. J. Vicente Vacas, Nucl. Phys. A 733, 130 (2004).
- [37] V. K. Magas, L. Roca and E. Oset, Phys. Rev. C 71 065202 (2005) arXiv:nucl-th/0403067v2.
- [38] D. Trnka et al., (CBELSA/TAPS Collaboration), Phys. Rev. Lett. 94, 192303 (2005).
- [39] Swapan Das, Phys. Rev. C 83, 064608 (2011).
- [40] V. Metag, private communication.
- [41] M. Nanova et al., (CBELSA/TAPS Collaboration), Eur. Phys. J. A 47 (2011) 16.
- [42] M. Nanova et al., (CBELSA/TAPS Collaboration), Phys. Rev. C 82 (2011) 035209.
- [43] M. Kotulla et al., (CBELSA/TAPS Collaboration), Phys. Rev. Lett. 100, 192302 (2008).
- [44] M. H. Wood et al., (CLAS Collaboration), Phys. Rev. Lett. 105, 112301 (2010).
- [45] R. Muto et al., J. Phys. G: Nucl. Part. Phys. 30, S1023 (2004).
- [46] M. Nakuri et al., Phys. Rev. Lett. 96, 092301 (2006).
- [47] R. Muto et al., (KEK-PS E325 Collaboration), Phys. Rev. Lett. 98, 042501 (2007).
- [48] G. M. Huber et al., (TAGX Collaboration), Phys. Rev. C 68, 065202 (2003).
- [49] R. Nasseripour et al., (CLAS Collaboration), Phys. Rev. Lett. 99, 262302 (2007).
- [50] M. H. Wood et al., (CLAS Collaboration), Phys. Rev. C 78 015201 (2008).
- [51] F. Riek, R. Rapp, T.-S.H. Lee and Y. Oh, Phys. Lett. B 677, 116 (2009).
- [52] F. Riek, R. Rapp, Y. Oh and T.-S.H. Lee, Phys. Rev. C 82, 015202 (2010).
- [53] A. Pautz and G. Shaw, Phys. Rev. C 57 2648 (1998).
- [54] Swapan Das, Pramana 75, 665 (2010).
- [55] Swapan Das, Phys. Rev. C 72, 064619 (2005).
- [56] Ye. S. Golubeva, L. A. Kondratyuk and W. Cassing, Nucl. Phys. A 625, 832 (1997).
- [57] A. Sibirtsev, H.-W. Hammer, U.-G. Meiner and A.W. Thomas, Eur. Phys. J. A 29 209 (2006).
- [58] R. K. Bhaduri, Models of the Nucleon (Addison-Wesley Publishing Company, Inc., California, 1988), p.269.
- [59] J. J. Sakurai, Currents and Mesons (The University of Chicago Press, Chicago, 1969), p.63 & 79.
- [60] R. M. Barnett et al., Phys. Rev. D 54, 25 (1996).
- [61] J. M. Eisenberg and D. S. Koltun, Theory of Meson Interactions with Nuclei (A Wiley-Interscience Publication, John Wiley & Sons, New York, 1980), p.158.
- [62] R. J. Glauber, in Lectures in theoretical physics, edited by W. E. Brittin et al., (Interscience Publishers, New York, 1959) vol. 1, p. 315.
- [63] C. W. De Jager, H. De. Vries and C. De. Vries, At. Data Nucl. Data Tables, 14, 479 (1974).
- [64] L. A. Kondratyuk, A. Sibirtsev, W. Cassing, Ye. S. Golubeva and M. Effenberger, Phys. Rev. C 58, 1078 (1998).
- [65] T. H. Bauer, R. D. Spital and D. R. Yennie, Rev. Mod. Phys. 50, 314 (1978).
- [66] G. R. Satchler, Introduction to Nuclear Reaction (The Macmillan Press Ltd., London, 1980), p. 95.
Figure Captions
-
1.
(color online). The calculated forward four-momentum transfer in the reaction at various energies. The data points are those extracted from the measured distribution: solid circle due to Sding model; solid rectangle due to parametric fit and solid diamond due to Spital-Yennie procedure (see the detail in Ref. [65]).
-
2.
(color online). The variation of the meson optical potential with its momentum . and represent the real and imaginary parts of respectively. This potential is calculated for the central density of 12C nucleus.
-
3.
(color online). The meson spectral function at GeV resulting from the optical potential in Eq. (9) for several nuclear densities . The nuclear saturation density is taken equal to 0.17 fm-3. The solid, dot-dashed, dashed and dot-dot-dashed lines are due to densities: = 0, , and respectively.
-
4.
(color online). The angular distributions of the meson, photoproduced in the 12C nucleus for GeV/c, calculated with and without the meson optical potential . The cross section at the peak is reduced by a factor of 2.55 due to . The meson mass is taken equal to 770 MeV.
-
5.
(color online). The calculated cross section for the meson mass distribution at various beam energies. The cross section is maximum at 2.5 GeV.
-
6.
(color online). The calculated cross sections for the meson mass distribution with and without the meson nucleus interaction (see text). The peak cross section is reduced due to by the factor of 3.06 for 12C, 4.5 for 56Fe and 3.55 for 208Pb nuclei.
-
7.
(color online). The dashed curves represent the calculated mass distribution spectra for the meson decaying inside the nucleus where as the dot-dot-dashed curves denote those for the meson decaying outside the nucleus. The coherent addition of them is shown by the solid curves.
- 8.