Modeling the Infrared Interstellar Extinction
Abstract
How dust scatters and absorbs starlight in the interstellar medium (ISM) contains important clues about the size and composition of interstellar dust. While the ultraviolet (UV) and visible interstellar extinction is well studied and can be closely fitted in terms of various dust mixtures (e.g., the silicate-graphite mixture), the infrared (IR) extinction is not well understood, particularly, the mid-IR extinction in the 3–8 wavelength range is rather flat (or “gray”) and is inconsistent with the standard Mathis, Rumpl, & Nordsieck (MRN) silicate-graphite dust model. We attempt to reproduce the flat IR extinction by exploring various dust sizes and species, including amorphous silicate, graphite, amorphous carbon and iron. We find that the flat IR extinction is best explained in terms of micrometer-sized amorphous carbon dust which consumes 60 carbon atoms per million hydrogen atoms (i.e., C/H 60 ppm). To account for the observed UV/visible and near-IR extinction, the silicate-graphite model requires Si/H 34 ppm and C/H 292 ppm. We conclude that the extinction from the UV to the mid-IR could be closely reproduced by a mixture of submicrometer-sized amorphous silicate dust, submicrometer-sized graphitic dust, and micrometer-sized amorphous carbon dust, at the expense of excess C available in the ISM (i.e., this model requires a solid-phase C abundance of C/H 352 ppm, considerably exceeding what could be available in the ISM).
keywords:
Infrared , Extinction , Dust , Model1 Introduction
The interstellar extinction is one of the primary sources of information about the interstellar dust size and composition. The interstellar extinction varies from one sightline to another in the ultraviolet (UV) and optical wavelength range. This variation in the Milky Way galaxy can be described by a single parameter, i.e., (Cardelli et al. 1989; hereafter CCM).111 is the total-to-selective extinction ratio, where is the reddening which is the difference between the extinction in the blue band () and the extinction in the visual band (). The average extinction law for the Galactic diffuse interstellar medium (ISM) corresponds to . Based on the interstellar extinction curve observed for the diffuse ISM , Mathis et al. (1977) constructed a simple interstellar dust model to fit the interstellar extinction observed over the wavelength range of . This classic model — known as the “MRN” model — consists of silicate and graphite grains222Hoyle & Wickramasinghe (1962) first proposed that graphite grains of sizes a few times 0.01 could condense in the atmospheres of cool N-type carbon stars, and these grains would subsequently be driven out of the stellar atmospheres and injected into the interstellar space by the stellar radiation pressure. Similarly, Kamijo (1963) suggested that nanometer-sized SiO2 grains could condense in the atmospheres of cool M-type stars. Gilman (1969) argued that grains around oxygen-rich cool giants could mainly be silicates such as Al2SiO5 and Mg2SiO4. Silicates were first detected in emission in M stars (Woolf & Ney 1969, Knacke et al. 1969). After blown out of the stellar atmospheres and injected into the interstellar space, silicates could become an interstellar dust component. Hoyle & Wickramasinghe (1969) first modeled the interstellar extinction in terms of a mixture of silicate grains of radii 0.07 and graphite grains of radii 0.065. Wickramasinghe & Nandy (1970) found that a mixture of silicate, graphite, and iron grains achieved a rough fair fit to the interstellar extinction curve at . and takes a simple power-law size distribution with for the size range of , where is the radius of the dust which is assumed to be spherical.333To be precise, the MRN model actually derived a wider size range of for the graphite component and a narrower size range of for the silicate component (and for other components such as SiC, iron and magnetite), with 3.3–3.6. In the literature, the MRN model is customarily taken to be a mixture of silicate and graphite with and . This is probably because (1) in their Figure 4 the demonstrated model fit to the observed UV/visible extinction was provided by the olivine-graphite mixture with and for both dust components; and (2) Draine & Lee (1984) also derived and for both dust components using improved optical constants for these two substances. The sudden cutoff at and is not physical. Kim et al. (1994) and WD01 adopted a more smooth size distribution function which extends smoothly to . But the dust with takes only a negligible fraction of the total dust mass. This model was further developed by Draine & Lee (1984) who extensively discussed the optical properties of “astronomical” silicate and graphite materials. Subsequent developments were made by Draine and his coworkers (Weingartner & Draine 2001 [hereafter WD01], Li & Draine 2001) who extended the silicate-graphite grain model to explicitly include polycyclic aromatic hydrocarbon (PAH) molecules to explain the so-called “unidentified infrared emission” (UIE) bands at 3.3, 6.2, 7.7, 8.6, and 11.3 (see Léger & Puget 1984, Allamandola et al. 1985).
With the wealth of available data from space-borne telescopes (e.g., Infrared Space Observatory [ISO] and Spitzer Space Telescope) and ground-based surveys (e.g., Two Micron All Sky Survey [2MASS]) in the near- and mid-infrared, in recent years we have seen an increase in interest in the infrared (IR) extinction. Understanding the effects of dust extinction in the IR wavelengths is important to properly interpret these observations. While the UV/optical extinction has been extensively observed for a wide variety of environments and modeled in terms of various dust models, our understanding of the near- and mid-IR extinction is still somewhat poor and controversial, despite that in this spectral domain many advances have been made in the past few years (see §1 of Wang et al. 2013).
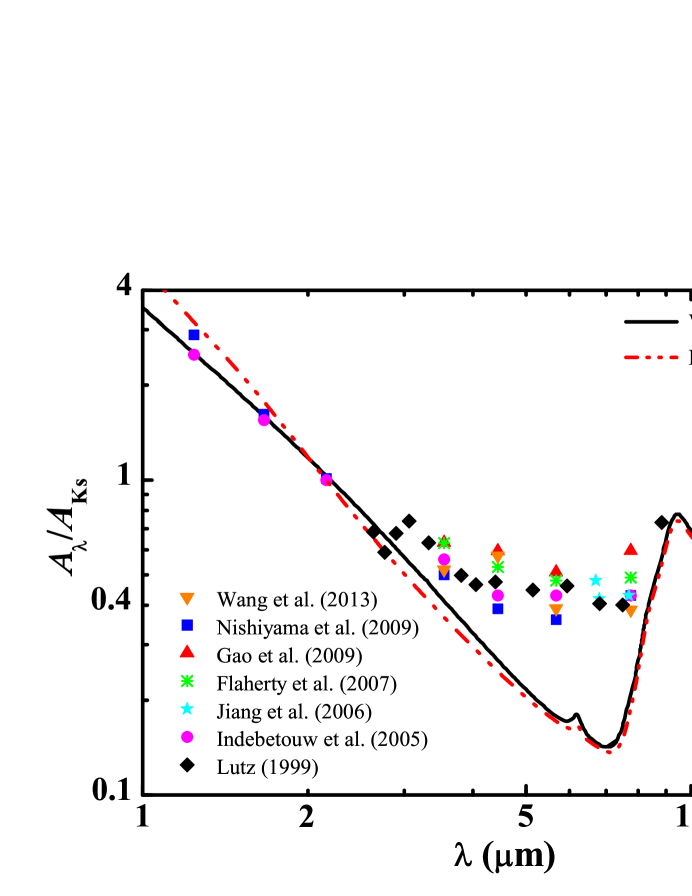
As shown in Figure 1, WD01 silicate-graphite grain model predicts a power-law of for the IR extinction at , while the MRN model predicts a steeper power-law of .444At , the extinction increases because of the 9.7 silicate Si–O stretching absorption band. The model IR extinction curves reach their minimum at 7 where the extinction power-law intersects the blue-wing of the 9.7 silicate absorption band.
Rieke & Lebofsky (1985) measured the IR extinction from 1 to 13 for the lines of sight toward Sco, a normal A5 II star behind the edge of the Oph cloud obscured by ,555The extinction toward Sco at can be well described by the extinction law. At , the observed colors of Sco are much bluer than expected from those of a normal A5 II star obscured by with the extinction law, leading to the assignment of (see Rieke & Lebofsky 1985). and toward a number of stars in the galactic center (GC). Rieke & Lebofsky (1985) derived a power-law of for for Sco and the GC sources. Draine (1989) compiled the IR extinction observed for a range of galactic regions including diffuse clouds, molecular clouds, and HII regions. He derived a power-law of for . More recently, Bertoldi et al. (1999) and Rosenthal et al. (2000) also derived a power-law extinction of for for the Orion molecular cloud (OMC).666The OMC extinction also displays an absorption band at 3.05 attributed to water ice.
However, numerous recent observations suggest the mid-IR extinction at to be almost universally flat or “gray” for both diffuse and dense environments (see §1.4 of Wang et al. 2013 for a summary), much flatter than that predicted from the MRN or WD01 silicate-graphite model for (see Figure 1).
Lutz et al. (1996) derived the extinction toward the GC star Sgr A∗ between 2.5 and 9 from the H recombination lines. They found that the GC extinction shows a flattening of in the wavelength region of , clearly lacking the pronounced dip at 7 predicted from the silicate-graphite model (see Figure 1). This was later confirmed by Lutz (1999), Nishiyama et al. (2009), and Fritz et al. (2011).
Indebetouw et al. (2005) used the photometric data from the 2MASS survey and the Spitzer/GLIMPSE Legacy program to determine the IR extinction. From the color excesses of background stars, they derived the 1.25–8 extinction laws for two very different lines of sight in the Galactic plane: the sightline toward a relatively quiescent region, and the sightline which crosses the Carina Arm and contains RCW 49, a massive star-forming region. The extinction laws derived for these two distinct Galactic plane fields are remarkably similar: both show a flattening across the 3–8 wavelength range, consistent with that derived by Lutz et al. (1996) for the GC.
Jiang et al. (2006) derived the extinction at 7 and 15 for more than 120 sightlines in the inner Galactic plane based on the ISOGAL survey data and the near-IR data from DENIS and 2MASS, using RGB tip stars or early AGB stars (which have only moderate mass loss) as the extinction tracers. They found the extinction well exceeding that predicted from the MRN or WD01 model.
Flaherty et al. (2007) obtained the mid-IR extinction laws in the Spitzer/IRAC bands for five nearby star-forming regions. The derived extinction laws at 4–8 are flat, even flatter than that of Indebetouw et al. (2005).
Gao et al. (2009) used the 2MASS and Spitzer/GLIPMSE data to derive the extinction in the four IRAC bands for 131 GLIPMSE fields along the Galactic plane within . Using red giants and red clump giants as tracers, they also found the mean extinction in the IRAC bands to be flat.
Wang et al. (2013) determined the mid-IR extinction in the four Spitzer/IRAC bands of five individual regions in Coalsack, a nearby starless dark cloud, spanning a wide variety of interstellar environments from diffuse and translucent to dense clouds. They found that all regions exhibit a flat mid-IR extinction.
All these observations appear to suggest an “universally” flat extinction law in the mid-IR, with little dependence on environments.777We should note that an “universally” flat mid-IR extinction law does not necessarily mean an identical mid-IR extinction law for all regions, instead, it merely means a flattening trend of with in the mid-IR. Chapman et al. (2009), McClure (2009), and Cambrésy et al. (2011) found that the shape of the mid-IR extinction law appears to vary with the total dust extinction. But also see Román-Zúñiga et al. (2007) and Ascenso et al. (2013) who found no evidence for the dependence of the mid-IR extinction law on the total dust extinction. While rapid progress has been made in observationally determining the mid-IR extinction and numerous IR extinction curves have been accumulated both for the Milky Way and for the Magellanic Clouds (e.g., see Gao et al. 2013a), theoretical understanding of the nature and origin of the flat mid-IR extinction lags well behind the observations. We plan to model the interstellar extinction from the far-UV to the far-IR for a wide range of interstellar environments. In this work we present our first attempts to understand the nature of the flat mid-IR extinction. In §2 we summarize the current status in interpreting the flat mid-IR extinction. §3 describes our model. §4 presents the results and discussions.
2 Modeling the Mid-IR Extinction: Where Do We Stand?
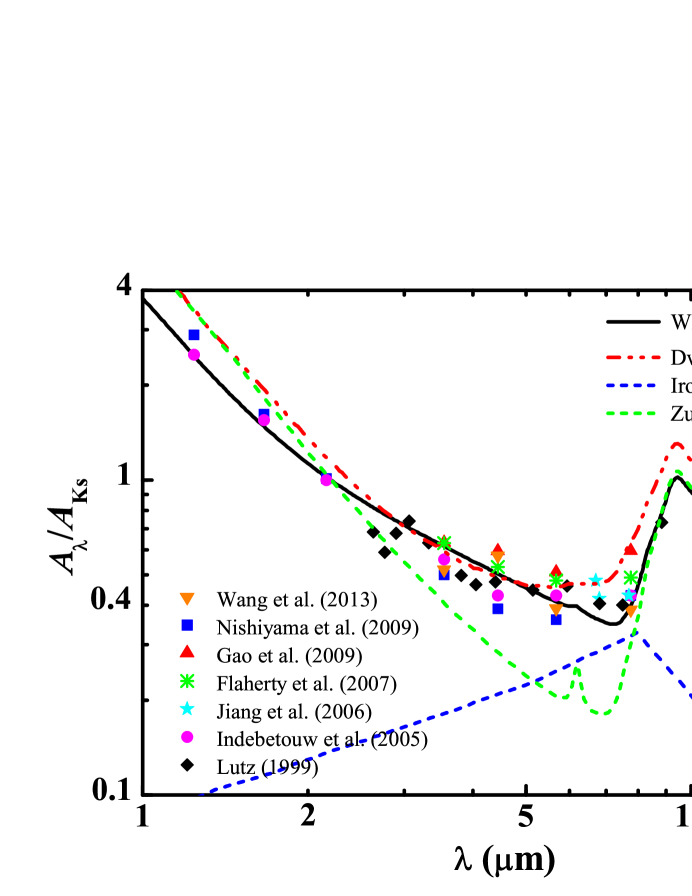
To the best of our knowledge, only WD01 and Dwek (2004) have closely reproduced the flat mid-IR extinction. Using a mixture of amorphous silicate dust and carbonaceous dust,888The carbonaceous grain population was assumed to extend from grains with graphitic properties at radii , down to particles with PAH-like properties at very small sizes (see Li & Draine 2001). WD01 fitted the UV/optical and near-IR extinction curves of different values of in the wavelength range of . Draine (2003) extended the WD01 model of into the IR up to . It is amazing that the WD01 model closely reproduces the flat mid-IR extinction observed toward the GC (Lutz et al. 1996; also see Figure 2). The success of the WD01 model and the failure of the WD01 model in fitting the flat mid-IR extinction suggest that the flat mid-IR extinction implies a population of large dust, although the exact size and quantity of this dust population are not known.
Generally speaking, denser regions tend to have flatter extinction curves in the UV and higher values : increased is attributed to tilt in size distribution to decrease numbers of small grains, and increase of numbers of large grains due to grain growth primarily through coagulation (Draine 2011).
However, the flat mid-IR extinction is not only seen in dense regions. As discussed in §1, the flat mid-IR extinction has been seen in various interstellar environments, including diffuse clouds (e.g., the low-density lines of sight in the Galactic midplane [see Zasowski et al. 2009], and the diffuse and translucent regions of the Coalsack nebula [see Wang et al. 2013]). The size distribution is more appropriate for dense regions.
Dwek (2004) hypothesized that metallic needles may play an important role in accounting for the flat mid-IR extinction. As shown in Figure 2, Dwek (2004) argued that, combined with the silicate-graphite mixture for the model (Zubko et al. 2004), metallic needles999The idea of metallic needles was originally brought up by Hoyle et al. (1968) and Wickramasinghe et al. (1975) to explain the 2.7 K cosmic microwave background (CMB). They argued that the 2.7 K CMB might have arisen from the radiation of “Population III” objects thermalized by long slender conducting cosmic whiskers or “cosmic needles”. with a typical length () over radius () ratio of and a needle-to-H mass ratio of could explain the flat mid-IR extinction derived by Lutz (1999) for the GC. However, it is not clear if metallic needles are indeed present in the ISM (see Li 2003). It would be interesting to study their generation and evolution in the ISM and their optical properties.
Gao et al. (2013b) have also attempted to fit the 1–19 IR extinction curve toward the GC derived by Fritz et al. (2011). Their best-fit model for the GC IR extinction constrains the visual extinction to be 38–42. But their model could not simultaneously reproduce both the relatively steep 1–3 near-IR extinction and the flat 3–8 mid-IR extinction. They suggested that the extinction toward the GC could be due to a combination of dust in different environments: dust in diffuse regions (characterized by small and steep near-IR extinction), and dust in dense regions (characterized by large and flat UV extinction).
3 Our Model
We aim at simultaneously reproducing the observed UV/optical and near- and mid-IR extinction. Following MRN and WD01, we assume a mixture of amorphous silicate dust and graphite dust. The optical constants of amorphous silicate dust and graphitic dust are taken from Draine & Lee (1984). Since the flat mid-IR extinction is seen both in diffuse clouds and in dense clouds, we consider the UV/optical and near-IR extinction curves of different values: , and 5.5.
We adopt an exponentially-cutoff power-law size distribution for both dust components: for , where is the spherical radius of the dust (we assume the dust to be spherical), is the power exponent, and is the cutoff size. Following MRN, the lower cutoff of the dust size is initially taken to be . But for the curves, we find that is more favorable. The upper cutoff is set at .
We have five parameters: and for the silicate component, and for the carbonaceous component (i.e., graphite), and , the mass ratio of graphite to silicate dust. The ratio of the total model extinction at wavelength to the column density of H nuclei is calculated from
| (1) |
| (2) | |||||
| (3) | |||||
| (4) | |||||
where and are respectively proportional to the column densities of the silicate and graphite dust, and are respectively the mass densities of the silicate and graphite dust, and are respectively the extinction cross sections of the silicate and graphite dust of size at wavelength , is the extinction at wavelength of the silicate-graphite mixture per silicate dust column, and and are respectively the “observed” extinction and uncertainty at wavelength . For the UV/optical and near-IR extinction, we follow WD01 to fit the CCM extinction characterized by between 0.35 and 8 and evaluate the extinction at wavelengths , equally spaced in .
As will be shown later in §4, although this simple grain model could closely reproduce the observed UV/optical and near-IR extinction, it could not fit the flat mid-IR extinction. Guided by the fact that dust scatters and absorbs starlight most effectively at wavelengths comparable to its size (i.e., ; see Wang et al. 2014), we will add an extra population of large, micrometer-sized dust to account for the flat mid-IR extinction. For this large, m-sized dust population, we will consider amorphous silicate, graphite, amorphous carbon, and metallic iron. We adopt the optical constants of the “ACAR”-type amorphous carbon of Rouleau & Martin (1991). The optical constants of iron are taken from Li (2003).
For the mid-IR extinction, we compare the model results with the observational data for the following regions as a whole: the Galactic center (Lutz 1999, Nishiyama et al. 2009), the Galactic plane (Indebetouw et al. 2005, Jiang et al. 2006, Gao et al. 2009), nearby star-forming regions (Flaherty et al. 2007), and the Coalsack nebula (Wang et al. 2013). Ideally, the CCM UV/optical extinction should be combined only with the IR extinction for the regions characterized by the same . However, the regions for which the mid-IR extinction has been measured are not well characterized and their values are not well determined.101010For example, the line of sight toward the Galactic center is often considered as a sightline of diffuse clouds as revealed by the presence of the 3.4 C–H aliphatic hydrocarbon stretching absorption feature which is not seen in molecular clouds (Pendleton & Allamandola 2002, Mennella et al. 2002). However, the Galactic center sightline must also contain molecular cloud materials as revealed by the presence of the 3.1 and 6.0 H2O ice absorption features (e.g., see McFadzean et al. 1989). Nonetheless, as illustrated in Figure 1, the mid-IR extinction for different regions does not appear to differ substantially from each other and on average, a flat mid-IR extinction is well established. It is interesting to note that, as shown in Wang et al. (2013) for the Coalsack nebula, the mid-IR extinction of diffuse regions seems to be even somewhat flatter than that of dense regions. Therefore, we intend to compare our model results with the mid-IR observations as a whole, instead of an individual region.
In modeling the UV/optical extinction, we perform a grid-search by minimizing (see eq. 8 of WD01) with the weights given by WD01. We fit the mid-IR extinction by eye as we do not know how the mid-IR extinction data points shoud be weighted compared to the UV/optical extinction. We fit the UV/optical segment and the mid-IR segment separately but requiring that the addition of the mid-IR model extinction to the total extinction does not distort the fit to the UV/optical part.
4 Results and Discussion
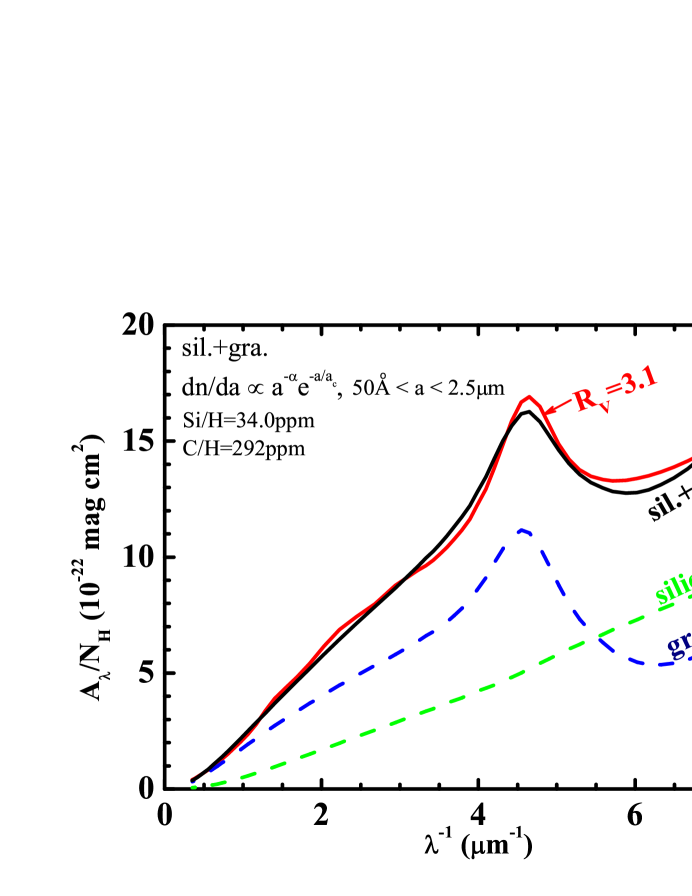
To testify our model, we first fit the UV/optical and near-IR extinction curve of . We assume that silicate and graphite have the same size distribution (i.e., , ). Figure 3 shows the best-fit results. The best-fit model parameters are listed in Table 1. The abundances of the dust-forming heavy elements locked up in the dust can be derived from the following equation:
| (5) | |||||
where is the mass of a hydrogen atom, and are respectively the mass density and column density of the dust species containing element X, and and are respectively the number of X atoms in and molecular weight of a molecule of the dust species containing element X. We consider elements Si and C and dust species amorphous silicate and graphite: , , , and .111111For silicate dust, we assume its chemical composition to be MgFeSiO4. We derive the C and Si abundances required to be locked up in dust to be and (ppm refers to “parts per million”).
For the dust-forming element , let be the “interstellar abundance” – the total abundance of this element in the ISM, both in gas and in dust; and be the gas-phase abundance of this element. The abundance of this element in dust is . The gas-phase Mg, Si and Fe abundances are negligible (i.e. these rock-forming elements are almost completely depleted from the gas phase; see Li (2005) and references therein). Therefore, for Si we have .
The interstellar abundance of Si (i.e. ) is not known. Traditionally, one often adopts the solar photospheric abundances (e.g. Asplund et al. 2009) of heavy elements as their interstellar abundances. However, Lodders (2003) argued that the currently observed solar photospheric abundances (relative to H) must be lower than those of the proto-Sun because helium and other heavy elements have settled toward the Sun’s interior since the time of the Sun’s formation some 4.55 Gyr ago. She further suggested that protosolar abundances derived from the photospheric abundances by considering settling effects are more representative of the solar system elemental abundances.
On the other hand, it has also been argued that the interstellar abundances might be better represented by those of B stars and young F, G stars (because of their young ages) which are just 60–70% of the solar values (i.e., “subsolar”; Snow & Witt 1996, Sofia & Meyer 2001). However, Li (2005) showed that if the interstellar abundances are indeed “subsolar” like B stars and young F, G stars, there might be a lack of raw material to form the dust to account for the interstellar extinction. We also note that Przybilla et al. (2008) derived the photospheric abundances of heavy elements for six unevolved early B-type stars in the solar neighborhood OB associations and the field using NLTE techniques. They found that the photospheric abundances of those B stars are in close agreement with the solar values. Nieva & Przybilla (2012) further derived the photospheric abundances of 29 slowly-rotating early B-type stars. These stars exhibit 10% abundance fluctuations and their abundances are also similar to that of the Sun.
The Si abundance of the Sun, proto-Sun, and early B stars are respectively (Asplund et al. 2009), (Lodders 2003), and (Przybilla et al. 2008, Nieva & Przybilla 2012). The model which best fits the UV/optical extinction requires , consistent with the solar, proto-Sun or B stars Si abundance.
For C, it is more complicated since the gas-phase C abundance is recently under debate. Earlier studies reported from the weak intersystem absorption transition of C II] at 2325 (Cardelli et al. 1996; Sofia et al. 2004). Very recently, Sofia et al. (2011) derived for several interstellar sightlines from the strong transition of C II] at 1334. They argued that the oscillator strength for the C II] transition at 2325 previously used by Cardelli et al. (1996) and Sofia et al. (2004) to obtain might have been underestimated. The solar C abundance and proto-Sun C abundance are respectively (Asplund et al. 2009) and (Lodders 2003). The C abundance of the early B stars which are thought to be ideal indicators for the present-day interstellar abundances since they preserve their pristine abundances is close to the solar C abundance: (Przybilla et al. 2008) and (Nieva & Przybilla 2012). If the interstellar C abundance is like that of the early B stars (i.e., ) or that of the proto-Sun (i.e., ), with the gas-phase C abundance of (Sofia et al. 2011) subtracted, there will be only 109 or 188 of C available to make the carbonaceous dust. However, the model which best fits the UV/optical extinction requires , substantially exceeding what would be available to be locked up in dust.121212We note that, except the composite dust model of Mathis (1996) which only requires (and , but see Dwek 1997), all interstellar grain models consume more C than the available value of 109 or 188 in the ISM: (and ) of Li & Greenberg (1997), (and ) of WD01, (and ) of Zubko et al. (2004), (and ) of Jones et al. (2013).
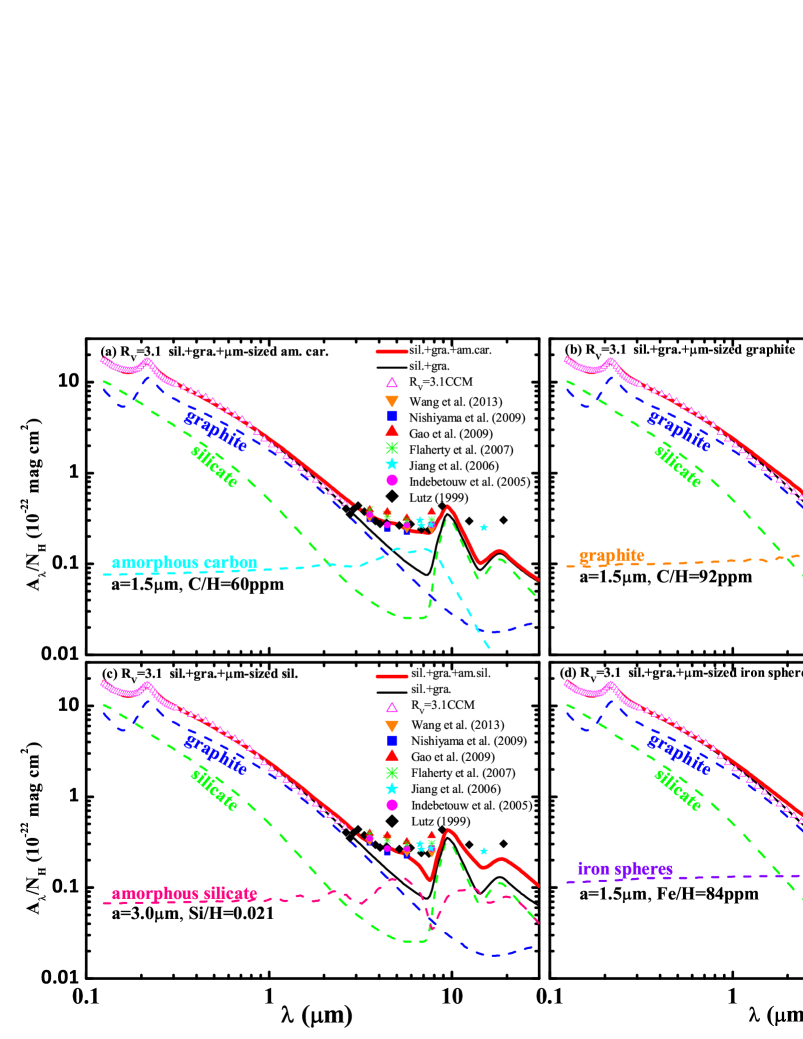
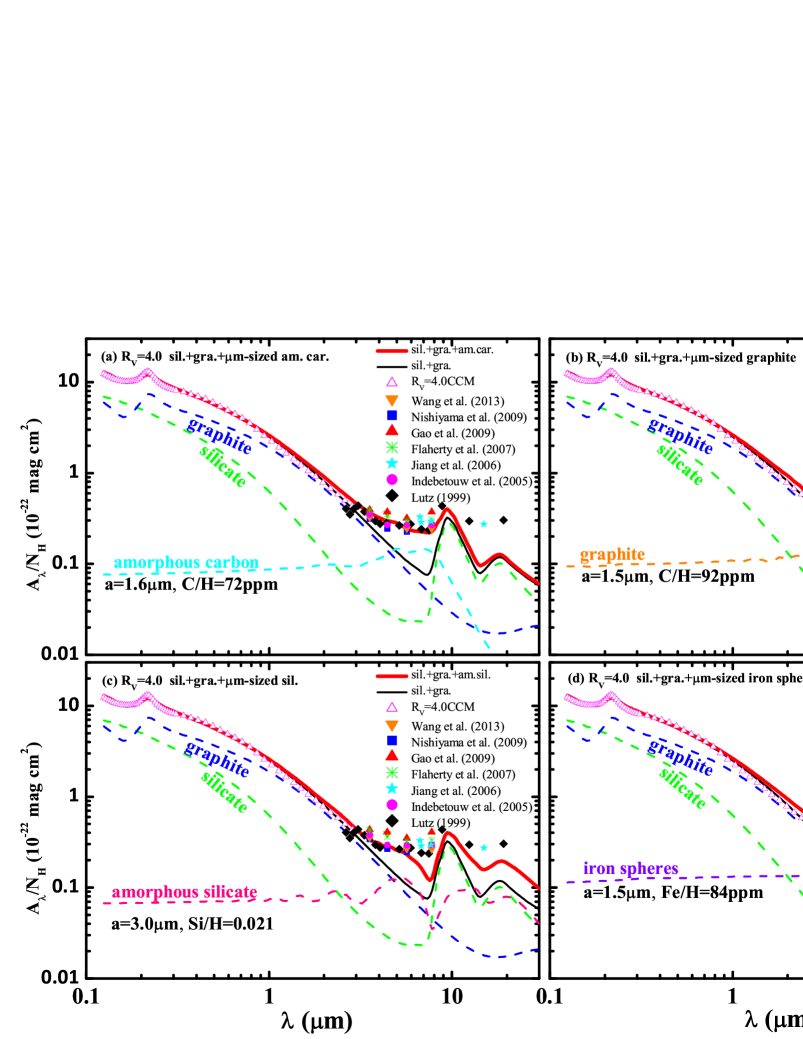
As shown in Figure 3, the silicate-graphite mixture model with and closely reproduces the observed UV/optical/near-IR extinction. However, it fails in fitting the flat 3–8 mid-IR extinction (see Figure 4a). According to light scattering theory, dust absorbs and scatters starlight most effectively if its size is comparable to the starlight wavelength. Therefore, the dust which dominates the mid-IR extinction at 3–8 should be in micrometer size scale, as inferred from the consideration of . This leads us to add an extra population of large, m-sized dust to account for the mid-IR extinction. We explore the size of the dust ranging from to . For simplicity, we only consider dust of single sizes. In principle, we could assume a log-normal size distribution or the WD01-type size distribution for this m-sized dust population. But we do not expect that a distribution of dust sizes would affect the conclusion drawn from the single-size model. A distribution of sizes would remove the ripple structures in the extinction curve of single-sized dust. The observed mid-IR extinction is commonly derived from broad-band photometry and therefore could tolerate the wavy ripples.
As shown in Figure 4a, the model together with spherical amorphous carbon dust of radius of and C/H 60 could closely fit the mid-IR extinction. These m-sized amorphous carbon grains, with , are “gray” in the UV/optical wavelength regime. Therefore, the addition of m-sized dust does not distort the fit to the observed extinction curve provided by the silicate-graphite model. In total, this model requires to account for the observed extinction from the UV to the mid-IR, with 17% of the C atoms locked up in the m-sized amorphous carbon component.
We have also considered m-sized graphite, amorphous silicate, and iron dust. As shown in Figure 4b, graphite of radius of is also capable of reproducing the flat mid-IR extinction. However, the m-sized graphite population requires C/H 92. Therefore, amorphous carbon, with C/H 60, seems more favorable since the silicate-graphite model already encounters a “carbon crisis” problem: the model consumes more C/H than what is available.
As shown in Figure 4c, amorphous silicate could not fit the mid-IR extinction for two reasons: (1) the best-fit model with predicts a prominent dip at 8 which is not seen in the observed mid-IR extinction; this dip is due to the onset of the 9.7 Si–O stretch at 8; (2) this model requires Si/H 21,000 to be locked up in the m-sized silicate dust, which is far more than the available amount of 32–41 in the ISM.
Figure 4d shows the fit obtained with Fe/H 84 in iron spheres of . Although the fit to the mid-IR extinction is excellent, this model requires a total depletion of Fe/H 116,131313To account for the UV/optical extinction, the submicrometer-sized amorphous silicate component consumes Fe/H 32. while the Fe abundance of the Sun, proto-Sun, and early B stars is only (Asplund et al. 2009), (Lodders 2003), and 28–33 (Przybilla et al. 2008, Nieva & Przybilla 2012), respectively.
| Extinction | ||||||||
|---|---|---|---|---|---|---|---|---|
| Type | () | (m) | () | (ppm) | (ppm) | |||
| 6.26 | 3.2 | 3.2 | 0.14 | 0.6 | 34.0 | 292 | ||
| 6.85 | 2.7 | 2.7 | 0.12 | 0.6 | 30.7 | 264 | ||
| 7.40 | 2.1 | 3.0 | 0.16 | 0.3 | 40.0 | 172 |
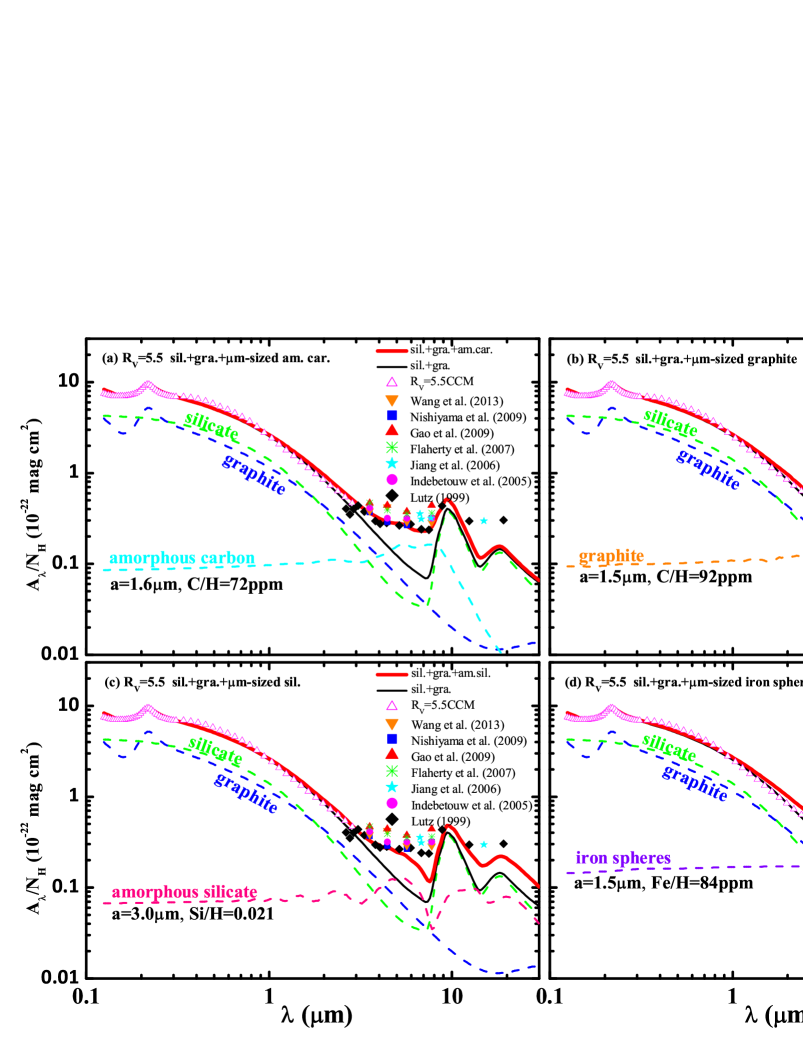
We have also considered models for the and extinction curves since the flat mid-IR extinction has also been seen in dense regions (see §2). For the case, we also assume that both silicate and graphite have the same size distribution. The results are shown in Figure 5 and Table 1. It is seen that both amorphous carbon of and graphite of could fit the flat mid-IR extinction. Again, amorphous carbon is preferred since it requires C/H 72, less than that of graphite of C/H 92. For the case, we could not fit the UV/optical/near-IR extinction if we assume the same size distribution for both silicate and graphite. We therefore set , but allow silicate and graphite to have different values (i.e., ). The best-fit results are shown in Figure 6 and the model parameters are tabulated in Table 1. Similar to the and models, m-sized amorphous carbon and graphite could closely fit the mid-IR extinction, with amorphous carbon being preferred since it does not consume as much C/H as graphite.
Finally, we note that it is not clear how m-sized interstellar dust is formed. However, there are several pieces of evidence suggesting its presence in the ISM: (1) measurements by dust impact detectors on the interplanetary spacecrafts Ulysses and Galileo appear to indicate a substantial flux of interstellar particles with masses 10 (corresponding to for silicate and for graphite) entering the heliosphere (see Landgraf et al. 2000, Krüger et al. 2007); (2) Taylor et al. (1996) reported radar detection of particles entering the Earth’s atmosphere on solar-hyperbolic trajectories implying that they are arriving from interstellar space. Socrates & Draine (2009) discussed the detectability of very large interstellar grains of 1 mm (“pebble”) through optical scattered light halos.
5 Summary
The mid-IR extinction curves of a wide variety of interstellar regions (including both diffuse and dense environments) exhibit a flat or “gray” behavior in the wavelength region of 3–8. This flat mid-IR extinction is hardly accounted for by the standard MRN silicate-graphite dust model. To explain the flat mid-IR extinction, we have considered various dust sizes and species, including amorphous silicate, graphite, amorphous carbon, and iron spheres. we find that m-sized amorphous carbon dust best fits the flat mid-IR extinction. The observed extinction from the UV to the mid-IR could be closely reproduced by a mixture of submicrometer-sized amorphous silicate dust, submicrometer-sized graphitic dust, and micrometer-sized amorphous carbon dust. However, this mixture requires a solid-phase C abundance of C/H 352 ppm, considerably exceeding what could be available in the ISM.
Acknowledgements
We thank J. Gao, A. Mishra, and the anonymous referees for helpful comments/suggestions. We are supported in part by NSFC 11373015 and 11173007, NSF AST-1109039, NASA NNX13AE63G, and the University of Missouri Research Board.
References
- Allamandola et al. (1985) Allamandola, L.J., Tielens, A.G.G.M., Barker, J.R., 1985. Polycyclic Aromatic Hydrocarbons and the Unidentified Infrared Emission Bands – Auto Exhaust along the Milky Way. Astrophys. J. Lett. 290, L25-L28.
- Ascenso et al. (2013) Ascenso, J., Lada, C.J., et al., 2013. The Mid-Infrared Extinction Law in the Darkest Cores of the Pipe Nebula. Astron. Astrophys. 549, A135-A142.
- Asplund et al. (2009) Asplund, M., Grevesse, N., et al., 2009. The Chemical Composition of the Sun. Annu. Rev. Astron. Astrophys. 47, 481-522.
- Bertoldi et al. (1999) Bertoldi, F., Timmermann, R., Rosenthal, D., et al., 1999. Detection of HD in the Orion Molecular Outflow. Astrophys. J. 346, 267-277.
- Cambrésy et al. (2011) Cambrésy, L., Rho, J., Marshall, D.J., Reach, W.T., 2011. Variation of the Extinction Law in the Trifid Nebula. Astron. Astrophys. 527, A141-A150.
- Cardelli et al. (1989) Cardelli, J.A., Clayton, G.C., Mathis, J.S., 1989. The Relationship between Infrared, Optical, and Ultraviolet Extinction. Astrophys. J. 345, 245-256.
- Cardelli et al. (1996) Cardelli, J.A., Meyer, D.M. et al., 1996. The Abundance of Interstellar Carbon. Astrophys. J. 467, 334-340.
- Chapman et al. (2009) Chapman, N. L., Mundy, L. G., Lai, S.-P., et al., 2009. The Mid-Infrared Extinction Law in the Ophiuchus, Perseus, and Serpens Molecular Clouds. Astrophys. J. 690, 496-511.
- Draine & Lee (1984) Draine, B.T., Lee, H.M., 1984. Optical Properties of Interstellar Graphite and Silicate Grains. Astrophys. J. 285, 89-108.
- Draine (1989) Draine, B.T., 1989. Interstellar Extinction in the Infrared, in: Böhm-Vitense, E. (Ed.), Infrared Spectroscopy in Astronomy, ESA Special Publ. pp. 93-98.
- Draine (2003) Draine, B.T., 2003. Interstellar Dust Grains. Annu. Rev. Astron. Astrophys. J. 41, 241-289.
- Draine (2011) Draine, B.T., 2011. Physics of the Interstellar and Intergalactic Medium. Princeton University Press
- Dwek (2004) Dwek, E., 2004. Galactic Center Extinction: Evidence of Metallic Needles in the General Interstellar Medium. Astrophys. J. Lett. 611, L109-L112.
- Dwek (1997) Dwek, E., 1997. Can Composite Fluffy Dust Particles Solve the Interstellar Carbon Crisis? Astrophys. J. 484, 779-784.
- Flaherty et al. (2007) Flaherty, K. M., Pipher, J. L., Megeath, S. T., et al., 2007. Infrared Extinction toward Nearby Star-Forming Regions. Astrophys. J. 663, 1069-1082.
- Fritz et al. (2011) Fritz, T. K., Gillessen, S., et al., 2011. Line Derived Infrared Extinction toward the Galactic Center. Astrophys. J. 737, 73-93.
- Gao et al. (2009) Gao, J., Jiang, B.W., Li, A., 2009. Mid-Infrared Extinction and its Variation with Galactic Longitude. Astrophys. J. 707, 89-102.
- Gao et al. (2013a) Gao, J., Jiang, B. W., Li, A., Xue, M.Y., 2013a. The Mid-infrared Extinction Law in the Large Magellanic Cloud. Astrophys. J. 776, 7-19.
- Gao et al. (2013b) Gao, J., Li, A., Jiang, B. W., 2013b. Modeling the Infrared Extinction toward the Galactic Center. Earth, Planets, & Space 65, 1127-1132.
- Gilman (1969) Gilman, R. C., 1969. On the Composition of Circumstellar Grains. Astrophys. J. 155, L185-L187.
- Hoyle & Wickramasinghe (1962) Hoyle, F., & Wickramasinghe, N. C., 1962. On Graphite Particles as Interstellar Grains. Mon. Not. R. Astron. Soc., 124, 417-433.
- Hoyle et al. (1968) Hoyle, F., Wickramasinghe, N. C., & Reddish, V. C., 1968. Solid Hydrogen and the Microwave Background. Nature. 218, 1124-1126.
- Hoyle & Wickramasinghe (1969) Hoyle, F., & Wickramasinghe, N. C., 1969. Interstellar Grains. Nature. 223, 459-462.
- Indebetouw et al. (2005) Indebetouw, R., Mathis, J.S., Babler, B.L., et al., 2005. The Wavelength Dependence of Interstellar Extinction from 1.25 to 8.0 Using GLIMPSE Data. Astrophys. J. 619, 931-938.
- Jiang et al. (2006) Jiang, B.W., Gao, J., Omont, A., Schuller, F., Simon, G., 2006. Extinction at 7 and 15 from the ISOGAL Survey. Astron. Astrophys. 446, 551-560.
- Jones et al. (2013) Jones, A.P., Fanciullo, L., et al., 2013. The Evolution of Amorphous Hydrocarbons in the ISM: Dust Modelling from a New Vantage Point. Astron. Astrophys. 558, A62-A81.
- Kamijo (1963) Kamijo, F., 1963. A Theoretical Study on the Long Period Variable Star, III. Formation of Solid or Liquid Particles in the Circumstellar Envelope. Publ. Astron. Soc. Japan. 15, 440-448.
- Kim et al. (1994) Kim, S. H., Martin, P.G., Hendry, P.D., 1994. The Size Distribution of Interstellar Dust Particles as Determined from Extinction. Astrophys. J. 422, 164-175.
- Knacke et al. (1969) Knacke, R. F., Gaustad, J. E., et al., 1969. A Possible Identification of Interstellar Silicate Absorption in the Infrared Spectrum of 119 Tauri. Astrophys. J. 155, L189-L192.
- Krüger et al. (2007) Krüger, H., Landgraf, M. Altobelli, N., et al., 2007. Interstellar Dust in the Solar System. Space Sci. Rev. 130, 401-408.
- Landgraf et al. (2000) Landgraf, M., Baggaley, W.J., et al., 2000. Aspects of the Mass Distribution of Interstellar Dust Grains in the Solar System from in situ Measurements. J. Geophys. Res., 105, 10343-10352.
- Léger & Puget (1984) Léger, A., Puget, J.L., 1984. Identification of the ‘Unidentified’ IR Emission Features of Interstellar Dust? Astrophys. J. 137, L5-L8.
- Li & Greenberg (1997) Li, A., Greenberg, J.M., 1997. A Unified Model of Interstellar Dust. Astron. Astrophys. 323, 566-584.
- Li & Draine (2001) Li, A., Draine, B.T., 2001. Infrared Emission from Interstellar Dust. II. The Diffuse Interstellar Medium. Astrophys. J. 554, 778-802.
- Li (2003) Li, A., 2003. Cosmic Needles versus Cosmic Microwave Background Radiation. Astrophys. J. 584, 593-598.
- Li (2005) Li, A., 2005. Can Fluffy Dust Alleviate the Subsolar Interstellar Abundance Problem? Astrophys. J. 622, 965-969.
- Lodders (2003) Lodders, K., 2003. Solar System Abundances and Condensation Temperatures of the Elements. Astrophys. J. 591, 1220-1247.
- Lutz et al. (1999) Lutz, D., 1999. ISO Observations of the Galactic Centre, in: Cox, P., Kessler, M. (Eds.), The Universe as Seen by ISO, ESA Special Publ. p. 623-626.
- Lutz et al. (1996) Lutz, D., Feuchtgruber, H., Genzel, R. et al., 1996. SWS Observations of the Galactic Center. Astron. Astrophys. 315, L269-L272.
- Mathis et al. (1977) Mathis, J.S., Rumpl, W., Nordsieck, K.H., 1977. The Size Distribution of Interstellar Grains. Astrophys. J. 217, 425-433.
- Mathis et al. (1996) Mathis, J.S., 1996. Dust Models with Tight Abundance Constraints. Astrophys. J. 472, 643-655.
- McClure (2009) McClure, M. 2009. Observational 5–20 Interstellar Extinction Curves toward Star-Forming Regions Derived from Spitzer IRS Spectra. Astrophys. J. 693, L81-L85.
- McFadzean et al. (1989) McFadzean, A.D., Whittet, D.C.B., Bode, M. F., et al., 1989. Infrared Studies of Dust and Gas towards the Galactic Centre: 3–5 Micron Spectroscopy. Mon. Not. R. Astron. Soc. , 241, 873-882.
- Mennella (2002) Mennella, V., Brucato, J.R., Colangeli, L., et al., 2002. CH Bond Formation in Carbon Grains by Exposure to Atomic Hydrogen: The Evolution of the Carrier of the Interstellar 3.4 Micron Band. Astrophys. J. 569, 531-540.
- Nieva & Przybilla (2012) Nieva, M.F., Przybilla. N., 2012. Present-Day Cosmic Abundances. A Comprehensive Study of Nearby Early B-type Stars and Implications for Stellar and Galactic Evolution and Interstellar Dust Models. Astron. Astrophys. 539, 143-199.
- Nishiyama et al. (2009) Nishiyama, S., Tamura, M., Hatano, H., et al., 2009. Interstellar Extinction Law toward the Galactic Center III: J, H, KS Bands in the 2MASS and the MKO Systems, and 3.6, 4.5, 5.8, 8.0 in the Spitzer/IRAC System. Astrophys. J. 696, 1407-1417.
- Pendleton & Allamandola (2002) Pendleton, Y.J., Allamandola, L.J., 2002. The Organic Refractory Material in the Diffuse Interstellar Medium: Mid-Infrared Spectroscopic Constraints. Astrophys. J. Suppl. Ser. 138, 75-98.
- Przybilla et al. (2008) Przybilla. N., Nieva, M.F., Butler, K., 2008. A Cosmic Abundance Standard: Chemical Homogeneity of the Solar Neighborhood and the ISM Dust-Phase Composition. Astrophys. J. Lett. 688, L103-L106.
- Rieke & Lebofsky (1985) Rieke, G.H., Lebofsky, M.J., 1985. The Interstellar Extinction Law from 1 to 13. Astrophys. J. 288, 618-621.
- Zuniga et al. (2007) Román-Zúñiga, C. G., Lada, C. J., Muench, A., Alves, J. F., 2007, The Infrared Extinction Law at Extreme Depth in a Dark Cloud Core, Astrophys. J. 664, 357-362.
- Rosenthal et al. (2000) Rosenthal, D., Bertoldi, F., Drapatz, S., 2000. ISO-SWS Observations of OMC-1: H2 and Fine Structure Lines. Astron. Astrophys. 356, 705-723.
- Rouleau & Martin (1991) Rouleau, F., Martin, P.G., 1991. Shape and Clustering Effects on the Optical Properties of Amorphous Carbon. Astrophys. J. 377, 526-540.
- Snow & Witt (1996) Snow, T.P., Witt, A.N., 1996. Interstellar Depletions Updated: Where All the Atoms Went? Astrophys. J. Lett. 468, L65-68.
- Socrates & Draine (2009) Socrates, A., Draine, B.T., 2009. Brilliant Pebbles: A Method for Detection of Very Large Interstellar Grains. Astrophys. J. 702, L77-L81.
- Sofia & Meyer (2001) Sofia, U.J., Meyer, D.M., 2001. Interstellar Abundance Standards Revisited. Astrophys. J. Lett. 554, L221-L224.
- Sofia et al. (2004) Sofia, U.J., Lauroesch, J.T., et al., 2004. Interstellar Carbon in Translucent Sight Lines. Astrophys. J. 605, 272-277.
- Sofia et al. (2011) Sofia, U.J., Parvathi, V.S., et al., 2011. Determining Interstellar Carbon Abundances from Strong-Line Transitions. Astrophys. J. 141, 22-27.
- Taylor et al. (1996) Taylor, A.D., Baggaley, W.J., Steel, D.I., 1996. Discovery of Interstellar Dust Entering the Earth’s Atmosphere. Nature. 380, 323-325.
- Wang et al. (2013) Wang, S., Gao, J., Jiang, B.W., Li, A., Chen, Y., 2013. The Mid-Infrared Extinction Law and its Variation in the Coalsack Nebula. Astrophys. J. 773, 30-45.
- Wang et al. (2014) Wang, S., Jiang, B.W., Li, A., 2014. in preparation.
- Weingartner & Draine (2001) Weingartner, J.C., Draine, B.T., 2001. Dust Grain-Size Distributions and Extinction in the Milky Way, Large Magellanic Cloud, and Small Magellanic Cloud. Astrophys. J. 548, 296-309. (WD01)
- Wickramasinghe & Nandy (1970) Wickramasinghe, N. C., & Nandy, K., 1970. Interstellar Extinction by Graphite, Iron and Silicate Grains. Nature. 227, 51-53.
- Wickramasinghe et al. (1975) Wickramasinghe, N. C., Edmunds, M., et al., 1975. A Dust Model for the Cosmic Microwave Background. Astrophys. Space Sci. 35, L9-L13.
- Woolf & Ney (1969) Woolf, N. J., & Ney, E. P., 1969. Circumstellar Infrared Emission from Cool Stars. Astrophys. J. 155, L181-L184.
- Zasowski et al. (2009) Zasowski, G., Majewski, S.R., Indebetouw, R., et al., 2009. Lifting the Dusty Veil with Near- and Mid-Infrared Photometry. II. A Large-Scale Study of the Galactic Infrared Extinction Law. Astrophys. J. 707, 510-523.
- Zubko et al. (2004) Zubko, V., Dwek, E., Arendt, R.G., 2004. Interstellar Dust Models Consistent with Extinction, Emission, and Abundance Constraints. Astrophys. J. Suppl. Ser. 152, 211-249.