Light Echoes from Carinae’s Great Eruption: Spectrophotometric Evolution and the Rapid Formation of Nitrogen-rich Molecules11affiliation: This paper includes data gathered with the 6.5 meter Magellan telescope at Las Campanas Observatory, Chile.
Abstract
We present follow-up optical imaging and spectroscopy of one of the light echoes of Carinae’s 19th-century Great Eruption discovered by Rest et al. (2012a). By obtaining images and spectra at the same light echo position between 2011 and 2014, we follow the evolution of the Great Eruption on a three-year timescale. We find remarkable changes in the photometric and spectroscopic evolution of the echo light. The -band light curve shows a decline of mag in year after the peak observed in early 2011 and a flattening at later times. The spectra show a pure-absorption early G-type stellar spectrum at peak, but a few months after peak the lines of the Ca II triplet develop strong P-Cygni profiles and we see the appearance of [Ca II] 7291,7324 doublet in emission. These emission features and their evolution in time resemble those observed in the spectra of some Type IIn supernovae and supernova impostors. Most surprisingly, starting days after peak brightness, the spectra show strong molecular transitions of CN at Å. The appearance of these CN features can be explained if the ejecta are strongly Nitrogen enhanced, as is observed in modern spectroscopic studies of the bipolar Homunculus nebula. Given the spectroscopic evolution of the light echo, velocities of the main features, and detection of strong CN, we are likely seeing ejecta that contributes directly to the Homunculus nebula.
1 Introduction
Carinae ( Car) is one of the most well observed and, at the same time, mysterious and poorly understood objects in the night sky (e.g., Davidson & Humphreys, 2012, and references therein). At a distance of kpc (Smith, 2006) in the young cluster Trumpler 16 in the Carina nebula, Car is a very luminous and massive evolved star ( L⊙, M⊙; e.g., Hillier et al. 2001), a high mass-loss Luminous Blue Variable (LBV), in an eccentric binary system (Damineli, 1996). The system is surrounded by a dusty, massive ( M⊙, Smith et al. 2003) bipolar nebula, the Homunculus nebula, that was ejected years ago in the Great Eruption (Currie et al., 1996; Smith & Gehrz, 1998; Morse et al., 2001).
The Great Eruption (GE) of Car in the mid-1800s () was a spectacular astronomical event, a bright and energetic transient visible to the naked eye that was observed and registered by many (e.g., Herschel, 1847). Although we do not understand the physical mechanism that caused Car’s GE, it is used as a standard reference for understanding episodic mass-loss in very massive stars (e.g., Smith, 2014), LBVs (e.g., Humphreys & Davidson, 1994), supernova impostors (e.g., Humphreys et al., 1999; Van Dyk et al., 2002; Maund et al., 2006; Smith et al., 2011; Kochanek et al., 2012), and the most luminous supernovae (e.g., Smith et al., 2007). Yet, until recently we only knew it through visual estimates of its brightness and color, due to the technological limitations at the time of this event (Frew, 2004; Smith & Frew, 2011).
The recent discovery of Car’s light echoes (LEs) by Rest et al. (2012a, hereafter R12a) now gives us the opportunity to re-observe the multiple brightening events of Car in the mid-1800s with modern instrumentation and from multiple directions (Rest et al., 2012b), similar to what has been done for ancient supernovae in the LMC (Rest et al., 2005b, 2008a), SN 1987A (Sinnott et al., 2013), Cas A (Rest et al., 2008b; Krause et al., 2008a; Rest et al., 2011a, b), and Tycho (Rest et al., 2008b; Krause et al., 2008b). In R12a we presented initial imaging and spectroscopy of one of the brightest LEs of Car which showed its unambiguous association with one of the brightenings during the GE instead of the smaller eruption of circa 1890 (Humphreys et al., 1999). The spectra of this LE obtained in early 2011 showed pure absorption lines consistent with supergiants with spectral type G2G5 ( K) and line velocities of km s-1.
In this letter, we present three years of imaging and spectroscopic follow-up observations of the light echo of Car’s GE discovered by R12a. In Section §2 we discuss the observations and data reduction. In Section §3 we present the results and analysis of the light curve and spectra. We discuss our results in Section §4.
2 Observations
2.1 Imaging
We observed the field of the Carinae LE from R12a at many epochs between 2011 and 2014. Imaging was obtained with a variety of telescopes and instruments, including: the MOSAIC II and DECam wide-field cameras mounted on the Blanco 4m telescope at Cerro Tololo Inter-American Observatory (CTIO), the direct CCD camera mounted on the Swope 1m telescope at Las Campanas Observatory (LCO), the Spectral CCD camera mounted on the FTS 2m telescope at the Las Cumbres Observatory Global Telescope Network (LCOGT) Siding Spring site (Brown et al., 2013), the SOAR Optical Imager mounted on the SOAR 4m telescope at the Cerro Pachón, the Inamori-Magellan Areal Camera and Spectrograph (IMACS; Dressler et al., 2011), and the LDSS 3 mounted on the Magellan Baade 6.5m telescope at LCO. Most of the images were obtained using the SDSS -band filter, with some epochs obtained using the SDSS filters, most of which were obtained with DECam.
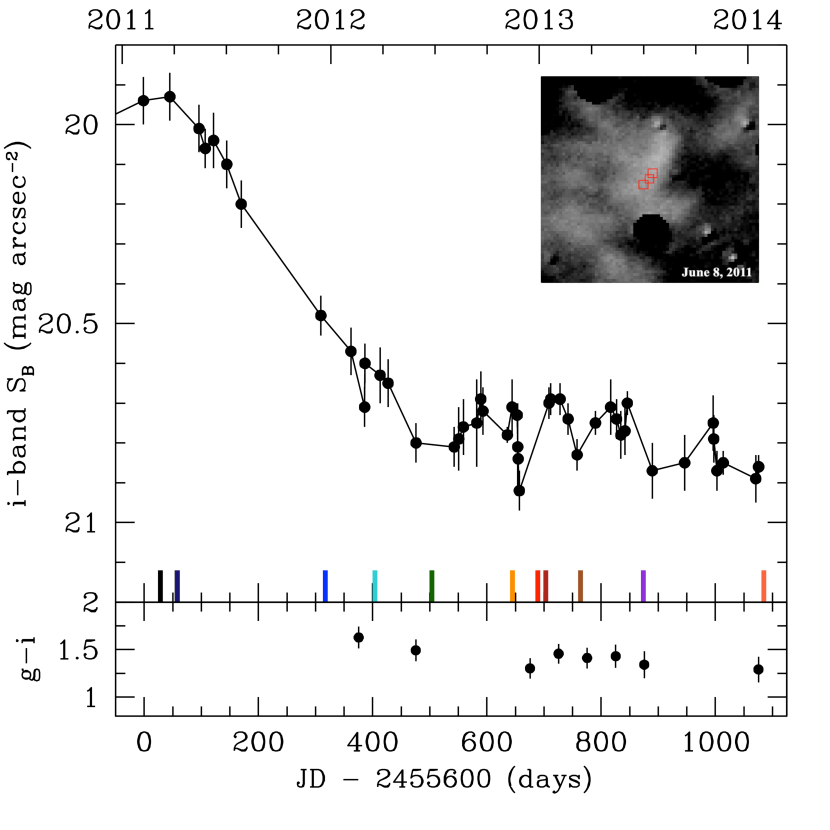
Standard image reduction was performed on all the images, including bias/overscan subtraction and flat-fielding using skyflats and domeflats. We then ran a difference imaging analysis using the photpipe pipeline (Rest et al., 2005a) that has been used to discover and analyze the light echoes of historical supernovae (e.g., Rest et al., 2005b, 2008b) and Car (R12a). This pipeline produces difference images that are very clean of point sources and allow us to accurately measure the diffuse variable flux of the echo. We used three pixel () boxes centered on the position of the LE (RA = 10:44:11.886, DEC = 60:16:00.6, J2000.0), and along the position angle of the slit used for the spectra (PA = 339 deg), to extract the difference flux light curve. These fluxes were transformed into the DECam AB magnitude system using observations of SDSS standards obtained in January 2014. The light curve and mean color evolution are shown in Figure 1. A complete analysis of the imaging data and light curves will be presented in Bianco et al. (2014, in prep.).
2.2 Spectroscopy
We obtained several low-resolution () single-slit optical spectra at the LE position between March 2011 and January 2014. The spectra were obtained with several instruments, including: IMACS mounted on the Magellan Baade 6.5m telescope at LCO, WFCCD mounted on the du Pont 2.5m telescope at LCO, and the Gemini Multi-Object Spectrograph (GMOS) mounted on the Gemini South 8m telescope at the Gemini Observatory (programs GS-2012B-Q-57, GS-2013A-Q-11, GS-2013B-Q-19). Nod-and-shuffle techniques (Glazebrook & Bland-Hawthorn, 2001) were used with GMOS to improve sky subtraction.
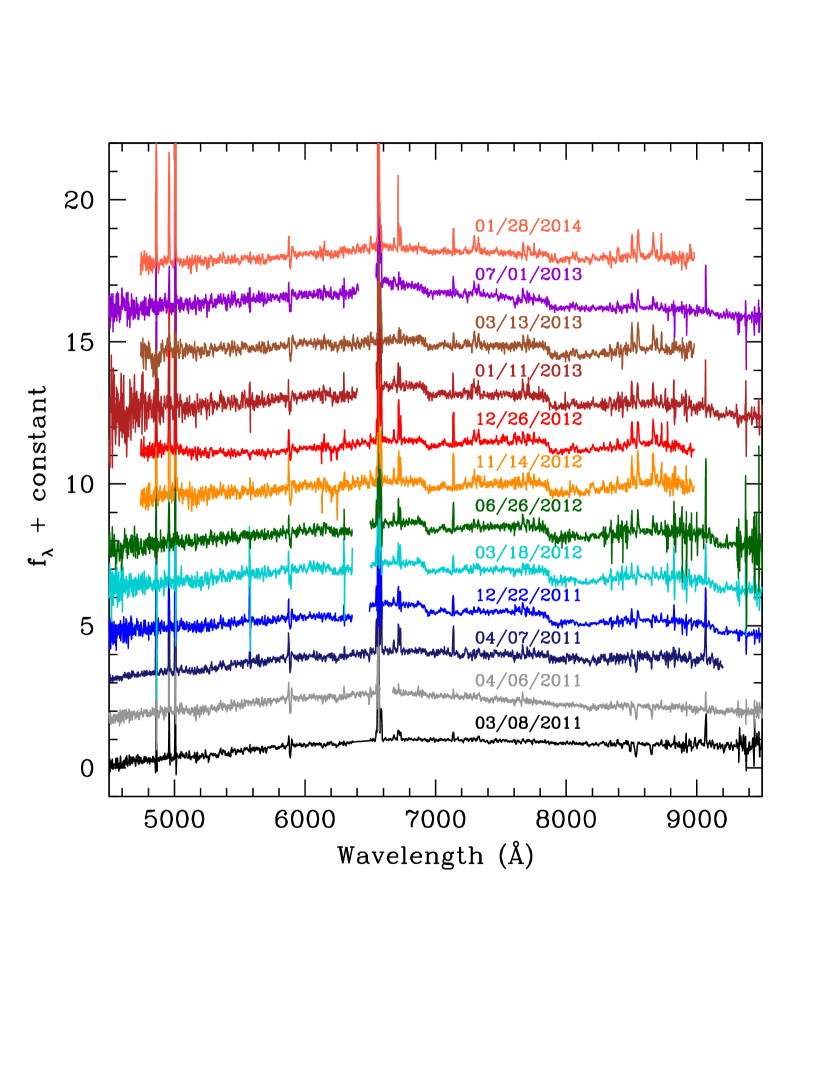
We reduced the IMACS and WFCCD spectra using the LA-Cosmic software (van Dokkum, 2001) and standard routines in IRAF ccdred, twodspec and onedspec packages. The first IMACS spectrum was reduced using custom IDL scripts (see R12a). The GMOS spectra were reduced using the IRAF gemini package and custom IDL scripts. All the spectra were wavelength calibrated with an arc-lamp obtained before or after the science exposures, and flux calibrated using a spectrophotometric standard observed the same night. The 1D spectra were extracted at a consistent position and with a spatial extraction window of along the slit to increase the signal-to-noise. We applied a telluric correction to all the spectra that was extracted from the spectrophotometric standard star observation. Figure 2 shows the spectral time sequence of Car’s LE.
3 Results and Analysis
3.1 Light Curve Evolution
As we showed in R12a, the LE studied here is associated with Car’s GE because the total increase in magnitude observed between 2003 and 2011 was mag, which is inconsistent with the lesser eruption of circa 1890. The light curve of Car’s LE presented in Figure 1 shows the observations obtained between February 2011 and January 2014, a follow-up campaign started after its discovery. The light curve has a peak between UT February 6 and March 23 2011 at -band surface brightness of mag arcsec-2. After peak, it steadily declined by mag in the first days. The mean color of the light echo of mag does not change significantly during our observations.
At late times ( days past peak), after May 2012, there is a significant flattening in the light curve and the LE stays at a constant -band surface brightness of mag arcsec-2 until our latest observations obtained in January 2014. In R12a we concluded that this LE was most likely associated with the 1843 outburst observed in the historical light curve (e.g., Smith & Frew, 2011). However, given the flat light curve at late times and absence of a re-brightening thus far, which was observed in the historical light curve in 1845, this now seems very unlikely. At present, the light curve of this LE is more consistent with the 1838 peak or even the 1845 peak, but continuing photometric follow-up should give us a more definite answer in the next few years. This LE light curve definitively rules out the lesser eruption of circa 1890, which lasted years (e.g., Humphreys et al., 1999; Smith & Frew, 2011).
3.2 Spectroscopic Evolution
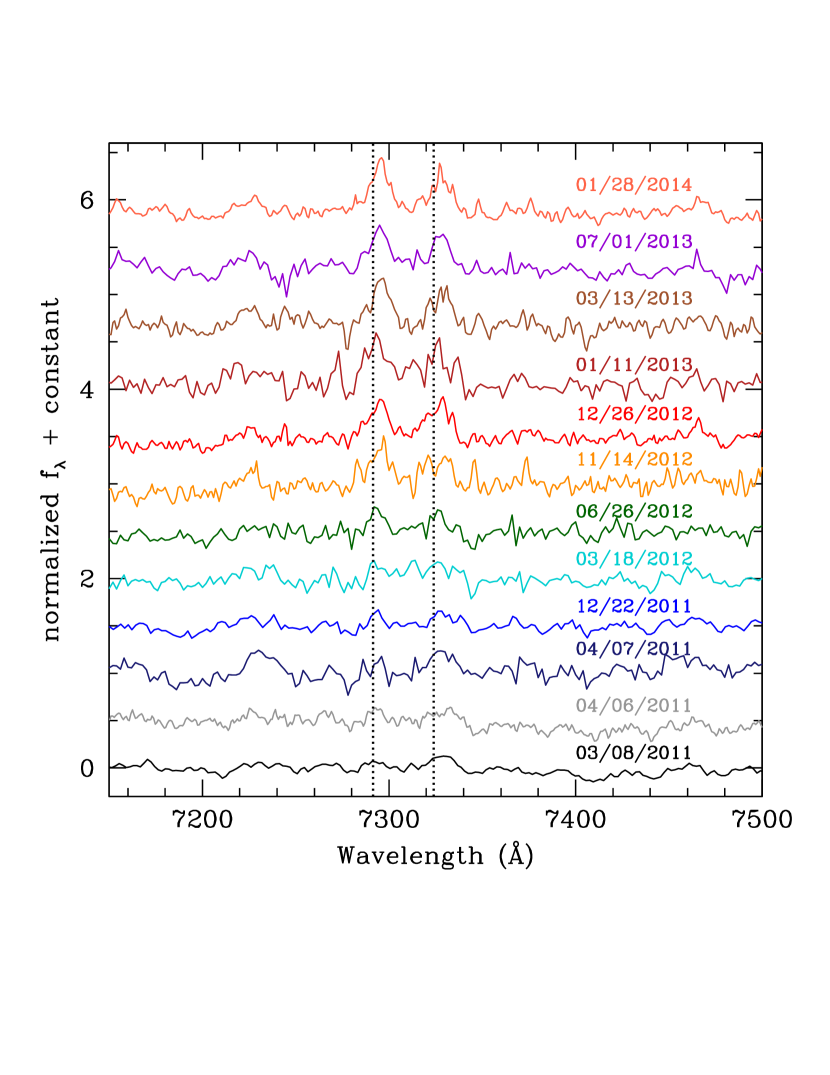
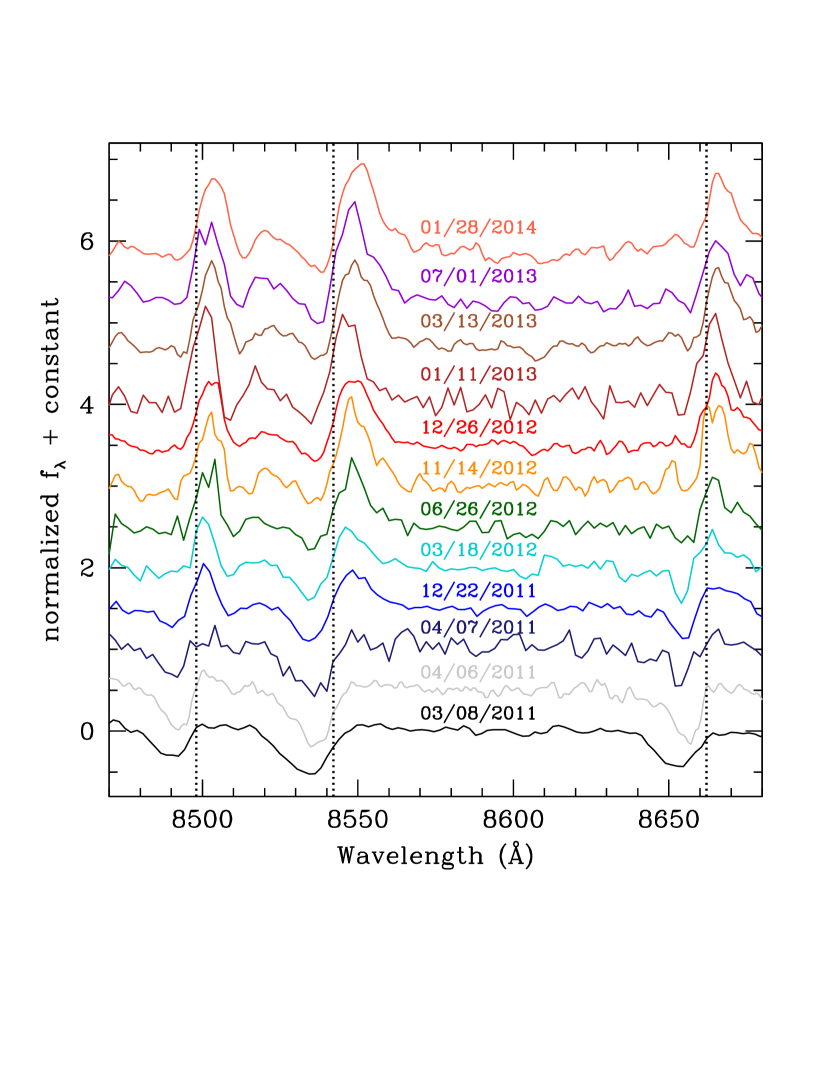
The evolution of the LE spectra is shown in Figures 2 and 3. The first spectra of the echo obtained around peak brightness in March-April 2011 are dominated by absorption lines111All the strong emission lines observed in the spectra (Balmer lines, [O III], [N II], [S II], and [Ar III]) are from the surrounding nebula. characteristic of G2G5 type supergiants (R12a). However, at later times (starting December 2011, days after peak) the lines of the Ca II triplet have developed strong P-Cygni profiles (see Figure 3) with resolved absorption and emission components ( km s-1), characteristic of an expanding photosphere. The emission line components of the Ca II triplet become stronger compared to the absorption at even later epochs. Also, starting in the spectrum obtained on June 2012 ( days after peak) we see the appearance of the [Ca II] 7291,7324 forbidden doublet in emission. Despite the presence of the resolved Ca II lines in emission, we do not see a broad H line component at any time. We note that such a component could easily be masked by the strong nebular lines of H and [N II] due to the low resolution of our spectra.
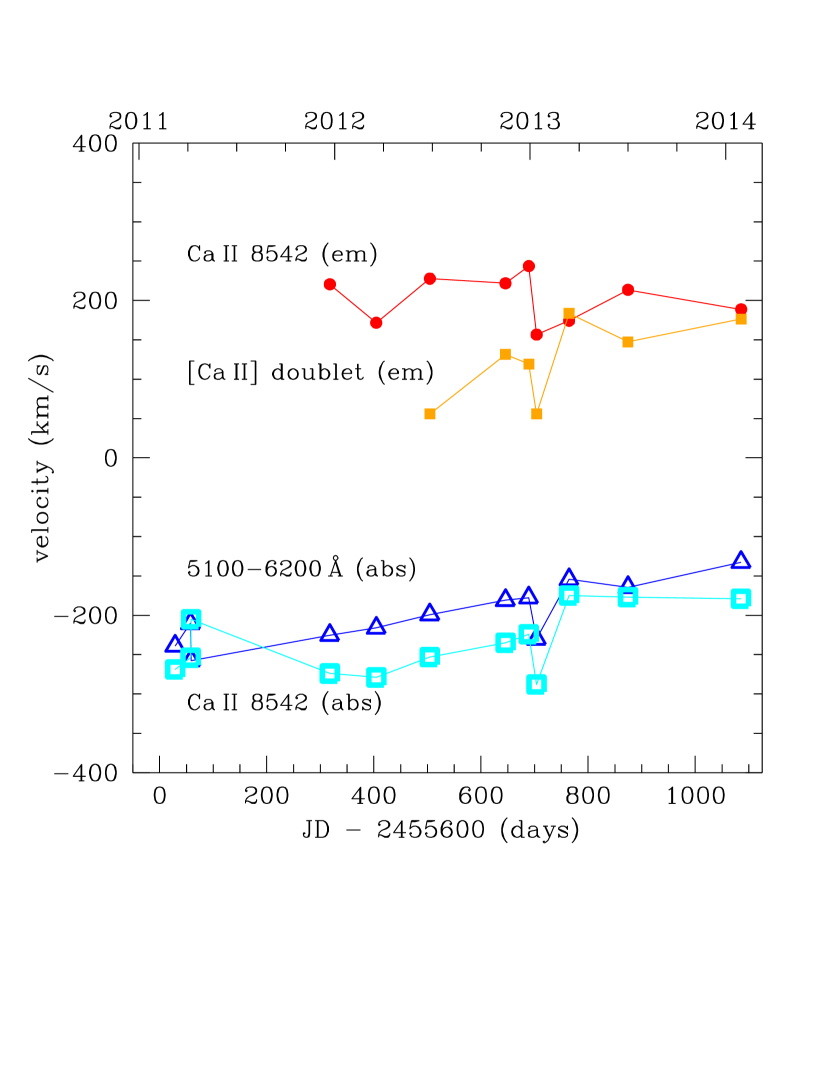
Figure 4 shows the velocities as a function of time of the most significant features in the spectra of the LE. We used cross-correlation techniques in IRAF with a set of stellar templates and also the spectral fitting code ULySS222http://ulyss.univ-lyon1.fr/ (Koleva et al., 2009) to estimate the velocities of the absorption-dominated part of the spectrum in the Å region. Both techniques gave consistent results, with mean velocity km s-1, where the uncertainty is the error in the mean. For the Ca II emission lines, we measured the position of the peak of the lines fitting a gaussian with splot in IRAF. The measured mean velocity of the Ca II 8542 Å line is km s-1 and for the [Ca II] doublet is km s-1. We also measure the velocity of the minimum of the absorption trough of the Ca II 8542 Å line, which gives a mean velocity km s-1. The shapes of the Ca II triplet absorption features in the first three spectra obtained March to April 2011 show a clear blue asymmetry, with the blue edge of the absorption feature extending to km s-1. The full line profiles at these epochs can be well fitted with the addition of two gaussian components with velocities of km s-1 ( Å) and km s-1 ( Å).
The defining characteristics of the late-time spectra of the LE are the strong, broad absorption features seen in the Å region (see Figure 2). These strong features appear in the spectrum obtained on December 2011 ( days after peak) and are present with similar strength in all the late-time spectra. Figure 5 shows a zoom-in of the red part of the spectrum obtained on December 2011, normalized at Å. The strong absorption features observed in the light echo spectra match the wavelengths of some of the rotation-vibration transitions of the CN molecule. These molecular bands, which resemble steps in the continuum between Å, are usually observed in the spectra of cool stars, such as carbon stars and red supergiants (e.g., White & Wing, 1978).
The top spectrum in Figure 5 shows a red supergiant (RSG) model spectrum from Lançon et al. (2007) with K, , and . In order to approximately match the strengths of the CN steps observed in the LE spectrum, we have multiplied the RSG model spectrum by a factor of 1.8 after subtracting the continuum normalized at Å. The strongest molecular bands identified in the light echo spectra are the following transitions in the CN red system (Pearse & Gaydon, 1976): (’,”) = (3,0) at Å, (4,1) at Å, (2,0) at Å, (3,1) at Å, and (1,0) at Å.
4 Discussion
We have presented three years of photometric and spectroscopic follow-up observations, from early 2011 to 2014, of the light echo of Car’s 19th century Great Eruption discovered by R12a. These observations give us a unique opportunity to study the evolution and physical properties of the GE in detail.
The detection of P-Cygni profiles and the observed velocities of the spectral features unambiguously link Car’s GE to luminous extragalactic transients associated with episodic mass-loss events in massive stars, as has been suggested in previous studies based on its historical light curve and the properties of the Homunculus nebula (e.g., Humphreys et al., 1999; Van Dyk et al., 2002; Smith et al., 2011; Smith, 2013). Indeed, the appearance and time evolution of strong Ca II triplet, from pure absorption features at peak to P-Cygni profiles to emission-dominated profiles at late times, and [Ca II] forbidden doublet in the spectra of Car’s light echo resemble the spectral properties and evolution of some Type IIn supernovae (SN 1994W, Dessart et al. 2009; SN 2011ht, Mauerhan et al. 2013) and supernova impostors (e.g., UGC 2773-OT, Smith et al., 2010).
The time evolution of the line profiles of the LE is broadly consistent with an optical depth effect in the ejecta, as seen in Type II SN. We can measure the electron density in the Ca II line-forming region using the ratio of intensities of the doublet to the triplet (Ferland & Persson, 1989). From the light echo spectra, we measure an intensity ratio of , roughly constant at different epochs. This gives an electron density in the range cm-3 for K. This high density is consistent with modeling of the spectra of the Type IIn SN 1994W (Dessart et al., 2009), which also shows a similar spectral evolution in the Ca II lines. However, we do not see in these LE spectra the broad H wings produced by electron scattering in Type IIn SN. The comparison to the SN impostor UGC 2773-OT is particularly relevant here because the FWHM of the H line ( km s-1) and its relative strength to the Ca II emission (Smith et al., 2010) are consistent with the non-detection of broad H features in Car’s light echo spectra.
Despite the similarities between some of the properties of Car’s LE spectra and SN impostors, there are important and interesting differences. As pointed out in R12a, the LE spectrum at peak is consistent with cool supergiants with late spectral type G2G5 ( K). This is cooler than all the published spectral analysis studies of SN impostors and LBV outbursts to date333For example, the coolest well-measured temperature of an LBV in outburst is that of R71 in the LMC, which had K in 2012 (Mehner et al., 2013)..
The new, late-time spectra of the LE (starting in the spectrum obtained days after peak) confirm this result. Spectral fitting of the blue part of the spectra using UlySS and cross-correlation with observed spectra of supergiants give K (Rest et al. 2014, in prep.). Furthermore, we detect strong CN molecular bands in the red part of the optical spectra, which are seen in the spectra of cool stars (e.g., carbon stars and RSGs) but are not expected to be formed in warmer stellar photospheres with K (e.g., Lançon et al., 2007). This indicates that the spectrum of the LE likely becomes cooler after the light curve peak and stays cool at late times.
The cool temperature of the LE at peak and at late times after peak are inconsistent with the most simple predictions from the opaque wind model for the GE (Davidson, 1987), and also very different from S-Doradus variations and some LBV giant eruptions (e.g., Smith et al., 2011). The model of the GE as an explosion and interaction with a strong pre-GE wind (Smith, 2013) appears to be more consistent with our observations. However, we note that further analysis and spectra of multiple light echoes as a function of time will be needed in order to directly test different GE models (e.g., Davidson, 1987; Soker, 2007; Smith, 2013).
The CN features detected in the LE spectra at late times are significantly stronger than expected from stellar atmosphere models for RSGs (see Figure 5). We could not find in the literature any observed spectra with stronger features, relative to the continuum, even among the carbon stars identified in SDSS (G. Knapp, private communication) and also among different types of massive star explosions and outbursts (SNe and SN impostors). This points to an abundance effect, in the sense that the material ejected in the GE is likely significantly rich in Nitrogen. This is consistent with the measured over-abundance of N in the Homunculus nebula, derived from ionized (e.g., Davidson et al., 1982; Dufour et al., 1997) and from molecular species (e.g., Smith et al., 2006; Loinard et al., 2012).
The spectroscopic evolution of the LE, the observed velocities of the Ca II features (which are consistent with the velocities of the Homunculus at similar latitudes presented in Smith 2006), and the strong CN features pointing to N enhancement, suggest that we are seeing ejecta that contributes directly to the Homunculus nebula.
References
- Brown et al. (2013) Brown, T. M., et al. 2013, PASP, 125, 1031
- Currie et al. (1996) Currie, D. G., et al. 1996, AJ, 112, 1115
- Damineli (1996) Damineli, A. 1996, ApJ, 460, L49+
- Davidson (1987) Davidson, K. 1987, ApJ, 317, 760
- Davidson & Humphreys (2012) Davidson, K., & Humphreys, R. M., eds. 2012, Astrophysics and Space Science Library, Vol. 384, Eta Carinae and the Supernova Impostors
- Davidson et al. (1982) Davidson, K., Walborn, N. R., & Gull, T. R. 1982, ApJ, 254, L47
- Dessart et al. (2009) Dessart, L., Hillier, D. J., Gezari, S., Basa, S., & Matheson, T. 2009, MNRAS, 394, 21
- Dressler et al. (2011) Dressler, A., et al. 2011, PASP, 123, 288
- Dufour et al. (1997) Dufour, R. J., Glover, T. W., Hester, J. J., Curie, D. G., van Orsow, D., & Walter, D. K. 1997, in Astronomical Society of the Pacific Conference Series, Vol. 120, Luminous Blue Variables: Massive Stars in Transition, ed. A. Nota & H. Lamers, 255
- Ferland & Persson (1989) Ferland, G. J., & Persson, S. E. 1989, ApJ, 347, 656
- Frew (2004) Frew, D. J. 2004, Journal of Astronomical Data, 10, 6
- Glazebrook & Bland-Hawthorn (2001) Glazebrook, K., & Bland-Hawthorn, J. 2001, PASP, 113, 197
- Herschel (1847) Herschel, Sir, J. F. W. 1847, Results of astronomical observations made during the years 1834, 5, 6, 7, 8, at the Cape of Good Hope; being the completion of a telescopic survey of the whole surface of the visible heavens, commenced in 1825
- Hillier et al. (2001) Hillier, D. J., Davidson, K., Ishibashi, K., & Gull, T. 2001, ApJ, 553, 837
- Humphreys & Davidson (1994) Humphreys, R. M., & Davidson, K. 1994, PASP, 106, 1025
- Humphreys et al. (1999) Humphreys, R. M., Davidson, K., & Smith, N. 1999, PASP, 111, 1124
- Kochanek et al. (2012) Kochanek, C. S., Szczygieł, D. M., & Stanek, K. Z. 2012, ApJ, 758, 142
- Koleva et al. (2009) Koleva, M., Prugniel, P., Bouchard, A., & Wu, Y. 2009, A&A, 501, 1269
- Krause et al. (2008a) Krause, O., Birkmann, S. M., Usuda, T., Hattori, T., Goto, M., Rieke, G. H., & Misselt, K. A. 2008a, Science, 320, 1195
- Krause et al. (2008b) Krause, O., Tanaka, M., Usuda, T., Hattori, T., Goto, M., Birkmann, S., & Nomoto, K. 2008b, Nature, 456, 617
- Lançon et al. (2007) Lançon, A., Hauschildt, P. H., Ladjal, D., & Mouhcine, M. 2007, A&A, 468, 205
- Loinard et al. (2012) Loinard, L., Menten, K. M., Güsten, R., Zapata, L. A., & Rodríguez, L. F. 2012, ApJ, 749, L4
- Mauerhan et al. (2013) Mauerhan, J. C., et al. 2013, MNRAS, 431, 2599
- Maund et al. (2006) Maund, J. R., et al. 2006, MNRAS, 369, 390
- Mehner et al. (2013) Mehner, A., Baade, D., Rivinius, T., Lennon, D. J., Martayan, C., Stahl, O., & Štefl, S. 2013, A&A, 555, A116
- Morse et al. (2001) Morse, J. A., Kellogg, J. R., Bally, J., Davidson, K., Balick, B., & Ebbets, D. 2001, ApJ, 548, L207
- Pearse & Gaydon (1976) Pearse, R. W. B., & Gaydon, A. G. 1976, The identification of molecular spectra
- Rest et al. (2011a) Rest, A., et al. 2011a, ApJ, 732, 3
- Rest et al. (2008a) ——. 2008a, ApJ, 680, 1137
- Rest et al. (2012a) ——. 2012a, Nature, 482, 375 (R12a)
- Rest et al. (2012b) Rest, A., Sinnott, B., & Welch, D. L. 2012b, PASA, 29, 466
- Rest et al. (2011b) Rest, A., Sinnott, B., Welch, D. L., Foley, R. J., Narayan, G., Mandel, K., Huber, M. E., & Blondin, S. 2011b, ApJ, 732, 2
- Rest et al. (2005a) Rest, A., et al. 2005a, ApJ, 634, 1103
- Rest et al. (2005b) ——. 2005b, Nature, 438, 1132
- Rest et al. (2008b) ——. 2008b, ApJ, 681, L81
- Sinnott et al. (2013) Sinnott, B., Welch, D. L., Rest, A., Sutherland, P. G., & Bergmann, M. 2013, ApJ, 767, 45
- Smith (2006) Smith, N. 2006, ApJ, 644, 1151
- Smith (2013) ——. 2013, MNRAS, 429, 2366
- Smith (2014) ——. 2014, ArXiv e-prints, 1402.1237
- Smith et al. (2006) Smith, N., Brooks, K. J., Koribalski, B. S., & Bally, J. 2006, ApJ, 645, L41
- Smith & Frew (2011) Smith, N., & Frew, D. J. 2011, MNRAS, 1097
- Smith & Gehrz (1998) Smith, N., & Gehrz, R. D. 1998, AJ, 116, 823
- Smith et al. (2003) Smith, N., Gehrz, R. D., Hinz, P. M., Hoffmann, W. F., Hora, J. L., Mamajek, E. E., & Meyer, M. R. 2003, AJ, 125, 1458
- Smith et al. (2007) Smith, N., et al. 2007, ApJ, 666, 1116
- Smith et al. (2011) Smith, N., Li, W., Silverman, J. M., Ganeshalingam, M., & Filippenko, A. V. 2011, MNRAS, 415, 773
- Smith et al. (2010) Smith, N., et al. 2010, AJ, 139, 1451
- Soker (2007) Soker, N. 2007, ApJ, 661, 490
- van Dokkum (2001) van Dokkum, P. G. 2001, PASP, 113, 1420
- Van Dyk et al. (2002) Van Dyk, S. D., Filippenko, A. V., & Li, W. 2002, PASP, 114, 700
- White & Wing (1978) White, N. M., & Wing, R. F. 1978, ApJ, 222, 209