Joint fitting reveals hidden interactions in tumor growth
Abstract
Tumor growth is often the result of the simultaneous development of two or more cancer cell populations. Their interaction between them characterizes the system evolution. To obtain information about these interactions we apply the recently developed vector universality (VUN) formalism to various instances of competition between tumor populations. The formalism allows us: (a) to quantify the growth mechanisms of a HeLa cell colony, describing the phenotype switching responsible for its fast expansion, (b) to reliably reconstruct the evolution of the necrotic and viable fractions in both in vitro and in vivo tumors using data for the time dependences of the total masses, and (c) to show how the shedding of cells leading to subspheroid formation is beneficial to both the spheroid and subspheroid populations, suggesting that shedding is a strong positive influence on cancer dissemination.
keywords:
Tumor growth , cancer populations , universality , spheroids1 Introduction
The development of multiple mathematical models in tumor biology results from their potential to describe and predict neoplastic growth and the effect of applied therapies. These models use both phenomenological and mechanistic descriptions of growth, whose success requires an understanding of cellular self-organization during the progress of the disease. In particular, empirical models are based on the observation that tumor growth results from cellular multiplication concomitant with processes that, in most cases, limit the size of the system.
Growth is described by extensive variables such as volume, mass, length, or number of cells, represented as functions of time. The growth of individual organisms (Laird et al., 1965), tumors (Bajzer et al., 1996), and other biological systems (Zwietering et al., 1990) is often well fitted by sigmoidal functions. Widely used empirical descriptions are those of Gompertz (Fujikawa and Matsushita, 1989) and von Bertalanffy-West (West et al., 2001); under certain conditions, Malthusian, i.e. exponential, functions are also used (Zwietering et al., 1996). These growth curves are very useful to interpret and measure various physical properties of the tumor, such as necrosis diameter and the volume increase rate in experimental systems (Mueller-Klieser, 2000), the pre-angiogenic network structure (Guiot et al., 2006), and the cell-cycle fraction as a function of time (Jiang et al., 2005), among others. Furthermore, there is a manifold of ad hoc models (Marusić et al., 1994; Mombach et al., 2002; de Vladar, 2006; Castorina et al., 2006; González and Rondón, 2006; Delsanto et al., 2008) that try to justify and unify these empirical descriptions in an attempt to reveal their common features.
Identifying correlations among phenomenological growth curves can shed light on the underlying biological processes responsible for tumor growth. It is therefore important to get accurate fitting functions in order to recover the greatest possible amount of information about the system. Since obtaining reliable data on growth is a difficult, onerous, and tedious task, the ability to recover information from a limited amount of data is an important goal for modelers. It is with this objective that we have developed a powerful fitting tool (Barberis et al., 2011), which can provide accurate fitting functions for diverse systems consisting of two or more individuals or populations growing together. As a bonus, the method is able to evince hidden interactions among the populations without any previous assumptions on their nature.
Except in its earliest stages, cancer is usually a multipopulation system: mutations appear and sometimes prevail, cells die and generate necrotic volumes, and even the cells in a primary tumor may compete with those in the colonized tissue. In this paper we show how information about cancer cell interactions can be extracted from growth curves. To do this we will consider diverse experimental systems: jointly growing cancer cell phenotypes, in vitro multicellular tumor spheroid growth (where live and dead cells may be thought of as competing), in vivo experimental implanted tumors, and a system in which spheroids and subspheroids evolve simultaneously.
Although fitting functions to cancer growth curves is a time-honored procedure to glean information about tumor properties, the VUN method goes far beyond, enabling us to extract information from the correlations between growth curves. This is done for the first time in this paper, where we investigate the correlated growth of two cancer cell subpopulations to characterize how their mutual interactions and their interactions with the environment affect their growth.
In Section 2 we briefly describe the Phenomenological Universalities (PUN) formalism introduced by Castorina et al. (2006) and extended to competing organisms and populations by Barberis et al. (2011) and Barberis and Condat (2012). Examples of the application of the PUN analysis to the aforementioned experiments are provided in Section 3, where we apply the procedure to several cancer growth data sets. A discussion of the results is presented in Section 4, where we comment on the applicability and limitations of the method.
2 Vector Universalities
The universal growth formalism for one-population systems is a systematic generalization, due to Delsanto’s group (Castorina et al., 2006), of the well-known growth functions of Malthus, Gompertz, and von Bertalanffy. In the following a brief description of the method is presented, starting with the one-population formalism (scalar equations) and then proceeding to its vector extension, which is suitable to describe the joint growth of two or more populations.
2.1 One-population growth equations.
A clear and comprehensive characterization of the growth functions for one-population systems was presented by de Vladar (2006), who described growth using two first-order differential equations, one for the population size ,
| (1) |
(the growth equation) and another for the growth rate ,
| (2) |
(the rate equation), where and are two real parameters. Various combinations of these parameters reproduce, among others, the -logistic, von Bertalanffy, Gompertz, and potential growth equations. de Vladar (2006) indicates that the size of the dimensionless parameter defines the density scale at which the reproduction rate of an individual is affected by its interaction with the population, while is a characteristic time over which the individual downregulates its reproduction rate.
In the work of Castorina et al. (2006), the right-hand side of equation (2) is replaced by a power series expansion in the rate ,
| (3) |
Of course, by truncation and a suitable choice of the parameters , Eq. (3) reduces to the different possibilities generated by Eq. (2), but Castorina et al. (2006) suggest that the concept of Phenomenological Universalities may be used in conjunction with Eqs. (1) and (3) as a tool for the classification and interpretation of observed data in the context of cross-disciplinary research. In fact, they have applied this concept to fields as diverse as those of elastodynamics (Pugno et al., 2008), human growth (Delsanto et al., 2008), and cell proliferation in cancer (Gliozzi et al., 2010). In Barberis et al. (2010), the use of complex variables and made it possible to investigate the simultaneous variations of two phenotypic features of an individual. This procedure showed the existence of correlations between changes in the fat distribution of the human body. The behavior of oscillatory coupled systems was also studied with this method (Delsanto et al., 2011).
2.2 Two or more populations: Vector formalism.
We are now interested in the description of the correlations between variations in the same trait of different agents. As in the problem treated by Castorina et al. (2006), the resulting generalization of the Phenomenological Universalities formulation is especially useful in those cases for which no reliable model is available.
We describe the time evolution of a given phenotypic feature observed in interacting agents through an -component growth vector , and postulate that the evolution of this vector is determined by a generalization of the autonomous growth equation proposed by Castorina et al. (2006),
| (4) |
where , the time, is a real continuous parameter, , and the dynamic operator . According to the PUN formulation, we assume that the rate of change of the functional can be expressed as a power series expansion in the operator itself, which we truncate to order ,
| (5) |
Equations (4) and (5) form a differential equation system whose initial conditions are and . It was shown in Barberis and Condat (2012) or, more rigorously, in Barberis et al. (2011), that the components of the vector can be written as:
| (6) |
where is the initial condition, and are the components of the matrices and that diagonalize (, with and diagonal), and the lowest order universal functions are given by,
| (7) | |||||
| (8) | |||||
| (9) |
Here the truncation order determines the Vector Universality class VUN for a multiple-agent system, in analogy with the PUN classes developed by Castorina et al. (2006) for a single agent. The VUN elements are linear combinations of the functions . Of course, the components depend on the universality class, but we omit the index for simplicity.
2.3 Interpretation.
The solutions (7), (8), and (9), which depend on the eigenvalues of the dynamical operator, correspond, respectively, to joint Malthusian (VU0), joint Gompertzian (VU1), and joint von Bertalanffian (VU2) growth processes. They apply to interacting agents and are natural generalizations of the functions obtained in Castorina et al. (2006) for the one-population problem.
Remarkably, the growth functions depend only on the dynamic operator , i.e., on at a fixed time (the initial condition), which results in the uncoupling of the system for all subsequent times. This indicates that the interaction dynamics can always be characterized by the elements of at all times. The diagonal elements of this matrix determine the maximum size corresponding to the non-interacting populations in a given environment and thus its trace characterizes the global potential growth of the independent agents. We can say that each diagonal element defines the individual growth potential (IGP) of the corresponding agent in a given environment. Interactions among populations not only generate nonzero off-diagonal elements (the direct interactions), but may also modify the diagonal elements. This would occur if there were indirect influences among the populations, as it would be the case if the populations themselves modify the growth environment and, consequently, change the corresponding matrix element. We can thus describe various kinds of -agent growth processes with real numbers, which allows us to quantify and classify various ecological-like interactions.
The information provided by the matrix after fitting can be summarized as follows: the direct interaction effects are represented by a combination of the signs and magnitudes of the off-diagonal matrix elements and determine how much an agent may gain (positive contribution) or lose (negative contribution) from the direct interaction. Then, for a parasitic interaction, one population grows at the expense of another (opposite signs), while for a cooperative (synergistic) interaction both agents benefit (positive signs) and for a mutual hindrance (antagonistic) interaction both agents are negatively affected (negative signs). The reciprocal of defines a time scale that characterizes the joint growth rate.
Some representative hypothetical situations in the VU0 and VU1 classes are shown in the Appendix for the case of two populations.
3 Methods and Results
In this section we show how to use the VUN formalism as a tool to fit data from a cancer-related system with two interacting cellular populations.
3.1 Exponential growth
Understanding the precise interplay of moving cells with other cells and their environment is crucial for central biological processes such as embryonic morphogenesis, wound healing, immune reactions, and tumor growth. As a consequence, a large number of mathematical models, using multiple different approaches, have already been proposed to describe various aspects of cell motion (Keller and Segel, 1971; Murray et al., 1983; Dallon et al., 2001; Byrne and Preziosi, 2003; Dolak and Schmeiser, 2005; Peruani and Morelli, 2007; Hatzikirou and Deutsch, 2008). In this section, we use experimental data to infer some features related to cancer cell migration, without any a priori assumptions or models.
As we pointed out in the preceding section, the single-agent case leads to simple exponential growth. However, already in the zeroth-order approximation VU0, which describes the growth of two or more interacting agents with infinite carrying capacity, new and more interesting situations arise: even if there is enough room and food for each individual agent to grow, VU0 describes how the interactions may lead to the stabilization and even the annihilation of one or more populations. In Appendix A we show some examples of how these situations can arise.
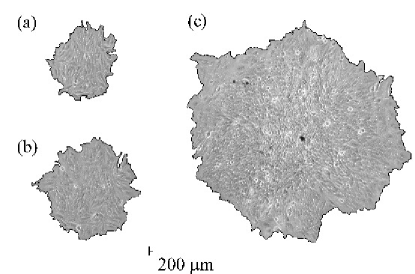
To illustrate VU0 growth in the cancer context, we use data sets obtained from HeLa cells in spreading colonies. These describe the correlated dynamic behavior of cells with different phenotypes: cells under cytokinesis (proliferative phenotype) or migrating cells (motile phenotype).To study the joint time evolution of those cells with different phenotypes, we made the follow-up of colonies from 4-10 cells up to about 1500 cells over 8-12 days. HeLa cells, passage 44-60 (a gift from Leloir Institute), were seeded into polystyrene Petri dishes (3.6 cm in diameter) from 2 ml of RPMI growth medium containing 1000-2000 cells/ml and incubated in an oven at 37 C in 5 % carbon dioxide and 97 % humidity. Cells were allowed to adhere and grow for 4-5 days forming small colonies of 4-10 cells. To maintain unchanged environmental conditions, half of the medium was changed every two days. Colony patterns were followed by optical microscopy by taking pictures every 15 hs. All cells in colonies either under cytokinesis or moving were counted. The former look bright and rounded and the latter have rather elongated shape as shown in Fig. 1. Eventually cell trajectories that characterize their motion were obtained from in situ cell colony digital images acquired by a time-lapse system at intervals in the range of 5-45 min. during 2–3 days. For this purpose, colonies were placed inside a chamber that was fixed to the microscope platform, and maintained at 37 ºC and 97 % humidity. In order to preserve the pH, the culture medium was changed to L-glutamine supplemented RPMI CO2-Independent Medium (Gibco, In-vitrogen Corp.) before placing each Petri dish into the chamber.
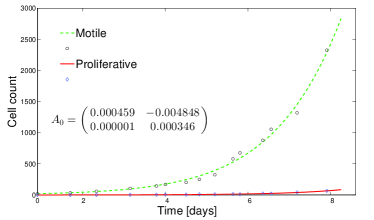
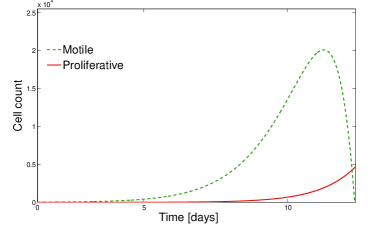
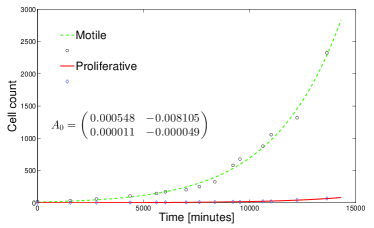
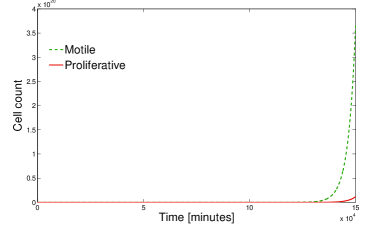
In Fig. 2a, the resulting counts for both populations are shown together with a possible VU0 fitting. Since the optimization problem has several local minima, care must be taken in the choice of the initial conditions for the fitting parameters. For instance, if we look at a restricted time interval, we could be tempted to accept the fitting in the figure, which really corresponds to a “wrong” (W) set of parameters. In this case, the fit would tell us that the initial population for the motile phenotype () cells is twice the experimental one, and that there are also some proliferative cells at (). Extrapolating to long times, W would predict an unlikely rapid decay of the motile population, as shown in Fig. 2b. Since the resulting matrix predicts a parasite-like interaction in favor of the proliferative population, the motile population cannot survive at very long times. On the other hand, a set of “correct” (C) parameters can be found that provides the fitting shown in Fig. 3a, which looks very similar to that in Fig. 2a but gives an adequate prediction for the initial populations (within a reasonable error). As it can be observed in Fig. 3b, the set C leads to a plausibly unrestricted growth of both populations at long times.
The set of parameters for both fittings is given in detail in Table I. Note that the statistical parameter is not a suitable criterion to discriminate between the C and W fits. In situations where there are no physical clues about the right parameter set, we must use more reliable criteria, such as Akaike’s (Burnham and Anderson, 2002) or the more complex Maximal Information Coefficient from Reshef et al. (2011).
| Correct | 0.000548 | -0.000049 | -0.008105 | 0.000011 |
|---|---|---|---|---|
| Wrong | 0.000459 | 0.000346 | -0.004848 | 0.000001 |
| Correct | 9.90 | -0.20 | 0.9918 | 0.9810 |
| Wrong | 20.19 | 0.40 | 0.9917 | 0.9855 |
The matrix obtained from the C fitting has , meaning that the number of cells with the motile phenotype is decreased by their interaction with the proliferative cells. Since motile cells can only replicate by changing their phenotype to proliferative, replicating and then changing again to motile, the motile population loses some cells in order to increase their number later. This decrease in the motile phenotype population corresponds to the temporary loss of those cells that stop for replication. On the other hand, , representing the increase in the proliferative population due to the transformation of motile cells.
The diagonal elements have opposite signs favoring the motile phenotype. The motile phenotype has , which tells us that there is a net positive feedback of its transformation into the reproductive phenotype. The net environmental conditions favor the transformation of reproductive cells into the energy-saving motile phenotype, making its population much bigger. The resulting population difference between phenotypes is in
The negative sign of suggests the presence of a signal originating in the proliferative cells that tells their motile counterparts that they should stop and reproduce. Cell behavior in this system reminds us of the “go or grow” hypothesis sometimes used to explain the onset of metastasis in gliomas and other cancers (Corcoran, 2003; Hatzikirou et al., 2012; Gerlee and Nelander, 2012; Garay et al., 2013). This hypothesis postulates that migration and proliferation are spatiotemporally mutually exclusive.
3.2 Multicellular Tumor Spheroids growth
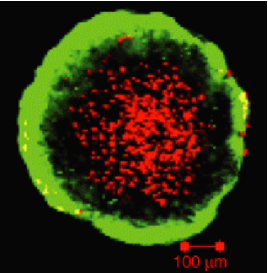
Multicellular Tumor Spheroids (MTS) are spherical clusters of tumor cells that may be grown in vitro under strictly controlled conditions (Hamilton, 1998; Mueller-Klieser, 2000). MTS experiments have led to new insights in cancer research. In particular, they have been useful to characterize the dependence of necrosis formation on the external environment (Freyer and Sutherland, 1988). During spheroid growth the fraction of proliferating cells decreases and the cells in the inner region become deprived of oxygen, glucose and other nutrients whereas metabolic waste accumulates, and the formation of a necrotic core is observed. In an advanced growth stage spheroids exhibit an outer viable rim (whose thickness ranges from about 100 to 250 m) that surrounds the necrotic core. The spheroid eventually attains a limiting size with a final diameter of - mm that Folkman and Hochberg (1973), attributed to the degradation of dead cells in the necrotic core Bertuzzi et al. (2010). An example of MTS is shown in Fig. 4, where the live cells in the outer rim appear as a green halo. The red mass inside belongs to the necrotic core.
The main advantages of the MTS are their simple spherical symmetry and the fact that they can be produced in large quantities. These characteristics make them popular both in mathematical modeling and in biological research: MTS provide an experimental biological model that has allowed researchers to determine protein expression McMahon et al. (2012); Gupta and Johansson (2012), check mathematical models Radszuweit et al. (2009); Bertuzzi et al. (2010); Kazmi et al. (2012), and study drug delivery to treat cancer disease Mehta et al. (2012); Gibot et al. (2013), to mention a few applications. The understanding of how MTS grow is indeed crucial to further comprehend some aspects of in vivo tumor progression.
We may start our study with the hypothesis postulated by Guiot and collaborators Guiot et al. (2003); Delsanto et al. (2004), who demonstrate that the growth of homogeneous spheroids can be fitted by the von Bertalanffy-West equation. Such a description was later generalized to spheroids with a necrotic core by Condat and Menchón (2006) and Menchón and Condat (2007), who added the proposal that the time evolution of the total mass of the spheroid, as function of its live cell mass , can be written as:
| (10) |
where is the mass at the onset to necrosis, and are the metabolic rates defined by West et al. (2001) and the exponent describes the diffusion-limited energy influx to the system via the transport of glucose and oxygen. The key to obtain Eq. (10) is the invariability of the thickness of the outer rim of live cells. This feature of the MTS was first described by Burton (1966), and later discussed by Groebe and Mueller-Klieser (1996). With the aim to go beyond these works, we add to equation (10) the time evolution of the dead mass as a function of the radius of the whole spheroid. Combining it with the onset-to-necrosis mass , we obtain the equation set:
| (11a) | ||||
| (11b) | ||||
| (11c) | ||||
which describes the time evolution of the dead and live cells populations after the onset of necrosis.
3.2.1 In vitro MTS.
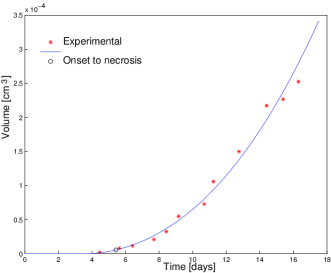
First we consider the experimental data of Freyer and Sutherland (1986), who created large numbers of MTS using EMT6/Ro cancer cells. They grew them at several oxygen and glucose concentrations in order to measure spheroid growth rates and the thickness of the outer rim as functions of MTS diameter. We will use the VU1 equations to ascertain the individual time dependences of the necrotic and live masses, which were not separately measured in the experiment. To do this, we first obtain the parameters and , using the value of reported by Freyer and Sutherland (1986) to fit their data with the numerical solution of Eq. (11a), as shown in Fig. 5a. We remark that not all of the data series reported in Freyer and Sutherland (1986) can be adequately fitted because Eqs. (11) are only valid after the onset of necrosis. In those experiments in which the necrosis starts later, there are not enough data points to provide an acceptable fit. The example presented here corresponds to the experiment with mM of glucose and mM of oxygen. Figure 5b shows the reconstruction of the time evolution of the populations by numerical integration of Eqs. (11c) and (11b). The fit yields the following values: g1/3/day; 1/day, and g. With these values of the parameters, the solutions of Eqs. (11) describe unrestricted growth at long times, which is not observed in the experiments.
If we observe Fig. 5a, we note that, at first sight, the data points suggest exponential growth. Freyer and Sutherland ascribed such rapid growth to the initial part of a Gompertz curve. To make the saturation visible, they presented the data using a semilog graph. This saturation of growth is always observed in an MTS, even if the cell cumuli are placed in a culture media with enough room and nutrients to grow indefinitely. The authors solved this apparent paradox by suggesting that the necrotic cells secret growth inhibitor substances that affect the live cells. More than a decade afterwards, Wartenberg et al. (1999), among others, experimentally confirmed this hypothesis. Because the action of such inhibitors is not taken into account in the deduction of Eqs. (11), their long-time predictions may not be accurate. But in the early development of the MTS described in the experiment, for which the necrotic core size is small, its inhibitory action is weak enough to allow for reliable data fitting with the solutions of Eqs. (11). However, this weak inhibitory effect suffices to eventually lead to saturation, an effect that is well described when VU1 is used to simultaneously fit both populations, as we show next.
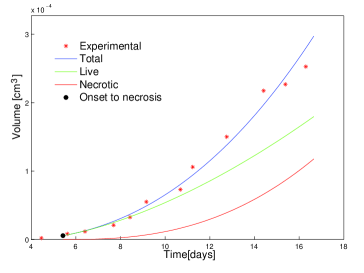
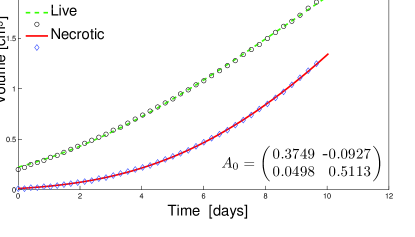
After using Eq. (11a) to obtain parameters and , synthetic data sets for the live and dead cell populations were obtained by numerical integration of Eqs. (11b) and (11c). We then used VU1 to simultaneously fit the time dependences of the two cell populations. The outcome of the fit, which is shown in Fig. 6a, is remarkably informative. First, since , the matrix predicts an inhibitory process of the growth of live cells due to the presence of a necrotic population. The necrotic population growth is favored by the live cells () because the death of the latter is the source of the former. The meaning of the diagonal terms is straightforward: because live cells generate more live cells and because dead cells generate more dead cells. Thus the VUN fitting provides further proof of the presence of an agent that is generated by dead cells and acts as both a growth inhibitor and a facilitator of cell death.
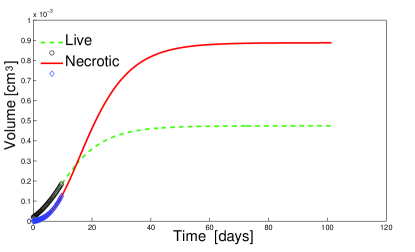
Furthermore, VU1 fitting predicts the saturation of the whole population (equations (11) do not). The predicted asymptotic volume is cm3. This value is three times lower than the one obtained by Mueller-Klieser (2000) for well-nourished tumors (cm3). The discrepancy presumably arises because the glucose concentration used in the experiment is half what Freyer and Sutherland consider optimal: mM instead of mM. We remark that the oxygen level ( mM), which is more essential, is at its optimum value. The predicted required time to reach the stationary regime, near days, is much longer than the time explored in the experiment ( days). But as the time scale from the fitting is days, which belongs to the data range, we may accurately infer the asymptotic value. This inference is possible because the stabilization is mainly caused by the parasite-like interaction between necrotic and live cells.
Finally, we tried to fit the data with VU2. These attempts were unsuccessful. The impossibility of finding a find a suitable fitting suggests that this system should be classified as VU1. As far as we know, this is arguably the first proven truly Gompertzian system found in the PUN literature (Delsanto et al., 2008; Pugno et al., 2008; Gliozzi et al., 2010, 2011, 2012; Mazzetti et al., 2012). These authors have always found von Bertalanffian systems. Furthermore, a few years ago, González and Rondón (2006) proposed that the Gompertzian function can be obtained from a differential system that involves two populations, one alive and another quiescent. This is exactly the case of an MTS with necrotic core. So the VU1 fit recovers the dynamics of a system of live and quiescent populations without any a priori assumptions on the nature of the data.
3.2.2 In vivo MTS.
Next we apply the VUN formalism to implanted in vivo tumors. The data about tumor progression was taken from Steel (1977). In this case, MTS of the khjj cell line were grown in vitro and then implanted in mice. Although data on the necrosis is not available, Menchón and Condat (2007) used Eq. (10) to show that the addition of a necrotic core leads to a very good fit to the experimental data, while a fit that assumes a homogeneous population fails. Implementation of Eqs. (11) yields estimates that are not too different from those of Menchón and Condat (2007). Note that, in this work, the mass at the onset to necrosis is also taken as a fitting parameter. The parameter values we obtain are g, g1/3/day and 1/day.
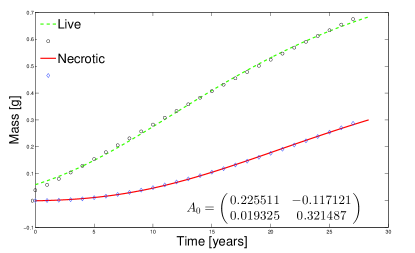
In Fig. 7a, we present a VU1 fitting of the reconstructed data for this in vivo tumor. The values for the determination coefficients are not as remarkable as those for the in vitro case discussed above but they are still very good: and . Of course, implanted tumors lose their spherical shape at long times and the equations (11) become a less accurate approximation. The values for the matrix give results comparable to those in the in vitro experiment: the necrotic cells inhibit the growth of the live cells () and benefit from them () because when the latter die they increase the necrotic population.
The diagonal elements of corresponding to the data of Steel (1977) and of Freyer and Sutherland (1986) are not too different. This is noteworthy because they correspond to different cell lines and very different growth conditions. Since the necrotic cells do not compete among themselves but is reduced by a factor of about , we may infer that this reduction is due to the different nature of the in vivo experiment. Not only is the hydrostatic pressure in the in vivo system greater than that in the in vitro case, hindering cell multiplication and thus decreasing the value of , but the biochemical environment may be conducive to a faster removal of necrotic cells, leading to a decrease in the value of , too.
The characteristic time is now significantly longer than in the in vitro experiment (over 13 days against 9.7 days). This difference can be explained by the hostility of the in vivo environment (expressed through the enhanced hydrostatic pressure and the immune response of the host organism), which leads to a slower growth of the tumor implanted in a mammal host as compared to that of an in vitro system.
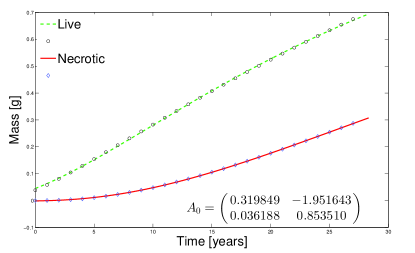
Here we also tried a VU2 fit, which is shown in Fig. 7b. The fit turns out to be of higher quality than that obtained from VU1, as we can visually recognize (note, for instance, the improved accuracy at the ends of the live cell curve), and confirm from the higher values obtained for . The accuracy of the VU2 fit (inexistent for the spheroids of 3.2.1) seems to indicate the higher complexity of the in vivo system, which may demand a more complex class of growth functions. All the matrix elements preserve their signs and the interpretation stemming from the VU1 study, but their magnitudes are magnified. The joint characteristic time for VU2 is days, shorter than its VU1 counterpart. Here we fixed the value in order to describe diffusion-limited feeding West et al. (2001); Delsanto et al. (2004). Table 2 exhibits the parameter values we found for this problem.
In summary, the above in vitro and in vivo examples show that, at least in their initial stages, tumors growing in very different environments exhibit similar macroscopic behavior, with the number of live cells initially growing very fast and then saturating, while a necrotic core emerges, which is considerably smaller in vivo. Both cases are well described by the VU1 universality class, although VU2 may be preferred for the more complex in vivo systems.
| In vitro | |||||
|---|---|---|---|---|---|
| VU1 | 0.3749 | 0.5113 | -0.0927 | 0.0498 | -0.104 |
| In vivo | |||||
| VU1 | 0.2255 | 0.3215 | -0.1171 | 0.0193 | -0.075 |
| VU2 | 0.3198 | 0.8535 | -1.9516 | 0.0362 | -0.038 |
3.3 Growth of Subspheroids
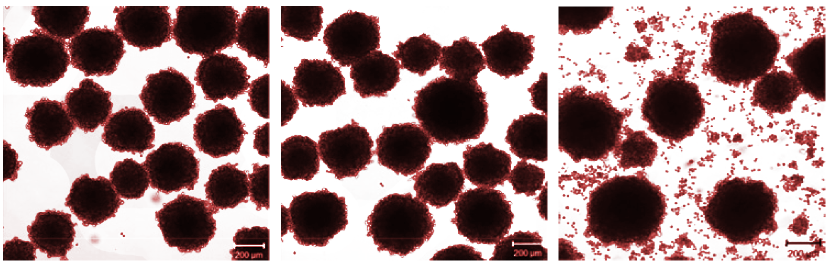
Cell shedding by a primary tumor is an important factor in the formation of metastatic colonies. It is controlled by adhesiveness Menchón and Condat (2009). Adhesiveness can be increased by polyphenols, which may then inhibit cell escape Günther et al. (2007). In an experimental study of invasion and metastasis, Günther et al. (2007) grew mammalian MTS of the breast cancer cell line 4T1. The aim of their work was to understand the factors that regulate the shedding of cells from primary tumors as functions of time and the size of the subspheroids that grow from the detached cells.
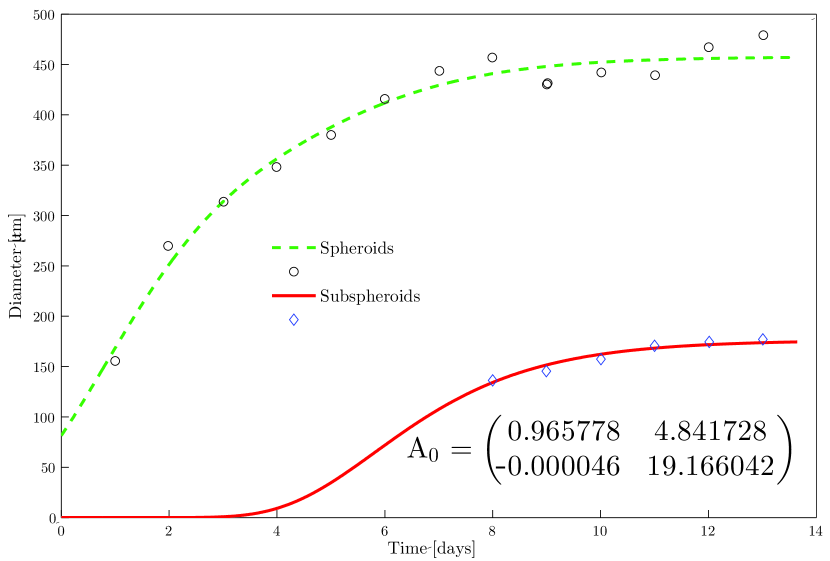
The panels in Fig. 8a, taken from Günther (2007), show the spheroid populations on days 4, 6 and 9 of culture, respectively. In the right panel we observe the subspheroids grown from the cells detached from the primary spheroids. In this case it is not possible to find a suitable VU2 fit, but the VU1 fit is completely satisfactory. As shown in Fig. 8b, even without assuming the absence of subspheroids at , it is possible to obtain a fit able to predict the absence of a detectable subspheroid population for over three days. The diagonal elements of the matrix are very different to account for the rather unequal characteristic growth times. Indeed, very different eigenvalues of are needed in order to generate two growth functions with so dissimilar growth rates.
The high value of suggests that the primary spheroids derive a large benefit from their interaction with the subspheroids. The detachment of peripheral cells allows more central ones to get nutrients, stay alive and even reproduce. On the other hand, the detached cells must survive competing for nutrients and space with the primary spheroids, which, at this stage, are hard contenders. Therefore, it is not surprising that , even if its magnitude is very small. But subspheroid growth is strong because (a) they derive from very active shed cells, and (b) their initial small size allows them to occupy spaces with room to grow and high nutrient concentration. The high value of can then be understood as related to the enhancement of the survival capability of the shed cells because they have passed a natural selection test.
4 Discussion
Cancer growth is often the result of the competition between two or more cell populations. The Vector Universalities (VUN) formalism introduced in Barberis et al. (2011) and Barberis and Condat (2012) can be used to extract information of time series describing the correlated evolution of these populations. We have used this tool to analyze four very different examples of tumor growth, showing that they can be included in three universality classes and extracting information about various aspects of cancer growth from the observed correlations.
The VU0 class may fit concurrent unrestricted growth. To study an instance of joint growth in this class we measured the simultaneous evolution of two HeLa cell populations (one motile and one reproductive). In this case, it was easy to decide a priori that VU0 was a suitable tool, because we already knew that the colonies were growing in an unbounded and well-nourished environment, a condition that suggests the implementation of the exponential class. A possible difficulty is that when data is scarce multiple good fits may be obtained. In these cases additional information about the system must be taken into account to choose the optimal parameter set. The VU0 tell us why the populations deviate from a purely exponential behavior; they also suggest that a signaling mechanism initiated by the proliferating cells may be responsible for the phenotypic switching of motile cells. Further experimental work is necessary to directly verify this hypothesis.
The VU1 examples in subsections 3.2.1 and 3.3 are the first to be clearly identified as such in the phenomenological universalities literature. Here it is important to note that the von Bertalanffy class (), in both the scalar and vector formalisms, adds new degrees of freedom to the fitting problem. If we accept the often used criterion of calculating the value to classify the growth phenomena inside the universality class hierarchy, it is easy to see that in most instances it is possible to find that the VU2 class provides a “better fit”. In fact, this is the situation in most of the previous PUN work (see Delsanto et al. (2008) for an example). Because of the VU2 additional degrees of freedom we prefer not to use as a final arbiter when there is no substantial difference between its value for the VU1 and VU2 fits of the same dataset. Instead, in a previous work , we use the Occam’s razor criterion as the main argument to classify the phenomena as belonging to the VU1 class (Barberis and Condat, 2012). Moreover, our knowledge about the biological problem can be used to select the VU2 classification; in example 3.2.2, we have very good fittings in both universality classes. To assign such a system to one or another class is not a simple task and here we do not attempt to do it in general because there is no reliable criterion to define the best class. Instead, our goal is to gather new information for the multipopulation systems from the values of the matrix. For instance, the matrices recovered in the example in 3.2.2 give coherent information in both classes, so the classification problem is not really relevant here.
It is interesting that we fail to find any adequate VU2 fitting parameter set for the examples in subsections 3.2.1 and 3.3. In the case of subsection 3.3, we suspect that the absence of an appreciable subspheroid population at early times could play the role of quiescent cells driving the behavior: isolated active cells leave the “mother” spheroids in the same way as dying cells leave the live cell population in the MTS problem of subsection 3.2. As it was explained in section 3.2.1, the theoretical development of Gompertzian growth is consistent with this description.
As it was pointed out by its creator P.P. Delsanto, the PUN formalism is a novel tool for interdisciplinary and experimental research Gliozzi et al. (2011). The VUN extension can be used to find very accurate fitting functions for experimental data, as shown in sections 3.1 and 3.3. It may also be used to test the capability of a theoretical model to reproduce experimental data and define their applicability range, as we did in section 3.2. For cancer researchers, the main advantage of this approach lies in its ability to describe tumor growth using few parameters (whose interpretation is reasonably simple), without making any assumptions on the tissue physiology.
In order to test the reliability and accuracy of the method, the important, and as yet not well understood, problem of the role of the necrotic core in MTS growth was considered. In particular, we analyzed the classical MTS growth data of Freyer and Sutherland (1986). The result in Fig. 6b, with a value of and the prediction of a reasonable saturation mass, verifies the validity of the approach. The similarities and differences between in vivo and in vitro tumors are highlighted by the similarities and differences between their respective and parameters, as shown in Table 2. We remark that the VUN allowed us to obtain excellent fits to the reconstructed data for the evolution of the volumes occupied by the individual (necrotic and live) cell populations. These reconstructed volumes were obtained from a single dataset describing the evolution of the total volume of the MTS.
Polyphenols such as baicalein and resveratrol have been shown to increase cell adhesiveness in experimental tumor models Günther et al. (2007). Therefore, they can be used to decrease cell detachment and limit the availability of subspheroid seeds, while spheroid coalescence is favored. We predict that, analyzed under the VU1 formalism, the application of these polyphenols should lead to a strong decrease in both (fewer seeds due to increased adhesiveness) and (the inner cells in the primaries are not exposed to additional nutrients due to shedding of the outer shell). VUN fittings to the growth data for the spheroid-subspheroid system could then be used to evaluate the ability of a given polyphenol to decrease the metastatic potential of the cell population under consideration. This ability would be quantified by the matrix elements and .
Summarizing, the implementation of the VUN fitting technique for the analyzed data sets allow us to conclude that:
-
1.
VU0 allows us to better understand and quantify the growth mechanisms of a HeLa cell colony. Phenotype switching is described by the VU0 parameters and resembles the conditions defining the “go or grow” hypothesis.
-
2.
VU1 confirms that a reconstruction of the (unobserved) MTS necrotic core mass from the total mass data sets is self-consistent and predicts the final spheroid volume starting from a truncated data set.
-
3.
VU1 indicates there is a strong similarity between in vitro and in vivo cancer growth. It helps us identify quantifiable shared intrinsic features and describe how the different environments affect growth (slowing it down in the in vivo samples).
-
4.
VU1 validates the consistency of the hypothesis that necrotic cells generate signals that (a) restricts growth and (b) kills live cells.
-
5.
VUN leads to a better understanding of the interaction between spheroids and subspheroids and could help to characterize the effect of polyphenols on cancer cell shedding and dispersal.
As a final remark we would like to emphasize that the formalism used in this contribution may also be applied to the analysis of other datasets related to ecological management and population dynamics. Examples on these topics were provided in Barberis and Condat (2012). Further developments to include more than two populations, seasonality, and external forcing are in progress.
Acknowledgements
This work was supported by SECyT-UNC (Project 30720110100436) and CONICET (PIP 00772 and PIP 02231), Argentina.
Appendix A Theoretical examples
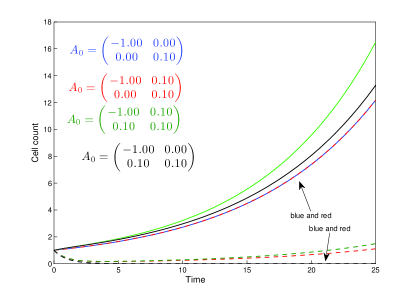
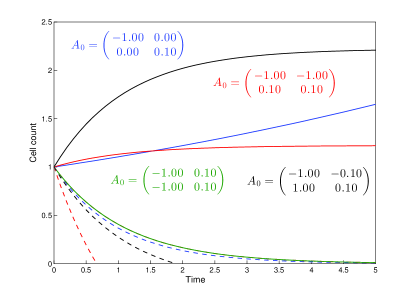
The behavior of the functions belonging to the VU0 class is regulated by a linear combination of the exponential functions . As a benchmark, we have chosen a two-agent system and a trait that would evolve according to a diagonal matrix whose elements have opposite signs. Such a matrix corresponds to agents that only influence each other directly, i.e., without modifying their own environment. We show in Figures 9 and 10 several examples of interactions. Blue lines and blue matrices correspond to the reference situation. Note that the first individual lives in a very hard environment ( large and negative), while the second one has a moderately friendly environment ( small and positive). As a consequence the “size” of the trait in the first agent decreases, disappearing after 5 time units, while that of the second agent exhibits continuous growth.
Exponential growth: Figure 9 shows several examples that illustrate how the reference situation is changed by the addition of off-diagonal elements. Figure 9a describes cooperation when there is an extra gain represented by positive off-diagonal elements. Note how what was a disappearing trait/population represented by the blue dashed line the reference case, picks up growth due to the interaction and, as a consequence, the trait/population survives. Figure 9b shows the case mentioned in section 3.1: the annihilation of one population (dashed line) or the regrowth of an initially decaying population (continuous green) in the presence of competition. Note that in the case described by the dashed red line annihilation occurs five times faster. On the other hand, Fig. 9c shows an example of parasitism (opposite signs of the off-diagonal elements) leading to different survival times. Of course there is a manifold of matrix element combinations that would allow us to describe many possible situations.
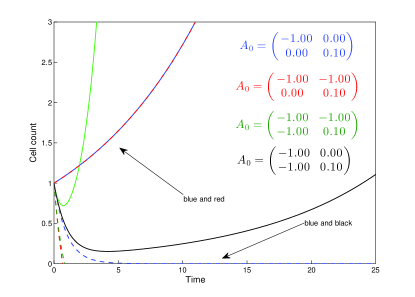
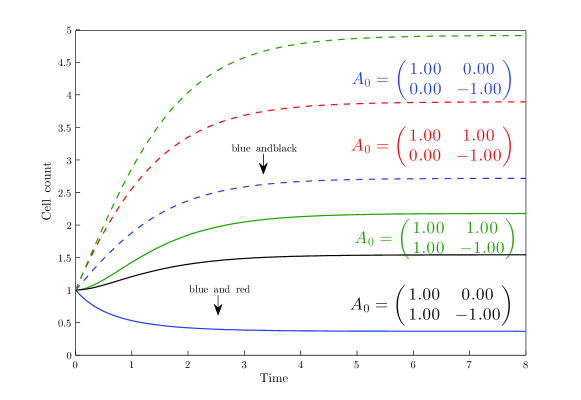
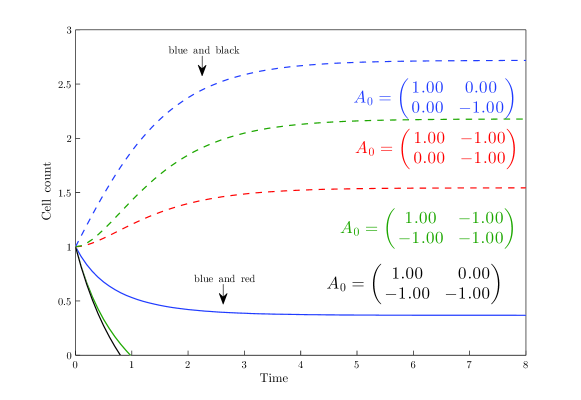
Gompertzian growth: As in the previous exponential case, we show in Fig. 10 several examples of the possible behavior of the VU1 system. Cooperation, competition, and parasitism can be addressed by a suitable choice of the off-diagonal elements of . The diagrams are self-descriptive.
References
- Bajzer et al. (1996) Bajzer, Z., Vuk-Pavlović, S., Huzac, M., 1996. A Survey of Models for Tumor-immune System Dynamics. Birkhauser, Boston.
- Barberis and Condat (2012) Barberis, L., Condat, C.A., 2012. Describing interactive growth using vector universalities. Ecol. Mod. 227, 56–63.
- Barberis et al. (2010) Barberis, L., Condat, C.A., Gliozzi, A.S., Delsanto, P.P., 2010. Concurrent growth of phenotypic features: a phenomenological universalities approach. J. Theor. Biol. 264, 123–129.
- Barberis et al. (2011) Barberis, L., Condat, C.A., Román, P., 2011. Vector growth universalities. Chaos, Solitons & Fractals 44, 1100–1105.
- Bertuzzi et al. (2010) Bertuzzi, A., Fasano, A., Gandolfi, A., Sinisgalli, C., 2010. Necrotic core in EMT6/Ro tumour spheroids: Is it caused by an ATP deficit? J.Theor. Biol. 262, 142–50.
- Burton (1966) Burton, A.C., 1966. Rate of growth of solid tumours as a problem of diffusion. Growth 30, 159.
- Byrne and Preziosi (2003) Byrne, H., Preziosi, H., 2003. Modeling solid tumor growth using the theory of mixtures. Math. Med. Biol. 20, 341––366.
- Castorina et al. (2006) Castorina, P., Delsanto, P., Guiot, C., 2006. Classification scheme for phenomenological universalities in growth problems in physics and other sciences. Phys. Rev. Lett. 96, 188701.
- Condat and Menchón (2006) Condat, C.A., Menchón, S.A., 2006. Ontogenetic growth of multicellular tumor spheroids. Phys. A 371, 76.
- Corcoran (2003) Corcoran, A and Del Maestro, R., 2003. Testing the ”Go or Grow” hypothesis in human medulloblastoma cell lines in two and three dimensions. Neurosurgery 53, 174–84.
- Dallon et al. (2001) Dallon, J.C., Sherratt, J.A., Maini, P.K., 2001. Modeling the effects of transforming growth factor on extracellular alignment in dermal wound repair. Wound Rep. 9, 278–286.
- Delsanto et al. (2011) Delsanto, P.P., Gliozzi, A.S., Barberis, L., Condat, C.A., 2011. A phenomenological universalities approach to the analysis of oscillatory systems. Physics Letters A 375, 2262–2268.
- Delsanto et al. (2008) Delsanto, P.P., Gliozzi, A.S., Guiot, C., 2008. Scaling, growth and cyclicity in biology: a new computational approach. Theor. Biol. Med. Mod. 5, 5.
- Delsanto et al. (2004) Delsanto, P.P., Guiot, C., Degiorgis, P.G., Condat, C.A., Mansury, Y., Deisboeck, T.S., 2004. Growth model for multicellular tumor spheroids. Appl. Phys. Lett. 85, 4225.
- Dolak and Schmeiser (2005) Dolak, Y., Schmeiser, C., 2005. Kinetic models for chemotaxis: Hydrodynamic limits and spatio-temporal mechanics. J. Math. Biol. 51, 595––615.
- Folkman and Hochberg (1973) Folkman, Hochberg, 1973 .
- Freyer and Sutherland (1986) Freyer, J.P., Sutherland, R.M., 1986. Regulation of growth saturation and development of necrosis in EMT6/Ro multicellular spheroids by the glucose and oxygen Supply. Cancer Res. 46, 3504.
- Fujikawa and Matsushita (1989) Fujikawa, H., Matsushita, M., 1989. Fractal growth of bacillus subtilis on agar plates. J. Phys. Soc. Jpn. 58, 3875–3878.
- Garay et al. (2013) Garay, T., Juhász, E., Molnár, E., Eisenbauer, M., Czirók, A., Dekan, B., László, V., Hoda, M A and Döme, B., Tímár, J., Klepetko, W., Berger, W., Hegedüs, B., 2013. Cell migration or cytokinesis and proliferation?–revisiting the ”go or grow” hypothesis in cancer cells in vitro. Exp. Cell Res. 319, 3094–3103.
- Gerlee and Nelander (2012) Gerlee, P., Nelander, S., 2012. The Impact of Phenotypic Switching on Glioblastoma Growth and Invasion. PLoS Comput. Biol. 8, e1002556.
- Gibot et al. (2013) Gibot, L., Wasungu, L., Teissié, J., Rols, M.P., 2013. Antitumor drug delivery in multicellular spheroids by electropermeabilization. J. Control. Release 167, 138––147.
- Gliozzi et al. (2010) Gliozzi, A.S., Guiot, C., Chignola, R., Delsanto, P.P., 2010. Oscillations in growth of multicellular tumour spheroids: a revisited quantitative analysis. Cell Prolif. 43, 344.
- Gliozzi et al. (2012) Gliozzi, A.S., Guiot, C., Delsanto, P.P., Iordache, D.A., 2012. A novel approach to the analysis of human growth. Theoretical biology & Medical Modelling 9, 17.
- Gliozzi et al. (2011) Gliozzi, A.S., Mazzetti, S., Delsanto, P.P., Regge, D., Stasi, M., 2011. Phenomenological universalities: a novel tool for the analysis of dynamic contrast enhancement in magnetic resonance imaging. Phys. in Med. and Biol. 56, 573–586.
- González and Rondón (2006) González, J., Rondón, I., 2006. Cancer and nonextensive statistics. Physica A: Statistical Mechanics and its Applications 369, 645–654.
- Groebe and Mueller-Klieser (1996) Groebe, K., Mueller-Klieser, W., 1996. On the relation between size of necrosis and diameter of tumor spheroids. Radiat. Oncol. Biol. Phys. 34, 395.
- Guiot et al. (2003) Guiot, C., Degiorgis, P.G., Delsanto, P.P., Gabriele, P., Deisboeck, T.S., 2003. Does tumor growth follow a universal law? J. Theor. Biol. 225, 147–151.
- Guiot et al. (2006) Guiot, C., Delsanto, P.P., Carpinteri, A., Pugno, N., Mansury, Y., Deisboeck, T.S., 2006. The dynamic evolution of the power exponent in a universal growth model of tumors. J. Theor. Biol. 240, 459–463.
- Günther et al. (2007) Günther, S., Ruhe, C., Derikito, M.G., Böse, G., Sauer, H., Wartenberg, M., 2007. Polyphenols prevent cell shedding from mouse mammary cancer spheroids and inhibit cancer cell invasion in confrontation cultures derived from embryonic stem cells. Cancer Lett. 250, 25.
- Gupta and Johansson (2012) Gupta, R.K., Johansson, S., 2012. Β1 integrins restrict the growth of foci and spheroids. Histochem. Cell Biol. 138, 881–894.
- Hatzikirou et al. (2012) Hatzikirou, H., Basanta, D., Simon, M., Schaller, K., 2012. ’go or grow’: the key to the emergence of invasion in tumour progression? Math. Med. Biol. 29, 49–65.
- Hatzikirou and Deutsch (2008) Hatzikirou, H., Deutsch, A., 2008. Cellular Automata as Microscopic Models of Cell Migration in Heterogeneous Environments. Current Topics in Developmental Biology 81, 1–34.
- Jiang et al. (2005) Jiang, Y., Pjesivac-Grbovic, J., Cantrell, C., Freyer, J.P., 2005. A multiscale model for avascular tumor growth. Biophys. J. 89, 3884–3894.
- Kazmi et al. (2012) Kazmi, N., Hossain, M.a., Phillips, R.M., Al-Mamun, M.a., Bass, R., 2012. Avascular tumour growth dynamics and the constraints of protein binding for drug transportation. J.Theor. Biol. 313, 142–152.
- Keller and Segel (1971) Keller, E.F., Segel, L.A., 1971. Traveling bands of chemotactic bacteria: A theoretical analysis. J. Theor. Biol. 30, 235–248.
- Laird et al. (1965) Laird, A.K., Tyler, S.A., Barton, A.D., 1965. Dynamics of normal growth. Growth 29, 233–248.
- Marusić et al. (1994) Marusić, M., Bajzer, Z., Freyer, J.P., Vuk-Pavlović, S., 1994. Analysis of growth of multicellular tumour spheroids by mathematical models. Cell proliferation 27, 73–94.
- Mazzetti et al. (2012) Mazzetti, S., Gliozzi, a.S., Bracco, C., Russo, F., Regge, D., Stasi, M., 2012. Comparison between PUN and Tofts models in the quantification of dynamic contrast-enhanced MR imaging. Phys. in Med. and Biol. 57, 8443–8453.
- McMahon et al. (2012) McMahon, K.M., Volpato, M., Chi, H.Y., Musiwaro, P., Poterlowicz, K., Peng, Y., Scally, A.J., Patterson, L.H., Phillips, R.M., Sutton, C.W., 2012. Characterization of changes in the proteome in different regions of 3D multicell tumor spheroids. J. Proteome Res. 11, 2863–2875.
- Mehta et al. (2012) Mehta, G., Hsiao, A.Y., Ingram, M., Luker, G.D., Takayama, S., 2012. Opportunities and challenges for use of tumor spheroids as models to test drug delivery and efficacy. J. Control. Release 164, 192–204.
- Menchón and Condat (2007) Menchón, S.A., Condat, C.A., 2007. Macroscopic dynamics of cancer growth. Eur. Phys. J. Special Top. 143, 89–94.
- Menchón and Condat (2009) Menchón, S.A., Condat, C.A., 2009. Modeling tumor cell shedding. Eur. Biophys. J. , 479–485.
- Mombach et al. (2002) Mombach, J.C.M., Lemke, N., Bodmann, B.E.J., Idiart, M.A.P., 2002. A mean-field theory of cellular growth. Europhys. Lett. 59, 923–928.
- Mueller-Klieser (2000) Mueller-Klieser, W., 2000. Tumor biology and experimental therapeutics. Crit. Rev. Oncol. Hematol. 36, 123.
- Murray et al. (1983) Murray, J.D., Oster, G.F., Harris, A.K., 1983. Amechanical model for mesenchymalmorphogenesis. Int. J. Food Microbiol. 17, 125–129.
- Peruani and Morelli (2007) Peruani, F., Morelli, L., 2007. Self-propelled particles with fluctuating speed and direction of motion in two dimensions. Phys. Rev. Lett. 99, 010602.
- Pugno et al. (2008) Pugno, N., Bosia, F., Gliozzi, A., Delsanto, P., Carpinteri, A., 2008. Phenomenological approach to mechanical damage growth analysis. Phys. Rev.E 78, 1.
- Radszuweit et al. (2009) Radszuweit, M., Block, M., Hengstler, J., Schöll, E., Drasdo, D., 2009. Comparing the growth kinetics of cell populations in two and three dimensions. Phys. Rev. E 79, 1–12.
- Steel (1977) Steel, G.G., 1977. Growth Kinetics of Tumours. Oxford, Clarendon Press.
- de Vladar (2006) de Vladar, H.P., 2006. Density-dependence as a size-independent regulatory mechanism. J. Theor. Biol. 238, 245.
- Wartenberg et al. (1999) Wartenberg, M., Diedershagen, H., Hescheler, J., Sauer, H., 1999. Growth stimulation versus induction of cell quiescence by hydrogen peroxide in prostate tumor spheroids is encoded by the duration of the Ca(2+) response. J.Biol. Chem. 274, 27759.
- West et al. (2001) West, G.B., Brown, J.H., Enquist, B.J., 2001. A general model for ontogenetic growth. Nature 413, 628.
- Zwietering et al. (1990) Zwietering, M.H., Jongenburger, I., Rombouts, F.M., Van ’T Riet, K., 1990. Modeling of the bacterial growth curve. Appl. Environ. Microbiol. 56, 1875–1881.
- Zwietering et al. (1996) Zwietering, M.H., de Wit, J.C., Notermans, S., 1996. Application of predictive microbiology to estimate the number of bacillus cereus in pasteurised milk at the point of consumption. Int. J. Food Microbiol. 30, 55–70.
† Reprinted by permission from Macmillan Publishers Ltd: Nature, Han, M et al.,“ Enhanced Percolation and Gene Expression in Tumor Hypoxia by PEGylated Polyplex Micelles” 17(8), copyright (2009)
‡ Reprinted from Cancer Lett., 250(1), Günther, S et al., “Polyphenols prevent cell shedding from mouse mammary cancer spheroids and inhibit cancer cell invasion in confrontation cultures derived from embryonic stem cells”, 25, Copyright (2007), with permission from Elsevier.